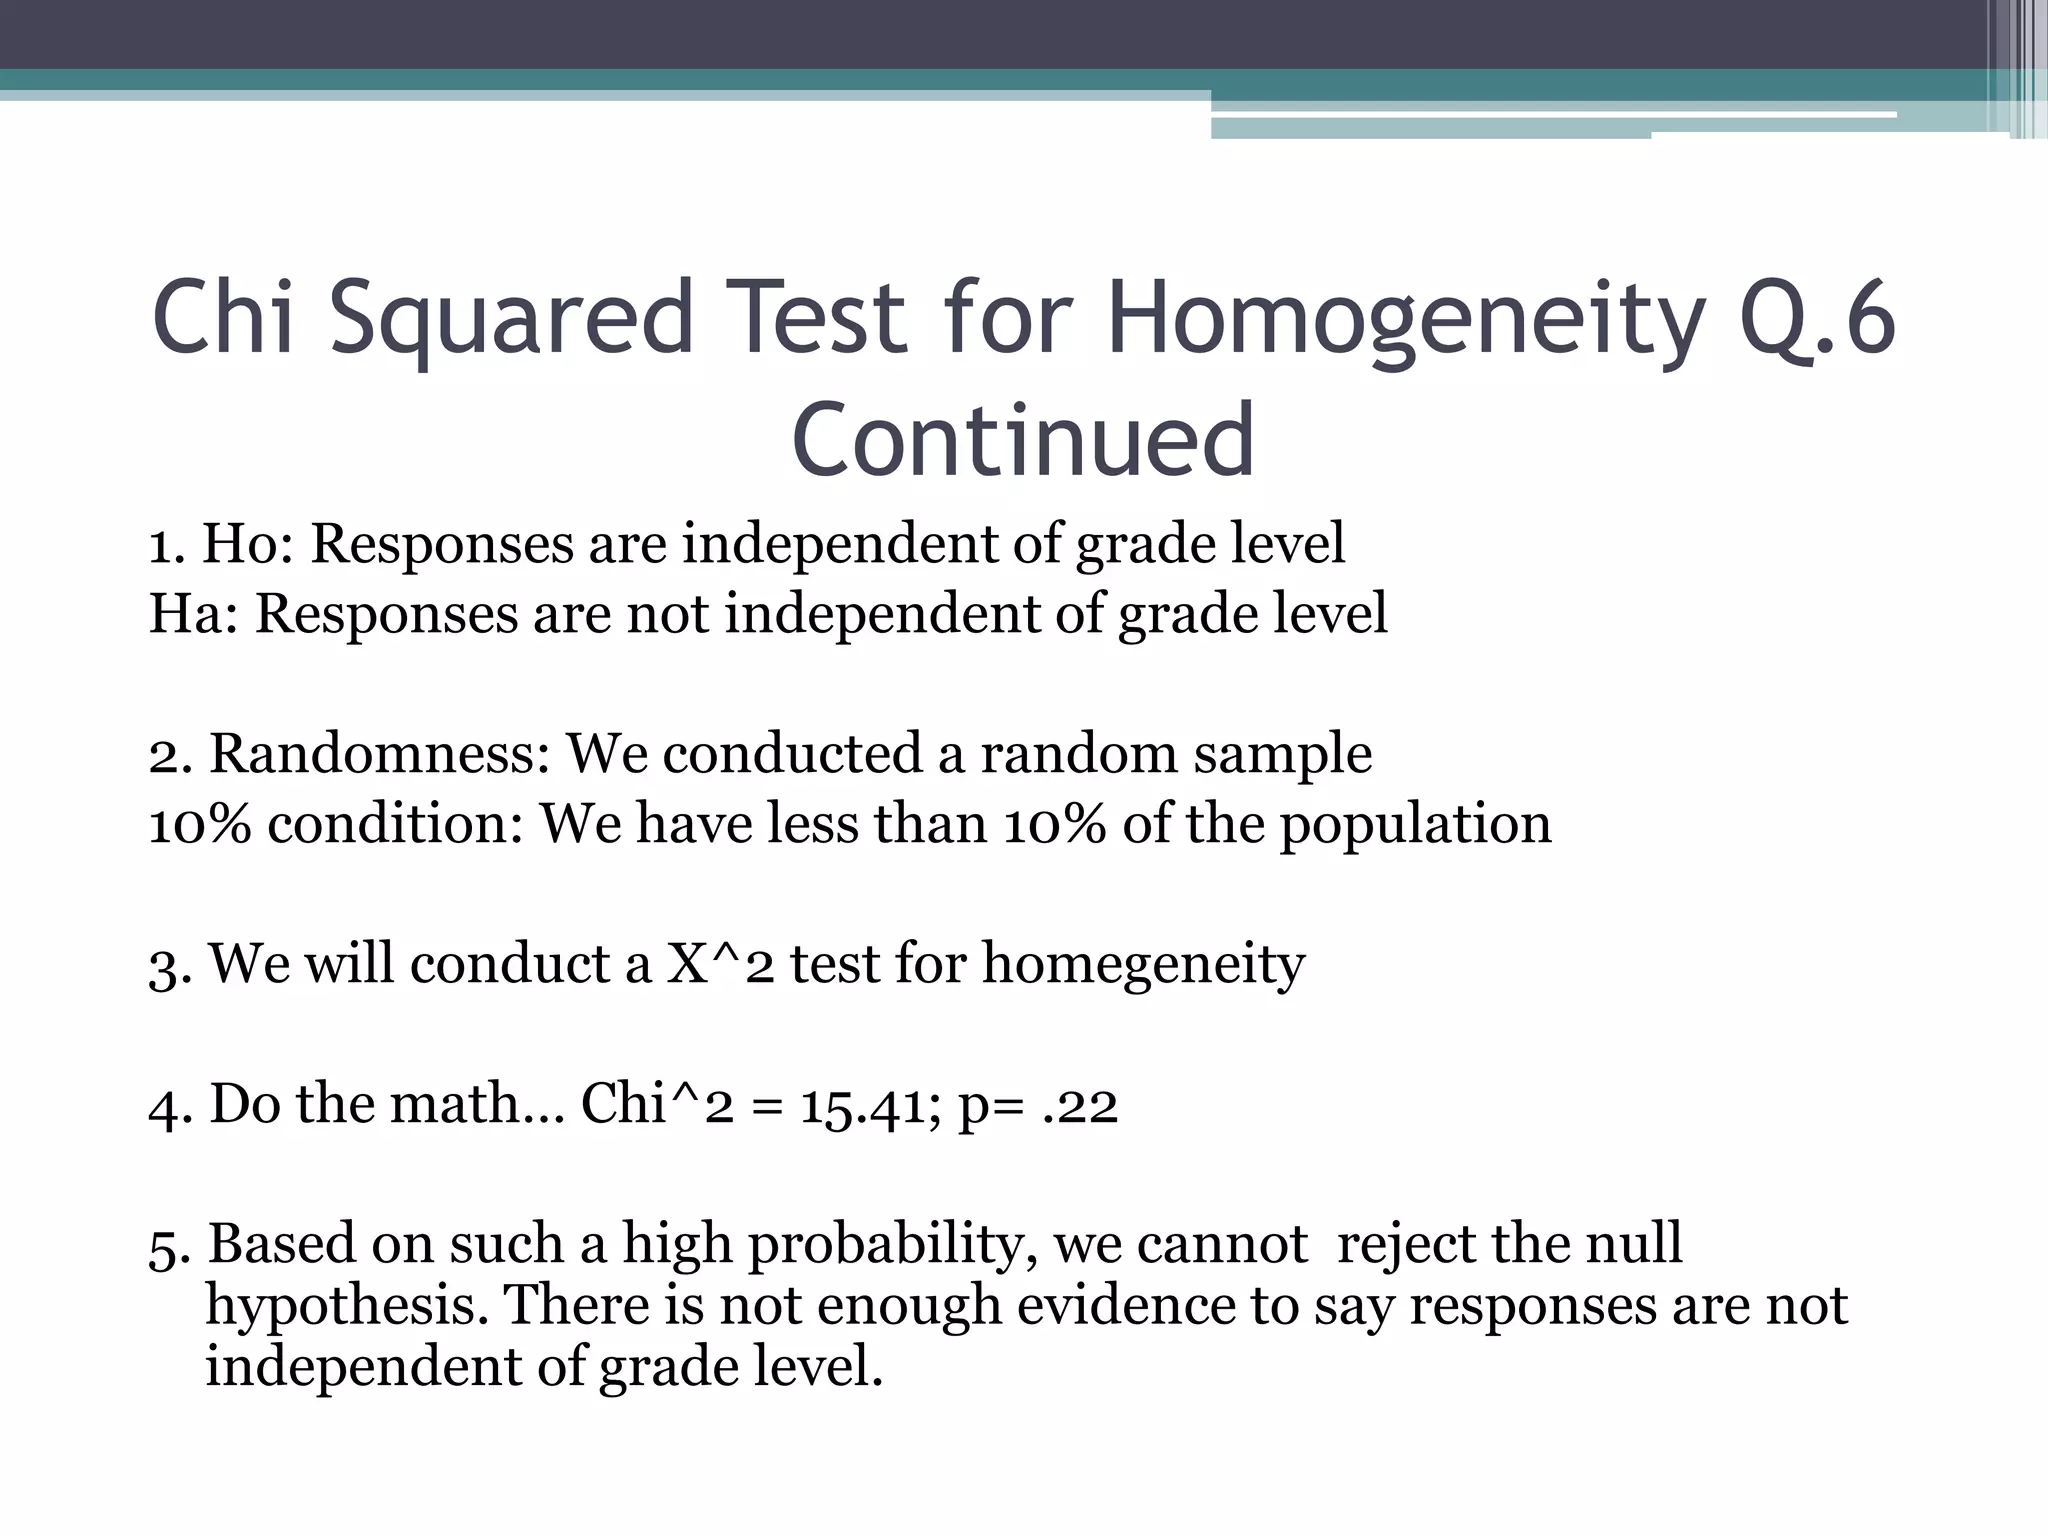
This document describes the results of a statistical survey project conducted by Jonathan Peñate and Arnold Gonzalez. It includes the survey questions, sample sizes, means, standard deviations, and confidence intervals calculated for various survey questions. It also includes hypothesis tests comparing results to larger studies and testing for differences in responses between groups. The confidence intervals and hypothesis tests indicate there is no strong evidence of differences in the means or proportions compared.
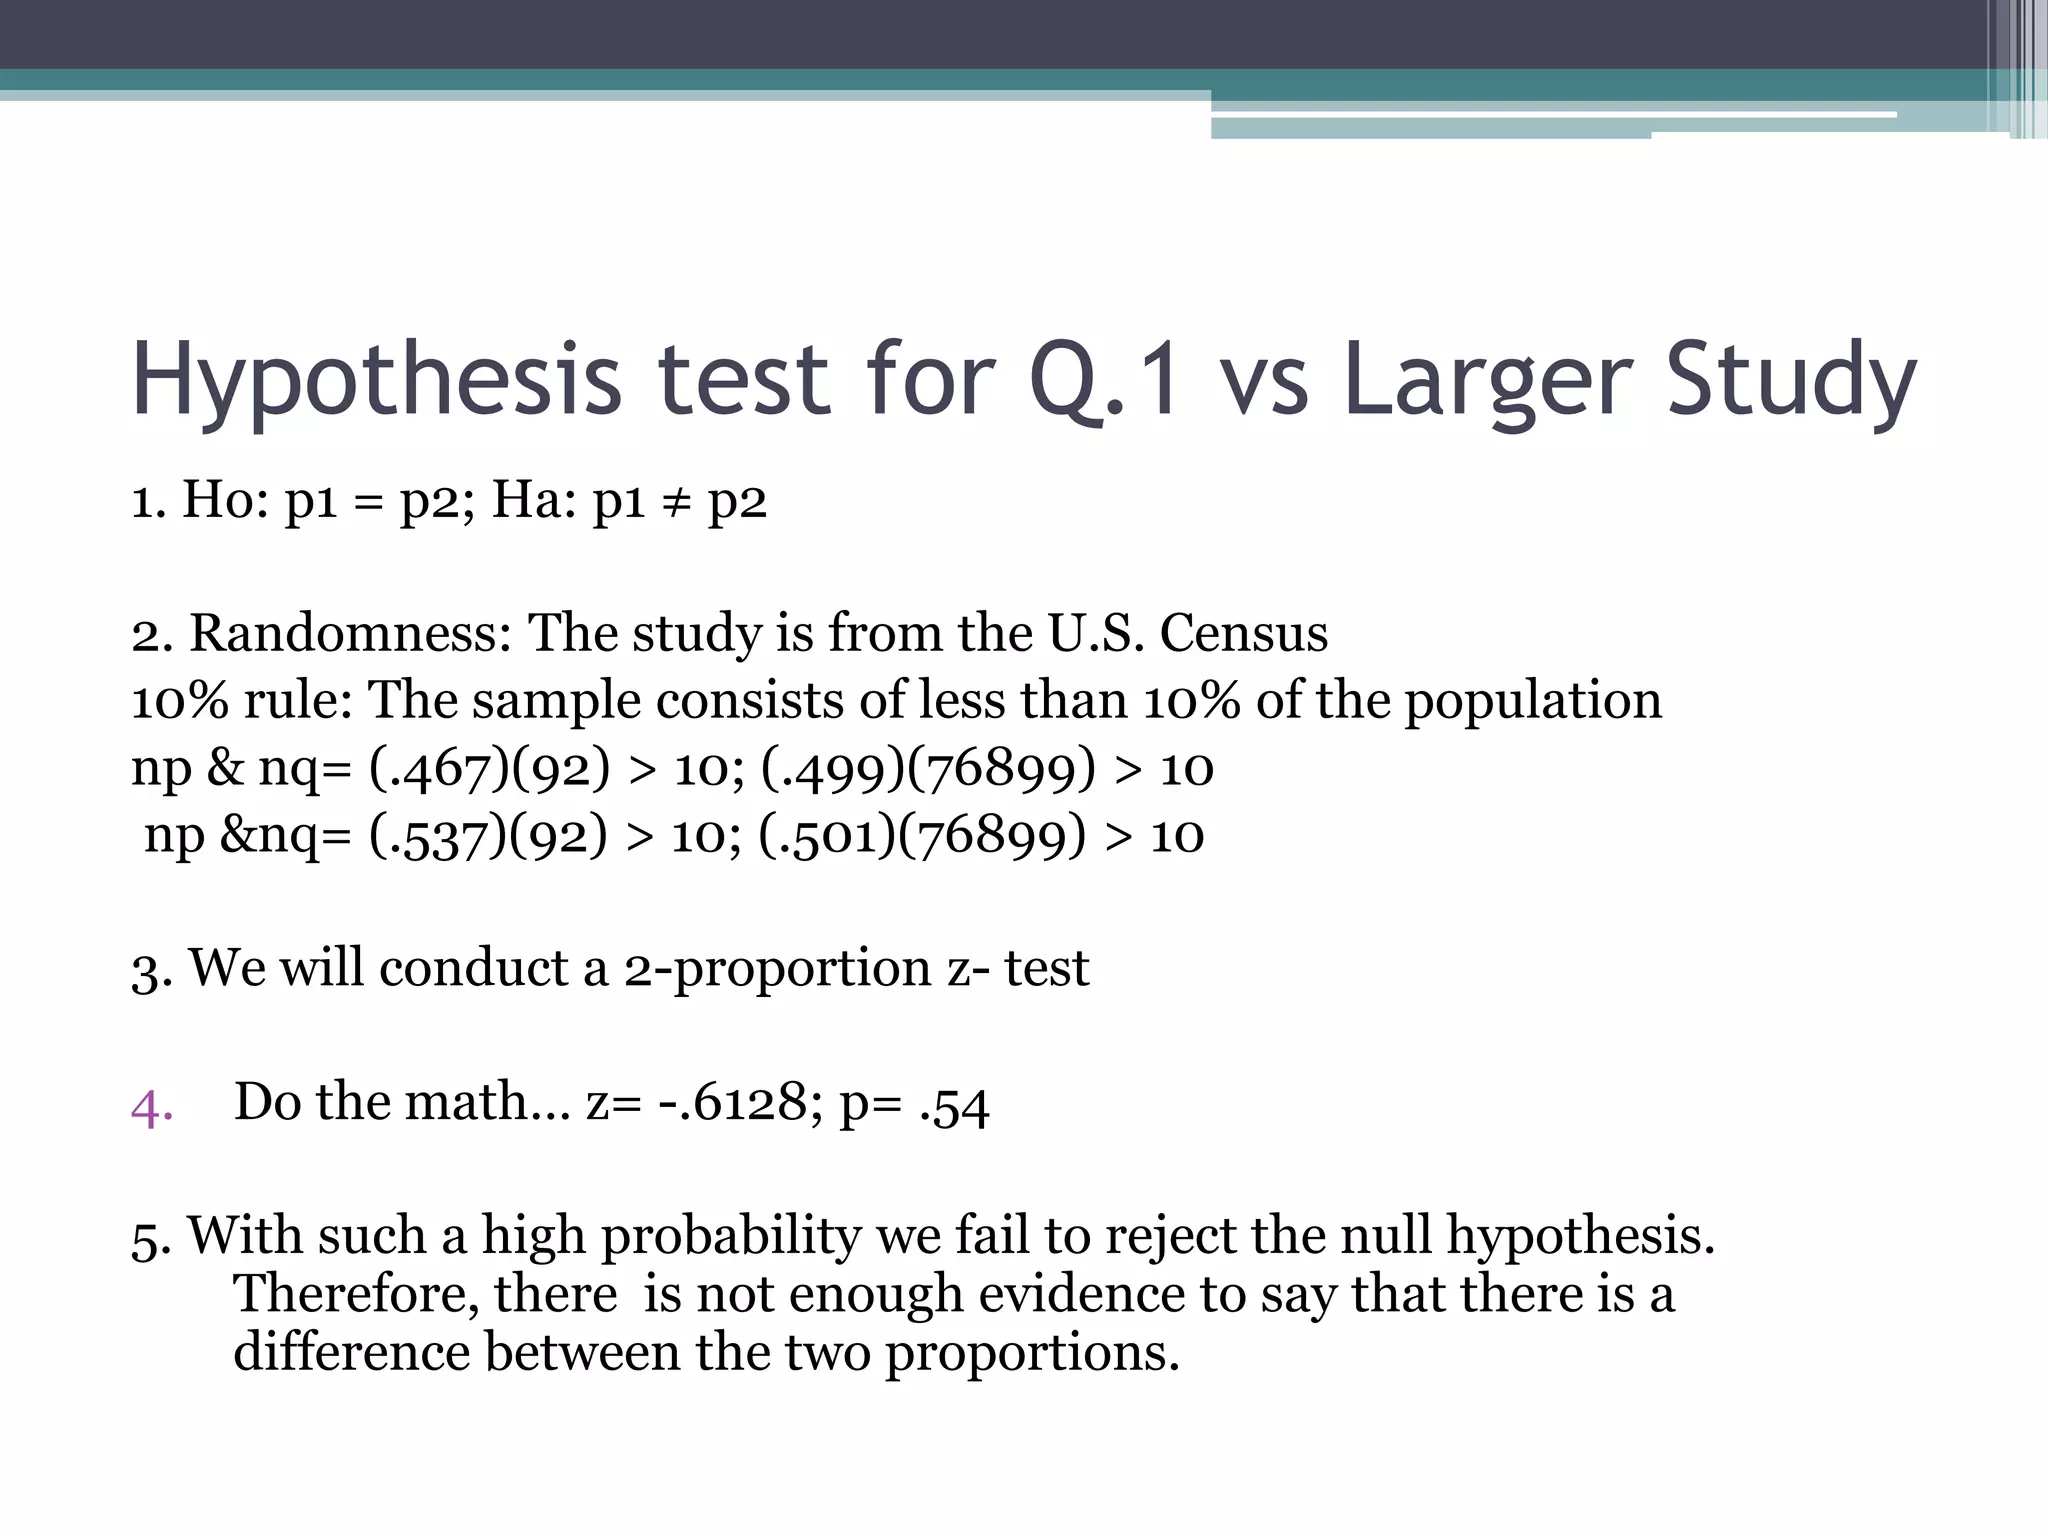
![Confidence Interval for Proportion Q.1What is your gender? p= malesp= .467, q= .532, z*=1.96, n=92.467- 1.96*sqt[(.467)(.532)/92]= .365.467+ 1.96*sqt[(.467)(.532)/92] = .569Confidence Interval= (.365, .569)We are 95% that the proportion of male students is between .365 and .569](https://image.slidesharecdn.com/statisticalsurveyproject-110604215906-phpapp02/75/Statistical-survey-project-11-2048.jpg)
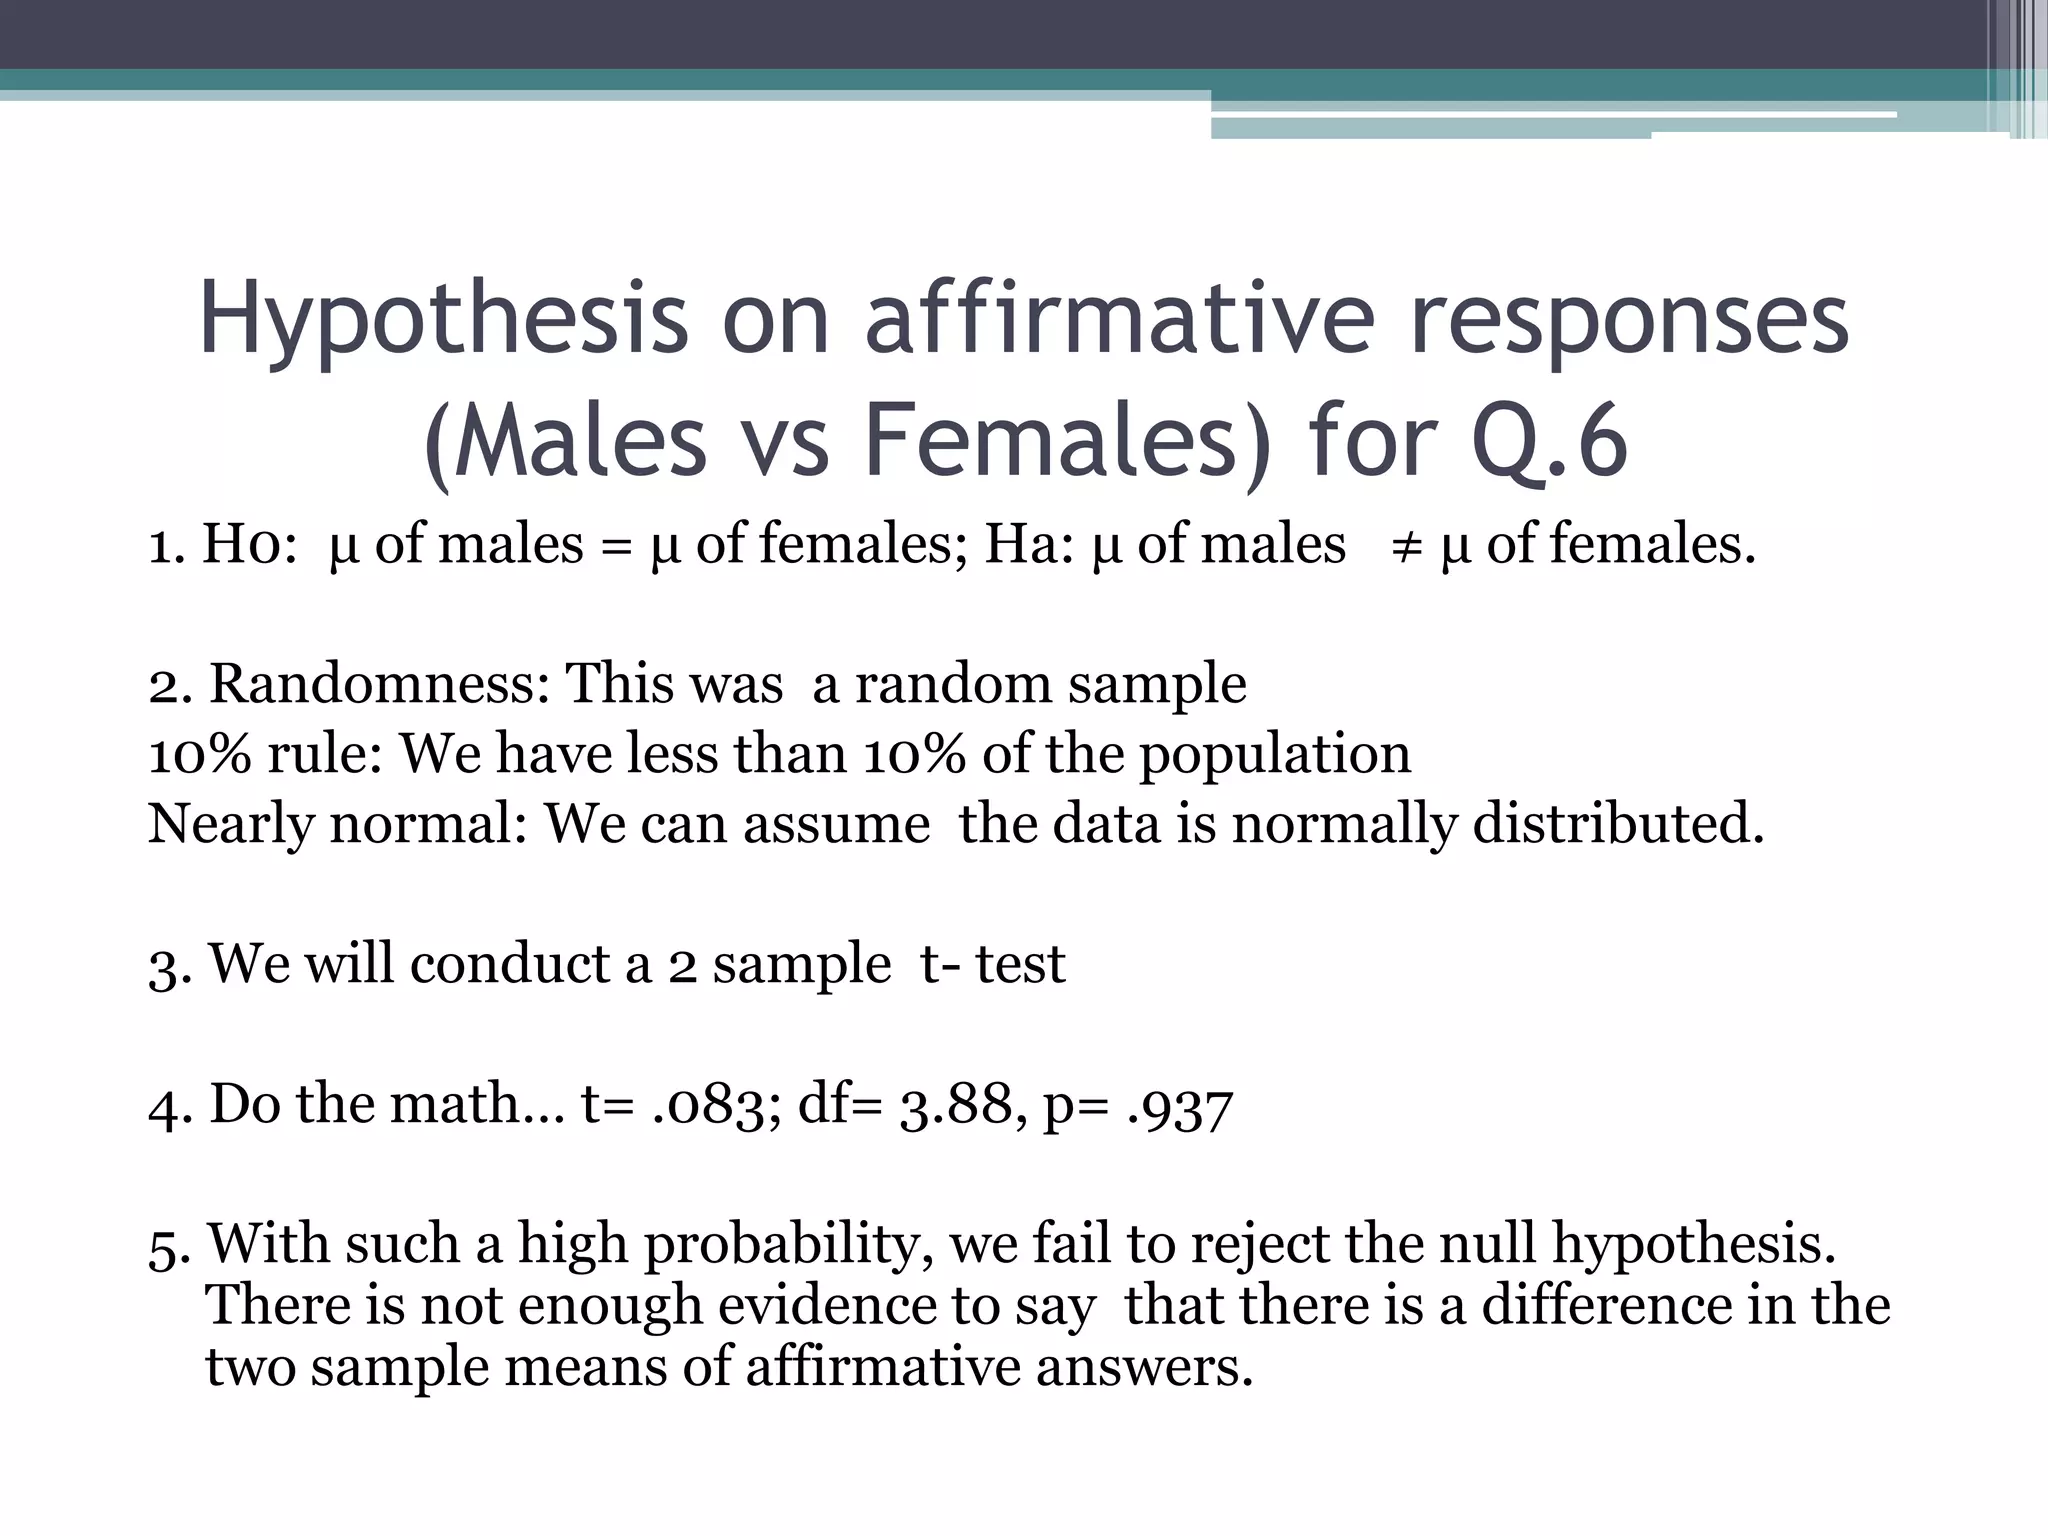
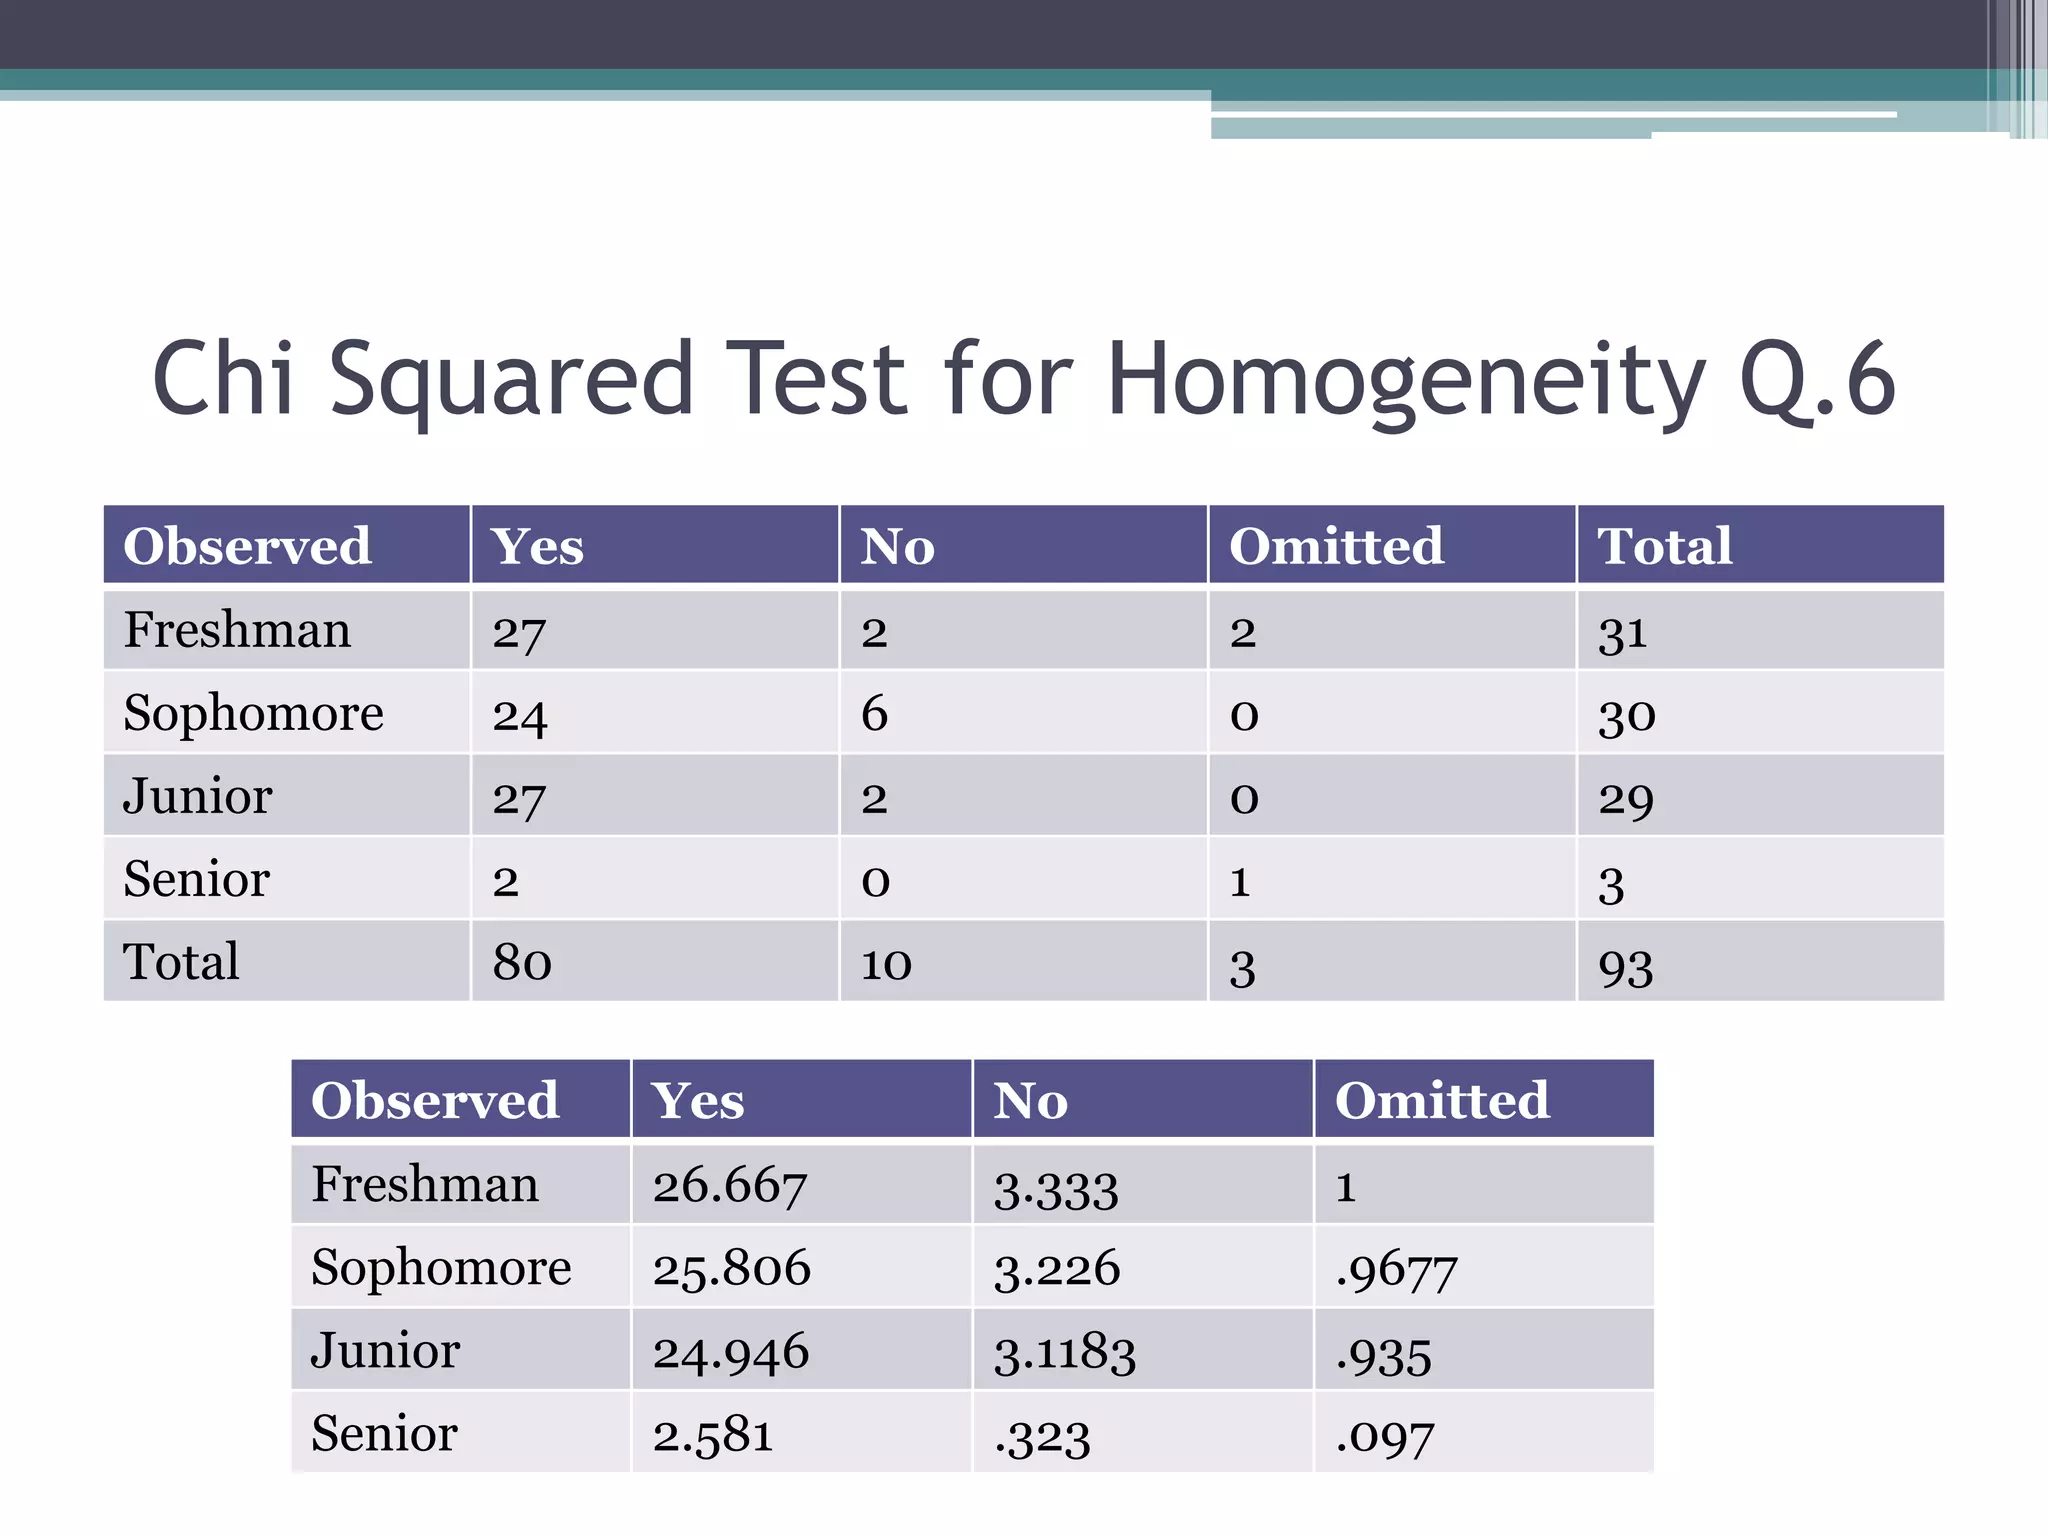
![Confidence Interval for Proportion Q.6Do you like you parents? p= .887, q= .123, z*= 1.96, n=89.887- 1.96*sqt[(.822)(.178)/89)] = .822.887+ 1.96*sqt[(.822)(.178)/89)] = .953Confidence Interval: (.822, .953)We are 95% confident that the true proportion of students who like their parents is between .822 and .953](https://image.slidesharecdn.com/statisticalsurveyproject-110604215906-phpapp02/75/Statistical-survey-project-12-2048.jpg)
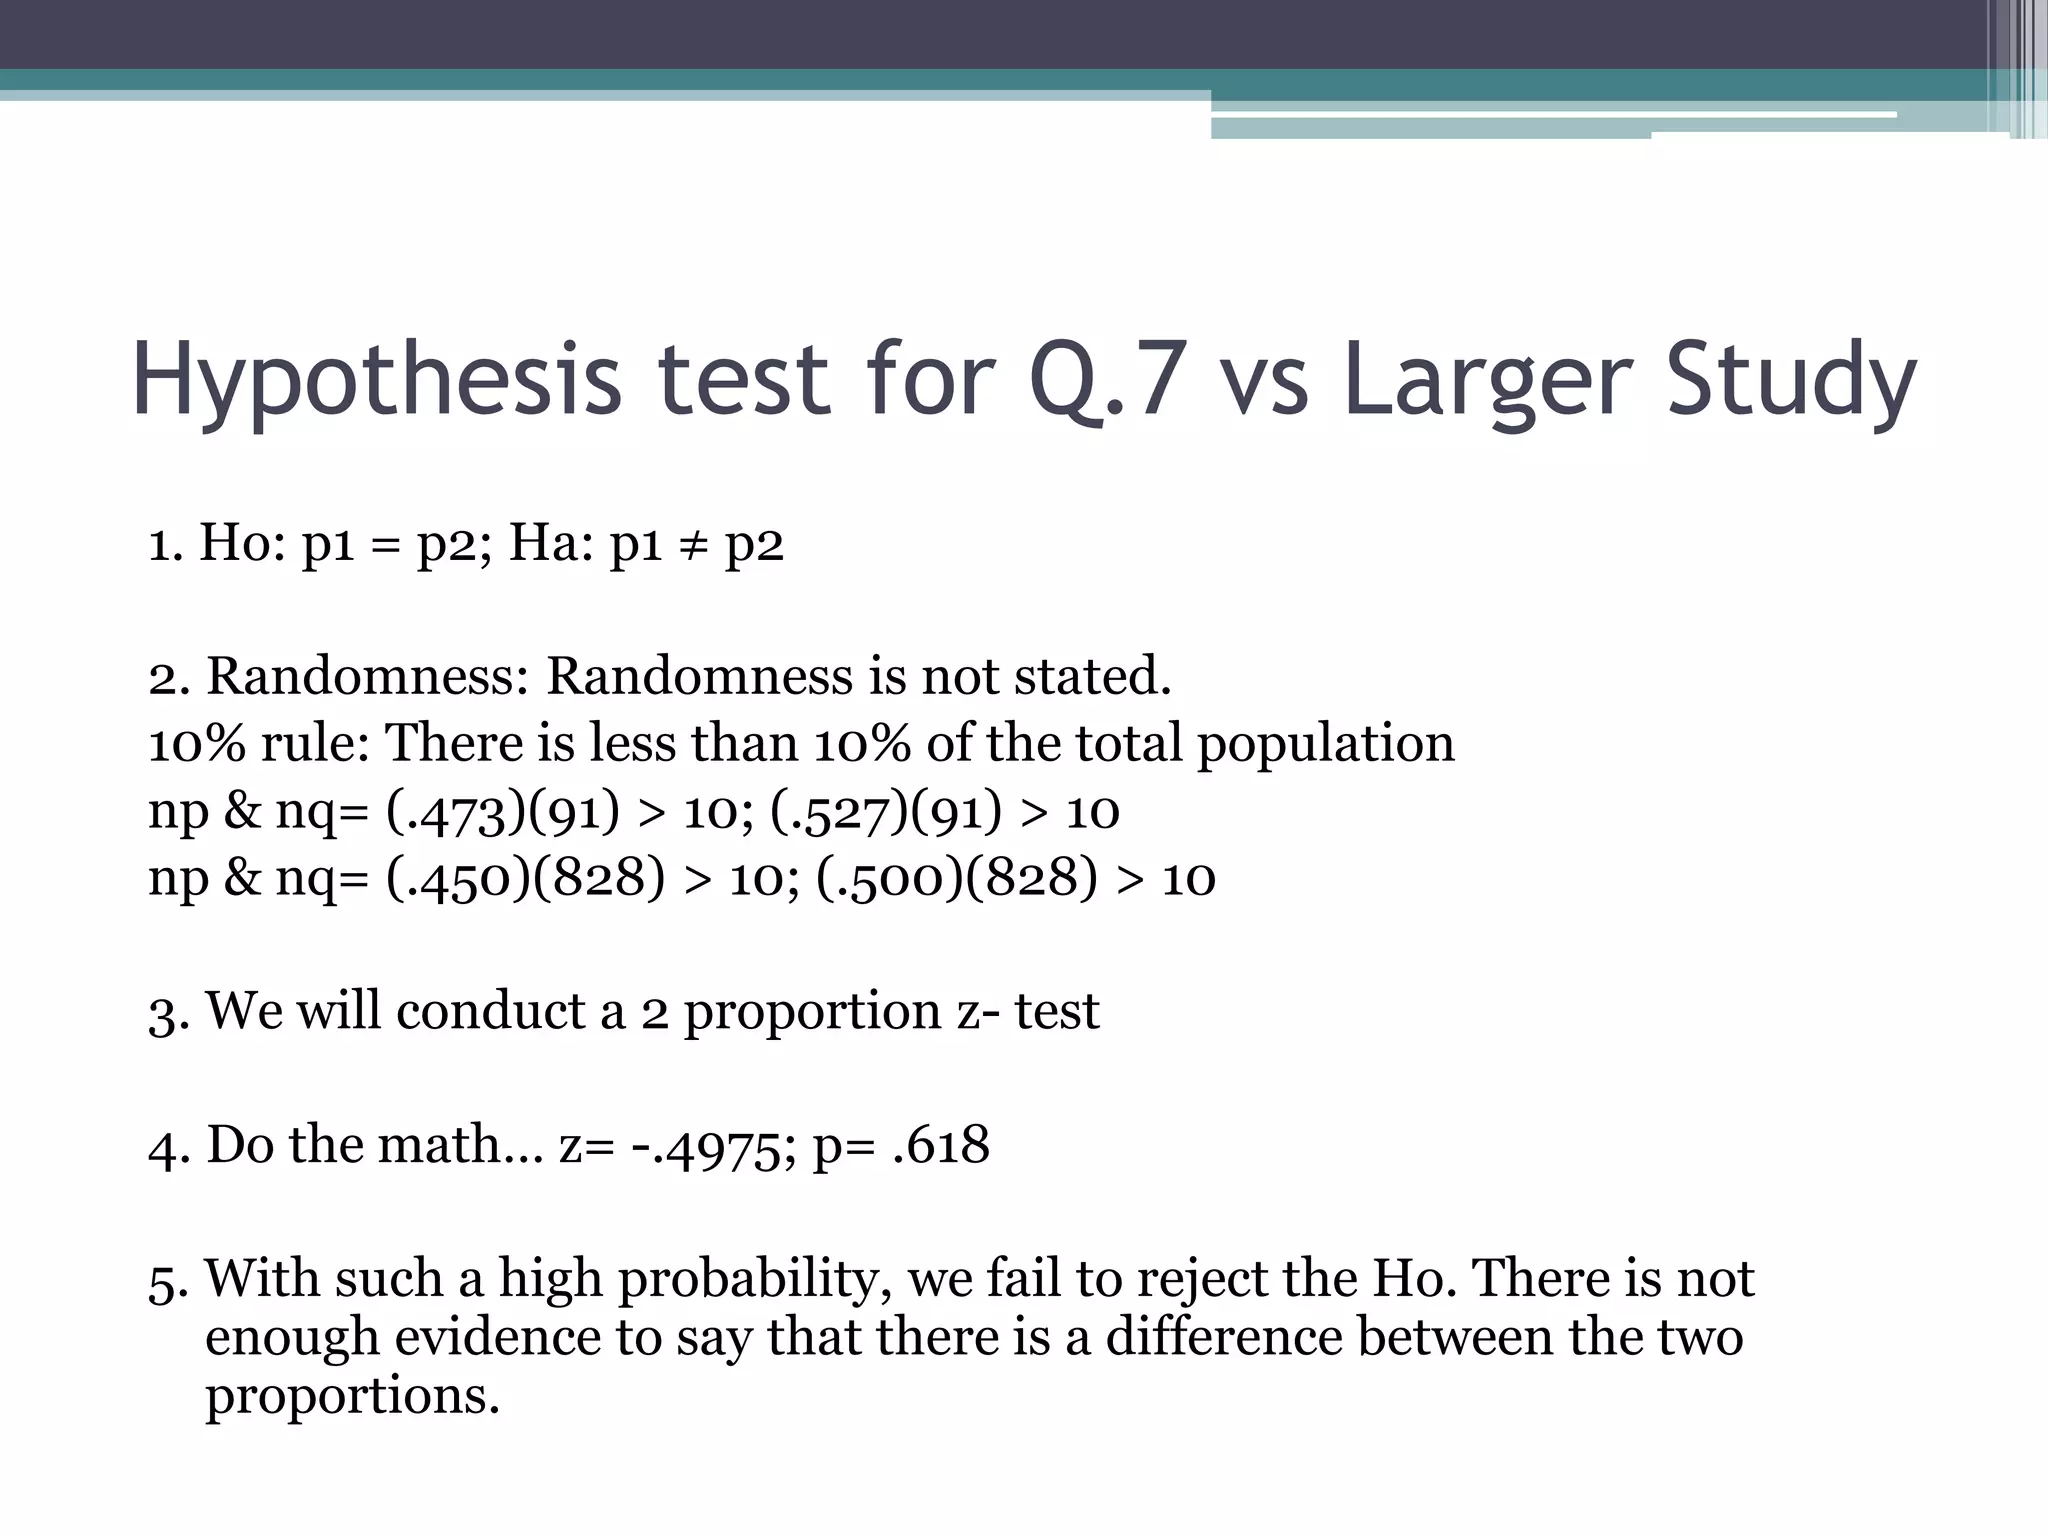
![Confidence Interval for Proportion Q.7Are you for or against marijuana? p= forp= .473, q= .527, z*= 1.96, n= 91.473- 1.96*sqt[(.473)(.527)/(89)]= .369.473+ 1.96*sqt[(.473)(.527)/(89)]= .575Confidence Interval: (.369, .575)We are 95% confident that the true proportion of students who are for marijuana are between .369 and .575](https://image.slidesharecdn.com/statisticalsurveyproject-110604215906-phpapp02/75/Statistical-survey-project-13-2048.jpg)
![Confidence Interval for Proportion Q.8Are you in a school sport?p= .696, q= .304, z*= 1.96, n= 92.696- 1.96*sqt[(.696)(.304)/92]= .376.696+ 1.96*sqt[(.696)(.304)/92]= .583Confidence Interval: (.376, .583)We are 95% confident that the true proportion of students who are in a school sport is between .376 and .583](https://image.slidesharecdn.com/statisticalsurveyproject-110604215906-phpapp02/75/Statistical-survey-project-14-2048.jpg)
![Confidence Interval from Proportion Q.10 Are there any video game consoles in your house?p= .867, q= .133, z*= 1.96, n= 90.867- 1.96* sqt[(.867)(.133)/90]= .063.867+ 1.96* sqt[(.867)(.133)/90]= .203Confidence Interval: (.063, .203)We are 95% confident that the true proportion of students who own have a video game console in their house is between .063 and .203](https://image.slidesharecdn.com/statisticalsurveyproject-110604215906-phpapp02/75/Statistical-survey-project-15-2048.jpg)