Downloaded 9,293 times


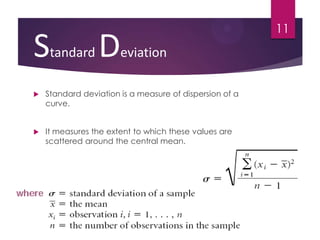
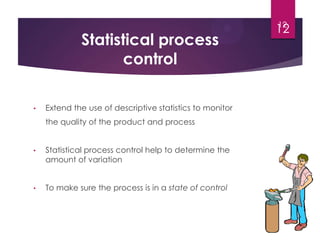


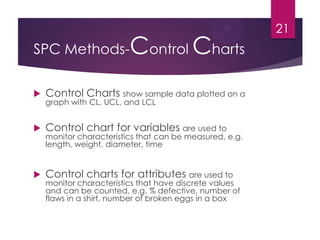
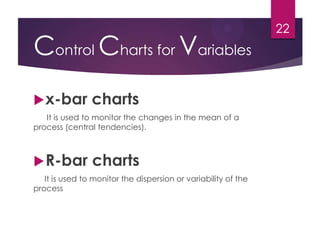


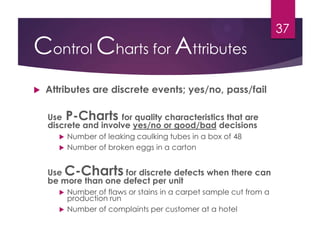


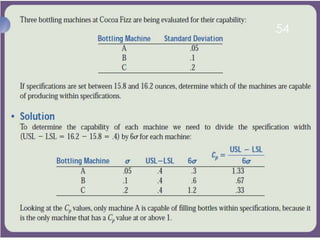
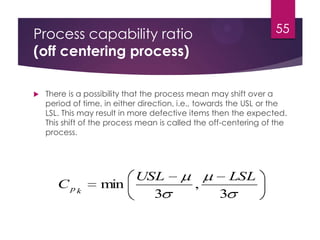

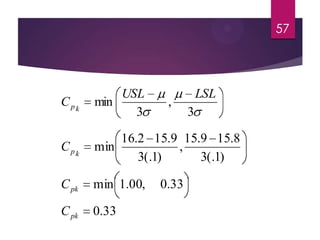


Statistical quality control (SQC) uses statistical tools to monitor and improve production processes. Walter Shewhart pioneered control charts in the 1920s to distinguish normal variation from problems. W. Edwards Deming helped spread SQC in the US and Japan. Descriptive statistics describe quality characteristics, while control charts monitor processes over time. Variables charts like X-bar and R charts monitor measurable attributes, while P and C charts monitor discrete attributes like defects. Process capability evaluates a process's ability to meet specifications by comparing variability to tolerance limits. Key metrics include Cp, Cpk, and process centering.


![Acceptance Sampling[1]](https://cdn.slidesharecdn.com/ss_thumbnails/acceptancesampling1-1226078569232381-9-thumbnail.jpg?width=640&height=640&fit=bounds)