SlideShare a Scribd company logo
1 of 13
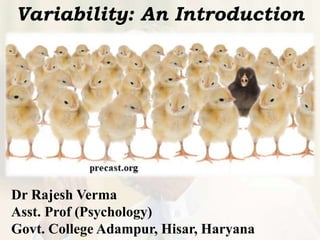
Variability: An Introduction
Dr Rajesh Verma
Asst. Prof (Psychology)
Govt. College Adampur, Hisar, Haryana
Case
Two psychology professors assesses students’
assignment with average 38 marks (out of 50). Does this
indicate that both teachers have same evaluation
temperament (assuming such may be disastrous!). Let us
consider
(i) teacher A awards within 34 to 40 marks,
(ii) while teacher B awards within 20 to 48 marks.
If you are a student and seeking
to get your assignment assessed which
teacher you will prefer??
If you are puzzled do not worry,
study of ‘variability’ will help you.
Meaning
Variability means the ability to vary. It has come
from word ‘variable’ which means
‘not staying the same’ or ‘often
changing’. A situation, quantity, or
number which is not constant or that
can vary.
For example, ‘memory’ and
‘intelligence’ are variables.
Definition
An index of scattering of scores around the mean
(center of distribution) is called variability. It is also
known as Spread, Dispersion or Width (Levin & Fox,
2006).
Variability measures how much the scores vary
from each other.
Introduction
Nature has complexity as well as simplicity in
its creations and follows a pattern. The complexity in
the nature inherently occurs due to inter and intra-
creations ‘variability’. For example; two rose flowers
grown on the same plant are similar yet different.
Two chapattis prepared by same cook under similar
conditions are similar yet different. Even different
coloured flowers grow
on same plant.
Understanding with Figures
Now it’s time for you to tell, out of
A & B which figure have higher
variability/
spread/
dispersion in
terms of size of
the circles.
Understanding with Graph
In this figure the data represented
by B has higher
dispersion than
data represented
by A. It shows
B has higher
variability in its
data set
than A.
Measures of Variability
1. Range,
2. Interquartile range,
3. Mean deviation,
4. Variance, and
5. Standard
deviation.
1. Range – The difference between
the highest and lowest score in a data
set.
For example – In the given data set
lowest score is 4 and highest score is
30 therefore, 30-4 = 26, So, range is
26. So simple isn’t it?
Data Set
4
21
14
8
25
30
11
20
19
26
10
2. Interquartile Range – Range of middle 50% values
of a data set. Or distance between the first and third
quartile i.e. IQR = Q3-Q1
3. Mean Deviation – Average of absolute differences
of raw score from there mean.
MD =
∑|𝒙− 𝒙|
𝑵
Where, ∑ = Summation
x = score
𝒙 = mean
N = no. of score
| = Absolute
4. Variance (s) – It is the average of the squared
differences of each raw score from the mean.
It is denoted by ‘s’. 𝒔 𝟐
=
∑(𝒙− 𝒙) 𝟐
𝑵
5. Standard Deviation (σ) – The square root of
variance. It represents the average variability in a data
set because it measures the average of deviations from
the mean. σ =
∑(𝒙− 𝒙) 𝟐
𝑵
Where, ∑ = Summation
x = score
𝒙 = mean
N = no. of score
s = variance
References:
1. Levin, J & Fox, J. A. (2006). Elementary statistics
in in social research. Delhi: Dorling Kindersley (India).
2. http://sphweb.bumc.bu.edu
/otlt/mph-modules/bs/bs704_
summarizingdata/bs704_
summarizingdata7.html.
vermasujit@yahoo.com
Next
Discussion
Quartile Deviation

More Related Content

What's hot

Measures of relationships
Measures of relationshipsMeasures of relationships
Measures of relationshipsyogesh ingle
 
Descriptive statistics
Descriptive statisticsDescriptive statistics
Descriptive statisticsHiba Armouche
 
Statistics-Measures of dispersions
Statistics-Measures of dispersionsStatistics-Measures of dispersions
Statistics-Measures of dispersionsCapricorn
 
Measures of variability
Measures of variabilityMeasures of variability
Measures of variabilitysyedaumme
 
Variables And Measurement Scales
Variables And Measurement ScalesVariables And Measurement Scales
Variables And Measurement Scalesguesta861fa
 
Measures of dispersion or variation
Measures of dispersion or variationMeasures of dispersion or variation
Measures of dispersion or variationRaj Teotia
 
Basics of Educational Statistics (Inferential statistics)
Basics of Educational Statistics (Inferential statistics)Basics of Educational Statistics (Inferential statistics)
Basics of Educational Statistics (Inferential statistics)HennaAnsari
 
Standard Scores
Standard ScoresStandard Scores
Standard Scoresshoffma5
 
Measure of Dispersion
Measure of DispersionMeasure of Dispersion
Measure of Dispersionsonia gupta
 
Anova, ancova, manova thiyagu
Anova, ancova, manova   thiyaguAnova, ancova, manova   thiyagu
Anova, ancova, manova thiyaguThiyagu K
 
Descriptive statistics
Descriptive statisticsDescriptive statistics
Descriptive statisticsSarfraz Ahmad
 
Hypothesis in educational research
Hypothesis in educational researchHypothesis in educational research
Hypothesis in educational researchSatishprakash Shukla
 
Introduction To Statistics
Introduction To StatisticsIntroduction To Statistics
Introduction To Statisticsalbertlaporte
 
Anova ancova manova_mancova
Anova  ancova manova_mancovaAnova  ancova manova_mancova
Anova ancova manova_mancovaCarlo Magno
 
Measures of central tendency
Measures of central tendencyMeasures of central tendency
Measures of central tendencykreshajay
 

What's hot (20)

Measures of relationships
Measures of relationshipsMeasures of relationships
Measures of relationships
 
Descriptive statistics
Descriptive statisticsDescriptive statistics
Descriptive statistics
 
Statistics-Measures of dispersions
Statistics-Measures of dispersionsStatistics-Measures of dispersions
Statistics-Measures of dispersions
 
Measures of variability
Measures of variabilityMeasures of variability
Measures of variability
 
Measures of variability
Measures of variabilityMeasures of variability
Measures of variability
 
Variables And Measurement Scales
Variables And Measurement ScalesVariables And Measurement Scales
Variables And Measurement Scales
 
Measures of dispersion or variation
Measures of dispersion or variationMeasures of dispersion or variation
Measures of dispersion or variation
 
Basics of Educational Statistics (Inferential statistics)
Basics of Educational Statistics (Inferential statistics)Basics of Educational Statistics (Inferential statistics)
Basics of Educational Statistics (Inferential statistics)
 
Standard Scores
Standard ScoresStandard Scores
Standard Scores
 
Variability
VariabilityVariability
Variability
 
Measure of Dispersion
Measure of DispersionMeasure of Dispersion
Measure of Dispersion
 
Anova, ancova, manova thiyagu
Anova, ancova, manova   thiyaguAnova, ancova, manova   thiyagu
Anova, ancova, manova thiyagu
 
Descriptive statistics
Descriptive statisticsDescriptive statistics
Descriptive statistics
 
Hypothesis
HypothesisHypothesis
Hypothesis
 
Hypothesis in educational research
Hypothesis in educational researchHypothesis in educational research
Hypothesis in educational research
 
Z test
Z testZ test
Z test
 
Degree of freedom
Degree of freedomDegree of freedom
Degree of freedom
 
Introduction To Statistics
Introduction To StatisticsIntroduction To Statistics
Introduction To Statistics
 
Anova ancova manova_mancova
Anova  ancova manova_mancovaAnova  ancova manova_mancova
Anova ancova manova_mancova
 
Measures of central tendency
Measures of central tendencyMeasures of central tendency
Measures of central tendency
 

Similar to variability (statistics) an introduction

Measures of central tendency and dispersion
Measures of central tendency and dispersionMeasures of central tendency and dispersion
Measures of central tendency and dispersionRajaKrishnan M
 
Statistics.pptx
Statistics.pptxStatistics.pptx
Statistics.pptxXadDax1
 
Medical Statistics Part-I:Descriptive statistics
Medical Statistics Part-I:Descriptive statisticsMedical Statistics Part-I:Descriptive statistics
Medical Statistics Part-I:Descriptive statisticsRamachandra Barik
 
3. measures of central tendency
3. measures of central tendency3. measures of central tendency
3. measures of central tendencyrenz50
 
Class1.ppt
Class1.pptClass1.ppt
Class1.pptGautam G
 
Introduction to Statistics - Basics of Data - Class 1
Introduction to Statistics - Basics of Data - Class 1Introduction to Statistics - Basics of Data - Class 1
Introduction to Statistics - Basics of Data - Class 1RajnishSingh367990
 
STATISTICS BASICS INCLUDING DESCRIPTIVE STATISTICS
STATISTICS BASICS INCLUDING DESCRIPTIVE STATISTICSSTATISTICS BASICS INCLUDING DESCRIPTIVE STATISTICS
STATISTICS BASICS INCLUDING DESCRIPTIVE STATISTICSnagamani651296
 
Measures of Dispersion explanation .pdf
Measures of Dispersion explanation  .pdfMeasures of Dispersion explanation  .pdf
Measures of Dispersion explanation .pdfUVAS
 
MEASURE-OF-VARIABILITY- for students. Ppt
MEASURE-OF-VARIABILITY- for students. PptMEASURE-OF-VARIABILITY- for students. Ppt
MEASURE-OF-VARIABILITY- for students. PptPrincessjaynoviaKali
 
Measure of dispersion and it’s need.pptx by waseem javid
Measure of dispersion and it’s need.pptx by waseem javidMeasure of dispersion and it’s need.pptx by waseem javid
Measure of dispersion and it’s need.pptx by waseem javidwaseemjavid2004
 
Kinds Of Variables Kato Begum
Kinds Of Variables Kato BegumKinds Of Variables Kato Begum
Kinds Of Variables Kato BegumDr. Cupid Lucid
 
Selection of appropriate statistics and tools
Selection of appropriate statistics and toolsSelection of appropriate statistics and tools
Selection of appropriate statistics and toolsSuresh Kumar Murugesan
 
3_Statistics-Refresher.pptx Pschological Assessment
3_Statistics-Refresher.pptx Pschological Assessment3_Statistics-Refresher.pptx Pschological Assessment
3_Statistics-Refresher.pptx Pschological Assessmentsaphiremirae
 

Similar to variability (statistics) an introduction (20)

DISPERSION
DISPERSION DISPERSION
DISPERSION
 
Measures of central tendency and dispersion
Measures of central tendency and dispersionMeasures of central tendency and dispersion
Measures of central tendency and dispersion
 
Statistics.pptx
Statistics.pptxStatistics.pptx
Statistics.pptx
 
Medical Statistics Part-I:Descriptive statistics
Medical Statistics Part-I:Descriptive statisticsMedical Statistics Part-I:Descriptive statistics
Medical Statistics Part-I:Descriptive statistics
 
Statistics(Basic)
Statistics(Basic)Statistics(Basic)
Statistics(Basic)
 
3. measures of central tendency
3. measures of central tendency3. measures of central tendency
3. measures of central tendency
 
Class1.ppt
Class1.pptClass1.ppt
Class1.ppt
 
Class1.ppt
Class1.pptClass1.ppt
Class1.ppt
 
Class1.ppt
Class1.pptClass1.ppt
Class1.ppt
 
Introduction to Statistics - Basics of Data - Class 1
Introduction to Statistics - Basics of Data - Class 1Introduction to Statistics - Basics of Data - Class 1
Introduction to Statistics - Basics of Data - Class 1
 
STATISTICS BASICS INCLUDING DESCRIPTIVE STATISTICS
STATISTICS BASICS INCLUDING DESCRIPTIVE STATISTICSSTATISTICS BASICS INCLUDING DESCRIPTIVE STATISTICS
STATISTICS BASICS INCLUDING DESCRIPTIVE STATISTICS
 
Class1.ppt
Class1.pptClass1.ppt
Class1.ppt
 
Measures of Dispersion explanation .pdf
Measures of Dispersion explanation  .pdfMeasures of Dispersion explanation  .pdf
Measures of Dispersion explanation .pdf
 
MEASURE-OF-VARIABILITY- for students. Ppt
MEASURE-OF-VARIABILITY- for students. PptMEASURE-OF-VARIABILITY- for students. Ppt
MEASURE-OF-VARIABILITY- for students. Ppt
 
Measure of dispersion and it’s need.pptx by waseem javid
Measure of dispersion and it’s need.pptx by waseem javidMeasure of dispersion and it’s need.pptx by waseem javid
Measure of dispersion and it’s need.pptx by waseem javid
 
Kinds Of Variables Kato Begum
Kinds Of Variables Kato BegumKinds Of Variables Kato Begum
Kinds Of Variables Kato Begum
 
Statistics
StatisticsStatistics
Statistics
 
Stat11t chapter3
Stat11t chapter3Stat11t chapter3
Stat11t chapter3
 
Selection of appropriate statistics and tools
Selection of appropriate statistics and toolsSelection of appropriate statistics and tools
Selection of appropriate statistics and tools
 
3_Statistics-Refresher.pptx Pschological Assessment
3_Statistics-Refresher.pptx Pschological Assessment3_Statistics-Refresher.pptx Pschological Assessment
3_Statistics-Refresher.pptx Pschological Assessment
 

More from Dr Rajesh Verma

1_Anxiety disorders.pptx
1_Anxiety disorders.pptx1_Anxiety disorders.pptx
1_Anxiety disorders.pptxDr Rajesh Verma
 
2_Substance related and addictive disorders.pptx
2_Substance related and addictive disorders.pptx2_Substance related and addictive disorders.pptx
2_Substance related and addictive disorders.pptxDr Rajesh Verma
 
व्यावहारिक मनोविज्ञान का अर्थ इतिहास (Meaning and History of Applied Pschology)
व्यावहारिक मनोविज्ञान का अर्थ इतिहास (Meaning and History of Applied Pschology)व्यावहारिक मनोविज्ञान का अर्थ इतिहास (Meaning and History of Applied Pschology)
व्यावहारिक मनोविज्ञान का अर्थ इतिहास (Meaning and History of Applied Pschology)Dr Rajesh Verma
 
National Education day 11 November 2020
National Education day 11 November 2020National Education day 11 November 2020
National Education day 11 November 2020Dr Rajesh Verma
 
concept of abnormality (Hindi & English)
concept of abnormality (Hindi & English)concept of abnormality (Hindi & English)
concept of abnormality (Hindi & English)Dr Rajesh Verma
 
सामान्यता की अवधारणा (concept of normality)
सामान्यता की अवधारणा  (concept of normality)सामान्यता की अवधारणा  (concept of normality)
सामान्यता की अवधारणा (concept of normality)Dr Rajesh Verma
 
concept of normality (English)
concept of normality (English)concept of normality (English)
concept of normality (English)Dr Rajesh Verma
 
Overview of Quantitative research by Prof Rajbir Singh.
Overview of Quantitative research by Prof Rajbir Singh.Overview of Quantitative research by Prof Rajbir Singh.
Overview of Quantitative research by Prof Rajbir Singh.Dr Rajesh Verma
 
मानक विचलन (standard deviation)
मानक  विचलन (standard deviation)मानक  विचलन (standard deviation)
मानक विचलन (standard deviation)Dr Rajesh Verma
 
standard deviation: an introduction
standard deviation: an introductionstandard deviation: an introduction
standard deviation: an introductionDr Rajesh Verma
 
चतुर्थक विचलन (quartile deviation)
चतुर्थक विचलन (quartile deviation)चतुर्थक विचलन (quartile deviation)
चतुर्थक विचलन (quartile deviation)Dr Rajesh Verma
 
quartile deviation: An introduction
quartile deviation: An introductionquartile deviation: An introduction
quartile deviation: An introductionDr Rajesh Verma
 
विचलनशीलता: एक परिचय
विचलनशीलता:  एक परिचय विचलनशीलता:  एक परिचय
विचलनशीलता: एक परिचय Dr Rajesh Verma
 
variability an introduction
variability an introductionvariability an introduction
variability an introductionDr Rajesh Verma
 
Importance of social science research 17.09.2020
Importance of social science research 17.09.2020Importance of social science research 17.09.2020
Importance of social science research 17.09.2020Dr Rajesh Verma
 
केंद्रीय प्रवृत्ति के माप
केंद्रीय प्रवृत्ति के मापकेंद्रीय प्रवृत्ति के माप
केंद्रीय प्रवृत्ति के मापDr Rajesh Verma
 
measures of central tendencies
measures of central tendenciesmeasures of central tendencies
measures of central tendenciesDr Rajesh Verma
 
Measures of central tendencies
Measures of central tendenciesMeasures of central tendencies
Measures of central tendenciesDr Rajesh Verma
 
Mirror drawing Apparatus
Mirror drawing ApparatusMirror drawing Apparatus
Mirror drawing ApparatusDr Rajesh Verma
 

More from Dr Rajesh Verma (20)

1_Anxiety disorders.pptx
1_Anxiety disorders.pptx1_Anxiety disorders.pptx
1_Anxiety disorders.pptx
 
2_Substance related and addictive disorders.pptx
2_Substance related and addictive disorders.pptx2_Substance related and addictive disorders.pptx
2_Substance related and addictive disorders.pptx
 
व्यावहारिक मनोविज्ञान का अर्थ इतिहास (Meaning and History of Applied Pschology)
व्यावहारिक मनोविज्ञान का अर्थ इतिहास (Meaning and History of Applied Pschology)व्यावहारिक मनोविज्ञान का अर्थ इतिहास (Meaning and History of Applied Pschology)
व्यावहारिक मनोविज्ञान का अर्थ इतिहास (Meaning and History of Applied Pschology)
 
National Education day 11 November 2020
National Education day 11 November 2020National Education day 11 November 2020
National Education day 11 November 2020
 
concept of abnormality (Hindi & English)
concept of abnormality (Hindi & English)concept of abnormality (Hindi & English)
concept of abnormality (Hindi & English)
 
सामान्यता की अवधारणा (concept of normality)
सामान्यता की अवधारणा  (concept of normality)सामान्यता की अवधारणा  (concept of normality)
सामान्यता की अवधारणा (concept of normality)
 
concept of normality (English)
concept of normality (English)concept of normality (English)
concept of normality (English)
 
Overview of Quantitative research by Prof Rajbir Singh.
Overview of Quantitative research by Prof Rajbir Singh.Overview of Quantitative research by Prof Rajbir Singh.
Overview of Quantitative research by Prof Rajbir Singh.
 
मानक विचलन (standard deviation)
मानक  विचलन (standard deviation)मानक  विचलन (standard deviation)
मानक विचलन (standard deviation)
 
standard deviation: an introduction
standard deviation: an introductionstandard deviation: an introduction
standard deviation: an introduction
 
चतुर्थक विचलन (quartile deviation)
चतुर्थक विचलन (quartile deviation)चतुर्थक विचलन (quartile deviation)
चतुर्थक विचलन (quartile deviation)
 
quartile deviation: An introduction
quartile deviation: An introductionquartile deviation: An introduction
quartile deviation: An introduction
 
विचलनशीलता: एक परिचय
विचलनशीलता:  एक परिचय विचलनशीलता:  एक परिचय
विचलनशीलता: एक परिचय
 
variability an introduction
variability an introductionvariability an introduction
variability an introduction
 
Importance of social science research 17.09.2020
Importance of social science research 17.09.2020Importance of social science research 17.09.2020
Importance of social science research 17.09.2020
 
केंद्रीय प्रवृत्ति के माप
केंद्रीय प्रवृत्ति के मापकेंद्रीय प्रवृत्ति के माप
केंद्रीय प्रवृत्ति के माप
 
measures of central tendencies
measures of central tendenciesmeasures of central tendencies
measures of central tendencies
 
Measures of central tendencies
Measures of central tendenciesMeasures of central tendencies
Measures of central tendencies
 
Maze learning Apparatus
Maze learning ApparatusMaze learning Apparatus
Maze learning Apparatus
 
Mirror drawing Apparatus
Mirror drawing ApparatusMirror drawing Apparatus
Mirror drawing Apparatus
 

Recently uploaded

Proudly South Africa powerpoint Thorisha.pptx
Proudly South Africa powerpoint Thorisha.pptxProudly South Africa powerpoint Thorisha.pptx
Proudly South Africa powerpoint Thorisha.pptxthorishapillay1
 
ECONOMIC CONTEXT - PAPER 1 Q3: NEWSPAPERS.pptx
ECONOMIC CONTEXT - PAPER 1 Q3: NEWSPAPERS.pptxECONOMIC CONTEXT - PAPER 1 Q3: NEWSPAPERS.pptx
ECONOMIC CONTEXT - PAPER 1 Q3: NEWSPAPERS.pptxiammrhaywood
 
Procuring digital preservation CAN be quick and painless with our new dynamic...
Procuring digital preservation CAN be quick and painless with our new dynamic...Procuring digital preservation CAN be quick and painless with our new dynamic...
Procuring digital preservation CAN be quick and painless with our new dynamic...Jisc
 
Field Attribute Index Feature in Odoo 17
Field Attribute Index Feature in Odoo 17Field Attribute Index Feature in Odoo 17
Field Attribute Index Feature in Odoo 17Celine George
 
INTRODUCTION TO CATHOLIC CHRISTOLOGY.pptx
INTRODUCTION TO CATHOLIC CHRISTOLOGY.pptxINTRODUCTION TO CATHOLIC CHRISTOLOGY.pptx
INTRODUCTION TO CATHOLIC CHRISTOLOGY.pptxHumphrey A Beña
 
Barangay Council for the Protection of Children (BCPC) Orientation.pptx
Barangay Council for the Protection of Children (BCPC) Orientation.pptxBarangay Council for the Protection of Children (BCPC) Orientation.pptx
Barangay Council for the Protection of Children (BCPC) Orientation.pptxCarlos105
 
Karra SKD Conference Presentation Revised.pptx
Karra SKD Conference Presentation Revised.pptxKarra SKD Conference Presentation Revised.pptx
Karra SKD Conference Presentation Revised.pptxAshokKarra1
 
How to do quick user assign in kanban in Odoo 17 ERP
How to do quick user assign in kanban in Odoo 17 ERPHow to do quick user assign in kanban in Odoo 17 ERP
How to do quick user assign in kanban in Odoo 17 ERPCeline George
 
What is Model Inheritance in Odoo 17 ERP
What is Model Inheritance in Odoo 17 ERPWhat is Model Inheritance in Odoo 17 ERP
What is Model Inheritance in Odoo 17 ERPCeline George
 
Q4 English4 Week3 PPT Melcnmg-based.pptx
Q4 English4 Week3 PPT Melcnmg-based.pptxQ4 English4 Week3 PPT Melcnmg-based.pptx
Q4 English4 Week3 PPT Melcnmg-based.pptxnelietumpap1
 
AMERICAN LANGUAGE HUB_Level2_Student'sBook_Answerkey.pdf
AMERICAN LANGUAGE HUB_Level2_Student'sBook_Answerkey.pdfAMERICAN LANGUAGE HUB_Level2_Student'sBook_Answerkey.pdf
AMERICAN LANGUAGE HUB_Level2_Student'sBook_Answerkey.pdfphamnguyenenglishnb
 
Like-prefer-love -hate+verb+ing & silent letters & citizenship text.pdf
Like-prefer-love -hate+verb+ing & silent letters & citizenship text.pdfLike-prefer-love -hate+verb+ing & silent letters & citizenship text.pdf
Like-prefer-love -hate+verb+ing & silent letters & citizenship text.pdfMr Bounab Samir
 
ENGLISH 7_Q4_LESSON 2_ Employing a Variety of Strategies for Effective Interp...
ENGLISH 7_Q4_LESSON 2_ Employing a Variety of Strategies for Effective Interp...ENGLISH 7_Q4_LESSON 2_ Employing a Variety of Strategies for Effective Interp...
ENGLISH 7_Q4_LESSON 2_ Employing a Variety of Strategies for Effective Interp...JhezDiaz1
 
Grade 9 Q4-MELC1-Active and Passive Voice.pptx
Grade 9 Q4-MELC1-Active and Passive Voice.pptxGrade 9 Q4-MELC1-Active and Passive Voice.pptx
Grade 9 Q4-MELC1-Active and Passive Voice.pptxChelloAnnAsuncion2
 
Influencing policy (training slides from Fast Track Impact)
Influencing policy (training slides from Fast Track Impact)Influencing policy (training slides from Fast Track Impact)
Influencing policy (training slides from Fast Track Impact)Mark Reed
 

Recently uploaded (20)

Proudly South Africa powerpoint Thorisha.pptx
Proudly South Africa powerpoint Thorisha.pptxProudly South Africa powerpoint Thorisha.pptx
Proudly South Africa powerpoint Thorisha.pptx
 
Raw materials used in Herbal Cosmetics.pptx
Raw materials used in Herbal Cosmetics.pptxRaw materials used in Herbal Cosmetics.pptx
Raw materials used in Herbal Cosmetics.pptx
 
TataKelola dan KamSiber Kecerdasan Buatan v022.pdf
TataKelola dan KamSiber Kecerdasan Buatan v022.pdfTataKelola dan KamSiber Kecerdasan Buatan v022.pdf
TataKelola dan KamSiber Kecerdasan Buatan v022.pdf
 
ECONOMIC CONTEXT - PAPER 1 Q3: NEWSPAPERS.pptx
ECONOMIC CONTEXT - PAPER 1 Q3: NEWSPAPERS.pptxECONOMIC CONTEXT - PAPER 1 Q3: NEWSPAPERS.pptx
ECONOMIC CONTEXT - PAPER 1 Q3: NEWSPAPERS.pptx
 
YOUVE_GOT_EMAIL_PRELIMS_EL_DORADO_2024.pptx
YOUVE_GOT_EMAIL_PRELIMS_EL_DORADO_2024.pptxYOUVE_GOT_EMAIL_PRELIMS_EL_DORADO_2024.pptx
YOUVE_GOT_EMAIL_PRELIMS_EL_DORADO_2024.pptx
 
Procuring digital preservation CAN be quick and painless with our new dynamic...
Procuring digital preservation CAN be quick and painless with our new dynamic...Procuring digital preservation CAN be quick and painless with our new dynamic...
Procuring digital preservation CAN be quick and painless with our new dynamic...
 
Field Attribute Index Feature in Odoo 17
Field Attribute Index Feature in Odoo 17Field Attribute Index Feature in Odoo 17
Field Attribute Index Feature in Odoo 17
 
INTRODUCTION TO CATHOLIC CHRISTOLOGY.pptx
INTRODUCTION TO CATHOLIC CHRISTOLOGY.pptxINTRODUCTION TO CATHOLIC CHRISTOLOGY.pptx
INTRODUCTION TO CATHOLIC CHRISTOLOGY.pptx
 
Barangay Council for the Protection of Children (BCPC) Orientation.pptx
Barangay Council for the Protection of Children (BCPC) Orientation.pptxBarangay Council for the Protection of Children (BCPC) Orientation.pptx
Barangay Council for the Protection of Children (BCPC) Orientation.pptx
 
Karra SKD Conference Presentation Revised.pptx
Karra SKD Conference Presentation Revised.pptxKarra SKD Conference Presentation Revised.pptx
Karra SKD Conference Presentation Revised.pptx
 
LEFT_ON_C'N_ PRELIMS_EL_DORADO_2024.pptx
LEFT_ON_C'N_ PRELIMS_EL_DORADO_2024.pptxLEFT_ON_C'N_ PRELIMS_EL_DORADO_2024.pptx
LEFT_ON_C'N_ PRELIMS_EL_DORADO_2024.pptx
 
How to do quick user assign in kanban in Odoo 17 ERP
How to do quick user assign in kanban in Odoo 17 ERPHow to do quick user assign in kanban in Odoo 17 ERP
How to do quick user assign in kanban in Odoo 17 ERP
 
OS-operating systems- ch04 (Threads) ...
OS-operating systems- ch04 (Threads) ...OS-operating systems- ch04 (Threads) ...
OS-operating systems- ch04 (Threads) ...
 
What is Model Inheritance in Odoo 17 ERP
What is Model Inheritance in Odoo 17 ERPWhat is Model Inheritance in Odoo 17 ERP
What is Model Inheritance in Odoo 17 ERP
 
Q4 English4 Week3 PPT Melcnmg-based.pptx
Q4 English4 Week3 PPT Melcnmg-based.pptxQ4 English4 Week3 PPT Melcnmg-based.pptx
Q4 English4 Week3 PPT Melcnmg-based.pptx
 
AMERICAN LANGUAGE HUB_Level2_Student'sBook_Answerkey.pdf
AMERICAN LANGUAGE HUB_Level2_Student'sBook_Answerkey.pdfAMERICAN LANGUAGE HUB_Level2_Student'sBook_Answerkey.pdf
AMERICAN LANGUAGE HUB_Level2_Student'sBook_Answerkey.pdf
 
Like-prefer-love -hate+verb+ing & silent letters & citizenship text.pdf
Like-prefer-love -hate+verb+ing & silent letters & citizenship text.pdfLike-prefer-love -hate+verb+ing & silent letters & citizenship text.pdf
Like-prefer-love -hate+verb+ing & silent letters & citizenship text.pdf
 
ENGLISH 7_Q4_LESSON 2_ Employing a Variety of Strategies for Effective Interp...
ENGLISH 7_Q4_LESSON 2_ Employing a Variety of Strategies for Effective Interp...ENGLISH 7_Q4_LESSON 2_ Employing a Variety of Strategies for Effective Interp...
ENGLISH 7_Q4_LESSON 2_ Employing a Variety of Strategies for Effective Interp...
 
Grade 9 Q4-MELC1-Active and Passive Voice.pptx
Grade 9 Q4-MELC1-Active and Passive Voice.pptxGrade 9 Q4-MELC1-Active and Passive Voice.pptx
Grade 9 Q4-MELC1-Active and Passive Voice.pptx
 
Influencing policy (training slides from Fast Track Impact)
Influencing policy (training slides from Fast Track Impact)Influencing policy (training slides from Fast Track Impact)
Influencing policy (training slides from Fast Track Impact)
 

variability (statistics) an introduction

  • 1. Variability: An Introduction Dr Rajesh Verma Asst. Prof (Psychology) Govt. College Adampur, Hisar, Haryana
  • 2. Case Two psychology professors assesses students’ assignment with average 38 marks (out of 50). Does this indicate that both teachers have same evaluation temperament (assuming such may be disastrous!). Let us consider (i) teacher A awards within 34 to 40 marks, (ii) while teacher B awards within 20 to 48 marks. If you are a student and seeking to get your assignment assessed which teacher you will prefer?? If you are puzzled do not worry, study of ‘variability’ will help you.
  • 3. Meaning Variability means the ability to vary. It has come from word ‘variable’ which means ‘not staying the same’ or ‘often changing’. A situation, quantity, or number which is not constant or that can vary. For example, ‘memory’ and ‘intelligence’ are variables.
  • 4. Definition An index of scattering of scores around the mean (center of distribution) is called variability. It is also known as Spread, Dispersion or Width (Levin & Fox, 2006). Variability measures how much the scores vary from each other.
  • 5. Introduction Nature has complexity as well as simplicity in its creations and follows a pattern. The complexity in the nature inherently occurs due to inter and intra- creations ‘variability’. For example; two rose flowers grown on the same plant are similar yet different. Two chapattis prepared by same cook under similar conditions are similar yet different. Even different coloured flowers grow on same plant.
  • 6. Understanding with Figures Now it’s time for you to tell, out of A & B which figure have higher variability/ spread/ dispersion in terms of size of the circles.
  • 7. Understanding with Graph In this figure the data represented by B has higher dispersion than data represented by A. It shows B has higher variability in its data set than A.
  • 8. Measures of Variability 1. Range, 2. Interquartile range, 3. Mean deviation, 4. Variance, and 5. Standard deviation.
  • 9. 1. Range – The difference between the highest and lowest score in a data set. For example – In the given data set lowest score is 4 and highest score is 30 therefore, 30-4 = 26, So, range is 26. So simple isn’t it? Data Set 4 21 14 8 25 30 11 20 19 26 10
  • 10. 2. Interquartile Range – Range of middle 50% values of a data set. Or distance between the first and third quartile i.e. IQR = Q3-Q1 3. Mean Deviation – Average of absolute differences of raw score from there mean. MD = ∑|𝒙− 𝒙| 𝑵 Where, ∑ = Summation x = score 𝒙 = mean N = no. of score | = Absolute
  • 11. 4. Variance (s) – It is the average of the squared differences of each raw score from the mean. It is denoted by ‘s’. 𝒔 𝟐 = ∑(𝒙− 𝒙) 𝟐 𝑵 5. Standard Deviation (σ) – The square root of variance. It represents the average variability in a data set because it measures the average of deviations from the mean. σ = ∑(𝒙− 𝒙) 𝟐 𝑵 Where, ∑ = Summation x = score 𝒙 = mean N = no. of score s = variance
  • 12. References: 1. Levin, J & Fox, J. A. (2006). Elementary statistics in in social research. Delhi: Dorling Kindersley (India). 2. http://sphweb.bumc.bu.edu /otlt/mph-modules/bs/bs704_ summarizingdata/bs704_ summarizingdata7.html.