SlideShare a Scribd company logo
1 of 13
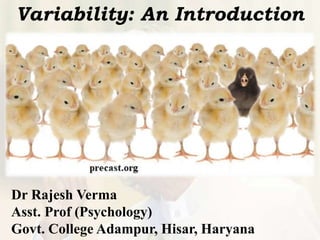
Variability: An Introduction
Dr Rajesh Verma
Asst. Prof (Psychology)
Govt. College Adampur, Hisar, Haryana
Case
Two psychology professors assesses students’
assignment with average 38 marks (out of 50). Does this
indicate that both teachers have same evaluation
temperament (assuming such may be disastrous!). Let us
consider
(i) teacher A awards within 34 to 40 marks,
(ii) while teacher B awards within 20 to 48 marks.
If you are a student and seeking
to get your assignment assessed which
teacher you will prefer??
If you are puzzled do not worry,
study of ‘variability’ will help you.
Meaning
Variability means the ability to vary. It has come
from word ‘variable’ which means
‘not staying the same’ or ‘often
changing’. A situation, quantity, or
number which is not constant or that
can vary.
For example, ‘memory’ and
‘intelligence’ are variables.
Definition
An index of scattering of scores around the mean
(center of distribution) is called variability. It is also
known as Spread, Dispersion or Width (Levin & Fox,
2006).
Variability measures how much the scores vary
from each other.
Introduction
Nature has complexity as well as simplicity in
its creations and follows a pattern. The complexity in
the nature inherently occurs due to inter and intra-
creations ‘variability’. For example; two rose flowers
grown on the same plant are similar yet different.
Two chapattis prepared by same cook under similar
conditions are similar yet different. Even different
coloured flowers grow
on same plant.
Understanding with Figures
Now it’s time for you to tell, out of
A & B which figure have higher
variability/
spread/
dispersion in
terms of size of
the circles.
Understanding with Graph
In this figure the data represented
by B has higher
dispersion than
data represented
by A. It shows
B has higher
variability in its
data set
than A.
Measures of Variability
1. Range,
2. Interquartile range,
3. Mean deviation,
4. Variance, and
5. Standard
deviation.
1. Range – The difference between
the highest and lowest score in a data
set.
For example – In the given data set
lowest score is 4 and highest score is
30 therefore, 30-4 = 26, So, range is
26. So simple isn’t it?
Data Set
4
21
14
8
25
30
11
20
19
26
10
2. Interquartile Range – Range of middle 50% values
of a data set. Or distance between the first and third
quartile i.e. IQR = Q3-Q1
3. Mean Deviation – Average of absolute differences
of raw score from there mean.
MD =
∑|𝒙− 𝒙|
𝑵
Where, ∑ = Summation
x = score
𝒙 = mean
N = no. of score
| = Absolute
4. Variance (s) – It is the average of the squared
differences of each raw score from the mean.
It is denoted by ‘s’. 𝒔 𝟐
=
∑(𝒙− 𝒙) 𝟐
𝑵
5. Standard Deviation (σ) – The square root of
variance. It represents the average variability in a data
set because it measures the average of deviations from
the mean. σ =
∑(𝒙− 𝒙) 𝟐
𝑵
Where, ∑ = Summation
x = score
𝒙 = mean
N = no. of score
s = variance
References:
1. Levin, J & Fox, J. A. (2006). Elementary statistics
in in social research. Delhi: Dorling Kindersley (India).
2. http://sphweb.bumc.bu.edu
/otlt/mph-modules/bs/bs704_
summarizingdata/bs704_
summarizingdata7.html.
vermasujit@yahoo.com
Next
Discussion
Quartile Deviation

More Related Content

What's hot

Measures of Central Tendency, Variability and Shapes
Measures of Central Tendency, Variability and ShapesMeasures of Central Tendency, Variability and Shapes
Measures of Central Tendency, Variability and ShapesScholarsPoint1
 
Collection and Classification of Data
Collection and Classification  of DataCollection and Classification  of Data
Collection and Classification of DataSuresh Babu
 
Types of scales
Types of scalesTypes of scales
Types of scalesnikki135
 
Statistics in Physical Education
Statistics in Physical EducationStatistics in Physical Education
Statistics in Physical Educationdryadav1300
 
Descriptions of data statistics for research
Descriptions of data   statistics for researchDescriptions of data   statistics for research
Descriptions of data statistics for researchHarve Abella
 
Descriptive statistics
Descriptive statisticsDescriptive statistics
Descriptive statisticsBurak Mızrak
 
Measures of central tendency
Measures of central tendencyMeasures of central tendency
Measures of central tendencyJincy Raj
 
Kwoledge of calculation of mean,median and mode
Kwoledge of calculation of mean,median and modeKwoledge of calculation of mean,median and mode
Kwoledge of calculation of mean,median and modeAarti Vijaykumar
 
Scales of Measurement - Thiyagu
Scales of Measurement - ThiyaguScales of Measurement - Thiyagu
Scales of Measurement - ThiyaguThiyagu K
 
Descriptive statistics
Descriptive statisticsDescriptive statistics
Descriptive statisticsmercy rani
 
Measures of Central Tendency - Biostatstics
Measures of Central Tendency - BiostatsticsMeasures of Central Tendency - Biostatstics
Measures of Central Tendency - BiostatsticsHarshit Jadav
 
Formulas to measure_central_tendency_(mean,_median,_mode)
Formulas to measure_central_tendency_(mean,_median,_mode)Formulas to measure_central_tendency_(mean,_median,_mode)
Formulas to measure_central_tendency_(mean,_median,_mode)RajThakuri
 
Measures of central tendency
Measures of central tendencyMeasures of central tendency
Measures of central tendencyyogesh ingle
 
3 descritive statistics measure of central tendency variatio
3 descritive statistics measure of   central   tendency variatio3 descritive statistics measure of   central   tendency variatio
3 descritive statistics measure of central tendency variatioLama K Banna
 

What's hot (17)

Scales of measurement
Scales of measurementScales of measurement
Scales of measurement
 
Measures of Central Tendency, Variability and Shapes
Measures of Central Tendency, Variability and ShapesMeasures of Central Tendency, Variability and Shapes
Measures of Central Tendency, Variability and Shapes
 
Collection and Classification of Data
Collection and Classification  of DataCollection and Classification  of Data
Collection and Classification of Data
 
Types of scales
Types of scalesTypes of scales
Types of scales
 
Statistics in Physical Education
Statistics in Physical EducationStatistics in Physical Education
Statistics in Physical Education
 
Descriptions of data statistics for research
Descriptions of data   statistics for researchDescriptions of data   statistics for research
Descriptions of data statistics for research
 
Descriptive statistics
Descriptive statisticsDescriptive statistics
Descriptive statistics
 
Measures of central tendency
Measures of central tendencyMeasures of central tendency
Measures of central tendency
 
Measures of Variability
Measures of VariabilityMeasures of Variability
Measures of Variability
 
Kwoledge of calculation of mean,median and mode
Kwoledge of calculation of mean,median and modeKwoledge of calculation of mean,median and mode
Kwoledge of calculation of mean,median and mode
 
Scales of Measurement - Thiyagu
Scales of Measurement - ThiyaguScales of Measurement - Thiyagu
Scales of Measurement - Thiyagu
 
Descriptive statistics
Descriptive statisticsDescriptive statistics
Descriptive statistics
 
Measures of Central Tendency - Biostatstics
Measures of Central Tendency - BiostatsticsMeasures of Central Tendency - Biostatstics
Measures of Central Tendency - Biostatstics
 
Formulas to measure_central_tendency_(mean,_median,_mode)
Formulas to measure_central_tendency_(mean,_median,_mode)Formulas to measure_central_tendency_(mean,_median,_mode)
Formulas to measure_central_tendency_(mean,_median,_mode)
 
Measures of central tendency
Measures of central tendencyMeasures of central tendency
Measures of central tendency
 
data
datadata
data
 
3 descritive statistics measure of central tendency variatio
3 descritive statistics measure of   central   tendency variatio3 descritive statistics measure of   central   tendency variatio
3 descritive statistics measure of central tendency variatio
 

Similar to variability an introduction

Measures of central tendency and dispersion
Measures of central tendency and dispersionMeasures of central tendency and dispersion
Measures of central tendency and dispersionRajaKrishnan M
 
Statistics.pptx
Statistics.pptxStatistics.pptx
Statistics.pptxXadDax1
 
Medical Statistics Part-I:Descriptive statistics
Medical Statistics Part-I:Descriptive statisticsMedical Statistics Part-I:Descriptive statistics
Medical Statistics Part-I:Descriptive statisticsRamachandra Barik
 
3. measures of central tendency
3. measures of central tendency3. measures of central tendency
3. measures of central tendencyrenz50
 
Class1.ppt
Class1.pptClass1.ppt
Class1.pptGautam G
 
Introduction to Statistics - Basics of Data - Class 1
Introduction to Statistics - Basics of Data - Class 1Introduction to Statistics - Basics of Data - Class 1
Introduction to Statistics - Basics of Data - Class 1RajnishSingh367990
 
STATISTICS BASICS INCLUDING DESCRIPTIVE STATISTICS
STATISTICS BASICS INCLUDING DESCRIPTIVE STATISTICSSTATISTICS BASICS INCLUDING DESCRIPTIVE STATISTICS
STATISTICS BASICS INCLUDING DESCRIPTIVE STATISTICSnagamani651296
 
Measures of Dispersion explanation .pdf
Measures of Dispersion explanation  .pdfMeasures of Dispersion explanation  .pdf
Measures of Dispersion explanation .pdfUVAS
 
MEASURE-OF-VARIABILITY- for students. Ppt
MEASURE-OF-VARIABILITY- for students. PptMEASURE-OF-VARIABILITY- for students. Ppt
MEASURE-OF-VARIABILITY- for students. PptPrincessjaynoviaKali
 
Measure of dispersion and it’s need.pptx by waseem javid
Measure of dispersion and it’s need.pptx by waseem javidMeasure of dispersion and it’s need.pptx by waseem javid
Measure of dispersion and it’s need.pptx by waseem javidwaseemjavid2004
 
Kinds Of Variables Kato Begum
Kinds Of Variables Kato BegumKinds Of Variables Kato Begum
Kinds Of Variables Kato BegumDr. Cupid Lucid
 
Selection of appropriate statistics and tools
Selection of appropriate statistics and toolsSelection of appropriate statistics and tools
Selection of appropriate statistics and toolsSuresh Kumar Murugesan
 
3_Statistics-Refresher.pptx Pschological Assessment
3_Statistics-Refresher.pptx Pschological Assessment3_Statistics-Refresher.pptx Pschological Assessment
3_Statistics-Refresher.pptx Pschological Assessmentsaphiremirae
 

Similar to variability an introduction (20)

Measures of central tendency and dispersion
Measures of central tendency and dispersionMeasures of central tendency and dispersion
Measures of central tendency and dispersion
 
Statistics.pptx
Statistics.pptxStatistics.pptx
Statistics.pptx
 
Medical Statistics Part-I:Descriptive statistics
Medical Statistics Part-I:Descriptive statisticsMedical Statistics Part-I:Descriptive statistics
Medical Statistics Part-I:Descriptive statistics
 
Statistics(Basic)
Statistics(Basic)Statistics(Basic)
Statistics(Basic)
 
3. measures of central tendency
3. measures of central tendency3. measures of central tendency
3. measures of central tendency
 
Class1.ppt
Class1.pptClass1.ppt
Class1.ppt
 
Class1.ppt
Class1.pptClass1.ppt
Class1.ppt
 
Class1.ppt
Class1.pptClass1.ppt
Class1.ppt
 
Introduction to Statistics - Basics of Data - Class 1
Introduction to Statistics - Basics of Data - Class 1Introduction to Statistics - Basics of Data - Class 1
Introduction to Statistics - Basics of Data - Class 1
 
STATISTICS BASICS INCLUDING DESCRIPTIVE STATISTICS
STATISTICS BASICS INCLUDING DESCRIPTIVE STATISTICSSTATISTICS BASICS INCLUDING DESCRIPTIVE STATISTICS
STATISTICS BASICS INCLUDING DESCRIPTIVE STATISTICS
 
Class1.ppt
Class1.pptClass1.ppt
Class1.ppt
 
Measures of Dispersion explanation .pdf
Measures of Dispersion explanation  .pdfMeasures of Dispersion explanation  .pdf
Measures of Dispersion explanation .pdf
 
MEASURE-OF-VARIABILITY- for students. Ppt
MEASURE-OF-VARIABILITY- for students. PptMEASURE-OF-VARIABILITY- for students. Ppt
MEASURE-OF-VARIABILITY- for students. Ppt
 
Measure of dispersion and it’s need.pptx by waseem javid
Measure of dispersion and it’s need.pptx by waseem javidMeasure of dispersion and it’s need.pptx by waseem javid
Measure of dispersion and it’s need.pptx by waseem javid
 
Kinds Of Variables Kato Begum
Kinds Of Variables Kato BegumKinds Of Variables Kato Begum
Kinds Of Variables Kato Begum
 
Statistics
StatisticsStatistics
Statistics
 
Stat11t chapter3
Stat11t chapter3Stat11t chapter3
Stat11t chapter3
 
Selection of appropriate statistics and tools
Selection of appropriate statistics and toolsSelection of appropriate statistics and tools
Selection of appropriate statistics and tools
 
3_Statistics-Refresher.pptx Pschological Assessment
3_Statistics-Refresher.pptx Pschological Assessment3_Statistics-Refresher.pptx Pschological Assessment
3_Statistics-Refresher.pptx Pschological Assessment
 
Data analysis
Data analysisData analysis
Data analysis
 

More from Dr Rajesh Verma

1_Anxiety disorders.pptx
1_Anxiety disorders.pptx1_Anxiety disorders.pptx
1_Anxiety disorders.pptxDr Rajesh Verma
 
2_Substance related and addictive disorders.pptx
2_Substance related and addictive disorders.pptx2_Substance related and addictive disorders.pptx
2_Substance related and addictive disorders.pptxDr Rajesh Verma
 
व्यावहारिक मनोविज्ञान का अर्थ इतिहास (Meaning and History of Applied Pschology)
व्यावहारिक मनोविज्ञान का अर्थ इतिहास (Meaning and History of Applied Pschology)व्यावहारिक मनोविज्ञान का अर्थ इतिहास (Meaning and History of Applied Pschology)
व्यावहारिक मनोविज्ञान का अर्थ इतिहास (Meaning and History of Applied Pschology)Dr Rajesh Verma
 
National Education day 11 November 2020
National Education day 11 November 2020National Education day 11 November 2020
National Education day 11 November 2020Dr Rajesh Verma
 
concept of abnormality (Hindi & English)
concept of abnormality (Hindi & English)concept of abnormality (Hindi & English)
concept of abnormality (Hindi & English)Dr Rajesh Verma
 
सामान्यता की अवधारणा (concept of normality)
सामान्यता की अवधारणा  (concept of normality)सामान्यता की अवधारणा  (concept of normality)
सामान्यता की अवधारणा (concept of normality)Dr Rajesh Verma
 
concept of normality (English)
concept of normality (English)concept of normality (English)
concept of normality (English)Dr Rajesh Verma
 
Overview of Quantitative research by Prof Rajbir Singh.
Overview of Quantitative research by Prof Rajbir Singh.Overview of Quantitative research by Prof Rajbir Singh.
Overview of Quantitative research by Prof Rajbir Singh.Dr Rajesh Verma
 
मानक विचलन (standard deviation)
मानक  विचलन (standard deviation)मानक  विचलन (standard deviation)
मानक विचलन (standard deviation)Dr Rajesh Verma
 
standard deviation: an introduction
standard deviation: an introductionstandard deviation: an introduction
standard deviation: an introductionDr Rajesh Verma
 
चतुर्थक विचलन (quartile deviation)
चतुर्थक विचलन (quartile deviation)चतुर्थक विचलन (quartile deviation)
चतुर्थक विचलन (quartile deviation)Dr Rajesh Verma
 
विचलनशीलता: एक परिचय
विचलनशीलता:  एक परिचय विचलनशीलता:  एक परिचय
विचलनशीलता: एक परिचय Dr Rajesh Verma
 
Importance of social science research 17.09.2020
Importance of social science research 17.09.2020Importance of social science research 17.09.2020
Importance of social science research 17.09.2020Dr Rajesh Verma
 
केंद्रीय प्रवृत्ति के माप
केंद्रीय प्रवृत्ति के मापकेंद्रीय प्रवृत्ति के माप
केंद्रीय प्रवृत्ति के मापDr Rajesh Verma
 
measures of central tendencies
measures of central tendenciesmeasures of central tendencies
measures of central tendenciesDr Rajesh Verma
 
Measures of central tendencies
Measures of central tendenciesMeasures of central tendencies
Measures of central tendenciesDr Rajesh Verma
 
Mirror drawing Apparatus
Mirror drawing ApparatusMirror drawing Apparatus
Mirror drawing ApparatusDr Rajesh Verma
 

More from Dr Rajesh Verma (20)

1_Anxiety disorders.pptx
1_Anxiety disorders.pptx1_Anxiety disorders.pptx
1_Anxiety disorders.pptx
 
2_Substance related and addictive disorders.pptx
2_Substance related and addictive disorders.pptx2_Substance related and addictive disorders.pptx
2_Substance related and addictive disorders.pptx
 
व्यावहारिक मनोविज्ञान का अर्थ इतिहास (Meaning and History of Applied Pschology)
व्यावहारिक मनोविज्ञान का अर्थ इतिहास (Meaning and History of Applied Pschology)व्यावहारिक मनोविज्ञान का अर्थ इतिहास (Meaning and History of Applied Pschology)
व्यावहारिक मनोविज्ञान का अर्थ इतिहास (Meaning and History of Applied Pschology)
 
National Education day 11 November 2020
National Education day 11 November 2020National Education day 11 November 2020
National Education day 11 November 2020
 
concept of abnormality (Hindi & English)
concept of abnormality (Hindi & English)concept of abnormality (Hindi & English)
concept of abnormality (Hindi & English)
 
सामान्यता की अवधारणा (concept of normality)
सामान्यता की अवधारणा  (concept of normality)सामान्यता की अवधारणा  (concept of normality)
सामान्यता की अवधारणा (concept of normality)
 
concept of normality (English)
concept of normality (English)concept of normality (English)
concept of normality (English)
 
Overview of Quantitative research by Prof Rajbir Singh.
Overview of Quantitative research by Prof Rajbir Singh.Overview of Quantitative research by Prof Rajbir Singh.
Overview of Quantitative research by Prof Rajbir Singh.
 
मानक विचलन (standard deviation)
मानक  विचलन (standard deviation)मानक  विचलन (standard deviation)
मानक विचलन (standard deviation)
 
standard deviation: an introduction
standard deviation: an introductionstandard deviation: an introduction
standard deviation: an introduction
 
चतुर्थक विचलन (quartile deviation)
चतुर्थक विचलन (quartile deviation)चतुर्थक विचलन (quartile deviation)
चतुर्थक विचलन (quartile deviation)
 
विचलनशीलता: एक परिचय
विचलनशीलता:  एक परिचय विचलनशीलता:  एक परिचय
विचलनशीलता: एक परिचय
 
Importance of social science research 17.09.2020
Importance of social science research 17.09.2020Importance of social science research 17.09.2020
Importance of social science research 17.09.2020
 
केंद्रीय प्रवृत्ति के माप
केंद्रीय प्रवृत्ति के मापकेंद्रीय प्रवृत्ति के माप
केंद्रीय प्रवृत्ति के माप
 
measures of central tendencies
measures of central tendenciesmeasures of central tendencies
measures of central tendencies
 
Measures of central tendencies
Measures of central tendenciesMeasures of central tendencies
Measures of central tendencies
 
Maze learning Apparatus
Maze learning ApparatusMaze learning Apparatus
Maze learning Apparatus
 
Mirror drawing Apparatus
Mirror drawing ApparatusMirror drawing Apparatus
Mirror drawing Apparatus
 
AL DL by weight box
AL DL by weight boxAL DL by weight box
AL DL by weight box
 
Muller lyer illusion
Muller lyer illusionMuller lyer illusion
Muller lyer illusion
 

Recently uploaded

Interactive Powerpoint_How to Master effective communication
Interactive Powerpoint_How to Master effective communicationInteractive Powerpoint_How to Master effective communication
Interactive Powerpoint_How to Master effective communicationnomboosow
 
ECONOMIC CONTEXT - LONG FORM TV DRAMA - PPT
ECONOMIC CONTEXT - LONG FORM TV DRAMA - PPTECONOMIC CONTEXT - LONG FORM TV DRAMA - PPT
ECONOMIC CONTEXT - LONG FORM TV DRAMA - PPTiammrhaywood
 
MARGINALIZATION (Different learners in Marginalized Group
MARGINALIZATION (Different learners in Marginalized GroupMARGINALIZATION (Different learners in Marginalized Group
MARGINALIZATION (Different learners in Marginalized GroupJonathanParaisoCruz
 
POINT- BIOCHEMISTRY SEM 2 ENZYMES UNIT 5.pptx
POINT- BIOCHEMISTRY SEM 2 ENZYMES UNIT 5.pptxPOINT- BIOCHEMISTRY SEM 2 ENZYMES UNIT 5.pptx
POINT- BIOCHEMISTRY SEM 2 ENZYMES UNIT 5.pptxSayali Powar
 
Presiding Officer Training module 2024 lok sabha elections
Presiding Officer Training module 2024 lok sabha electionsPresiding Officer Training module 2024 lok sabha elections
Presiding Officer Training module 2024 lok sabha electionsanshu789521
 
भारत-रोम व्यापार.pptx, Indo-Roman Trade,
भारत-रोम व्यापार.pptx, Indo-Roman Trade,भारत-रोम व्यापार.pptx, Indo-Roman Trade,
भारत-रोम व्यापार.pptx, Indo-Roman Trade,Virag Sontakke
 
Pharmacognosy Flower 3. Compositae 2023.pdf
Pharmacognosy Flower 3. Compositae 2023.pdfPharmacognosy Flower 3. Compositae 2023.pdf
Pharmacognosy Flower 3. Compositae 2023.pdfMahmoud M. Sallam
 
Painted Grey Ware.pptx, PGW Culture of India
Painted Grey Ware.pptx, PGW Culture of IndiaPainted Grey Ware.pptx, PGW Culture of India
Painted Grey Ware.pptx, PGW Culture of IndiaVirag Sontakke
 
18-04-UA_REPORT_MEDIALITERAСY_INDEX-DM_23-1-final-eng.pdf
18-04-UA_REPORT_MEDIALITERAСY_INDEX-DM_23-1-final-eng.pdf18-04-UA_REPORT_MEDIALITERAСY_INDEX-DM_23-1-final-eng.pdf
18-04-UA_REPORT_MEDIALITERAСY_INDEX-DM_23-1-final-eng.pdfssuser54595a
 
KSHARA STURA .pptx---KSHARA KARMA THERAPY (CAUSTIC THERAPY)————IMP.OF KSHARA ...
KSHARA STURA .pptx---KSHARA KARMA THERAPY (CAUSTIC THERAPY)————IMP.OF KSHARA ...KSHARA STURA .pptx---KSHARA KARMA THERAPY (CAUSTIC THERAPY)————IMP.OF KSHARA ...
KSHARA STURA .pptx---KSHARA KARMA THERAPY (CAUSTIC THERAPY)————IMP.OF KSHARA ...M56BOOKSTORE PRODUCT/SERVICE
 
CELL CYCLE Division Science 8 quarter IV.pptx
CELL CYCLE Division Science 8 quarter IV.pptxCELL CYCLE Division Science 8 quarter IV.pptx
CELL CYCLE Division Science 8 quarter IV.pptxJiesonDelaCerna
 
History Class XII Ch. 3 Kinship, Caste and Class (1).pptx
History Class XII Ch. 3 Kinship, Caste and Class (1).pptxHistory Class XII Ch. 3 Kinship, Caste and Class (1).pptx
History Class XII Ch. 3 Kinship, Caste and Class (1).pptxsocialsciencegdgrohi
 
DATA STRUCTURE AND ALGORITHM for beginners
DATA STRUCTURE AND ALGORITHM for beginnersDATA STRUCTURE AND ALGORITHM for beginners
DATA STRUCTURE AND ALGORITHM for beginnersSabitha Banu
 
Biting mechanism of poisonous snakes.pdf
Biting mechanism of poisonous snakes.pdfBiting mechanism of poisonous snakes.pdf
Biting mechanism of poisonous snakes.pdfadityarao40181
 
Meghan Sutherland In Media Res Media Component
Meghan Sutherland In Media Res Media ComponentMeghan Sutherland In Media Res Media Component
Meghan Sutherland In Media Res Media ComponentInMediaRes1
 
Solving Puzzles Benefits Everyone (English).pptx
Solving Puzzles Benefits Everyone (English).pptxSolving Puzzles Benefits Everyone (English).pptx
Solving Puzzles Benefits Everyone (English).pptxOH TEIK BIN
 
How to Make a Pirate ship Primary Education.pptx
How to Make a Pirate ship Primary Education.pptxHow to Make a Pirate ship Primary Education.pptx
How to Make a Pirate ship Primary Education.pptxmanuelaromero2013
 
Framing an Appropriate Research Question 6b9b26d93da94caf993c038d9efcdedb.pdf
Framing an Appropriate Research Question 6b9b26d93da94caf993c038d9efcdedb.pdfFraming an Appropriate Research Question 6b9b26d93da94caf993c038d9efcdedb.pdf
Framing an Appropriate Research Question 6b9b26d93da94caf993c038d9efcdedb.pdfUjwalaBharambe
 

Recently uploaded (20)

Interactive Powerpoint_How to Master effective communication
Interactive Powerpoint_How to Master effective communicationInteractive Powerpoint_How to Master effective communication
Interactive Powerpoint_How to Master effective communication
 
ECONOMIC CONTEXT - LONG FORM TV DRAMA - PPT
ECONOMIC CONTEXT - LONG FORM TV DRAMA - PPTECONOMIC CONTEXT - LONG FORM TV DRAMA - PPT
ECONOMIC CONTEXT - LONG FORM TV DRAMA - PPT
 
ESSENTIAL of (CS/IT/IS) class 06 (database)
ESSENTIAL of (CS/IT/IS) class 06 (database)ESSENTIAL of (CS/IT/IS) class 06 (database)
ESSENTIAL of (CS/IT/IS) class 06 (database)
 
MARGINALIZATION (Different learners in Marginalized Group
MARGINALIZATION (Different learners in Marginalized GroupMARGINALIZATION (Different learners in Marginalized Group
MARGINALIZATION (Different learners in Marginalized Group
 
POINT- BIOCHEMISTRY SEM 2 ENZYMES UNIT 5.pptx
POINT- BIOCHEMISTRY SEM 2 ENZYMES UNIT 5.pptxPOINT- BIOCHEMISTRY SEM 2 ENZYMES UNIT 5.pptx
POINT- BIOCHEMISTRY SEM 2 ENZYMES UNIT 5.pptx
 
Presiding Officer Training module 2024 lok sabha elections
Presiding Officer Training module 2024 lok sabha electionsPresiding Officer Training module 2024 lok sabha elections
Presiding Officer Training module 2024 lok sabha elections
 
Model Call Girl in Tilak Nagar Delhi reach out to us at 🔝9953056974🔝
Model Call Girl in Tilak Nagar Delhi reach out to us at 🔝9953056974🔝Model Call Girl in Tilak Nagar Delhi reach out to us at 🔝9953056974🔝
Model Call Girl in Tilak Nagar Delhi reach out to us at 🔝9953056974🔝
 
भारत-रोम व्यापार.pptx, Indo-Roman Trade,
भारत-रोम व्यापार.pptx, Indo-Roman Trade,भारत-रोम व्यापार.pptx, Indo-Roman Trade,
भारत-रोम व्यापार.pptx, Indo-Roman Trade,
 
Pharmacognosy Flower 3. Compositae 2023.pdf
Pharmacognosy Flower 3. Compositae 2023.pdfPharmacognosy Flower 3. Compositae 2023.pdf
Pharmacognosy Flower 3. Compositae 2023.pdf
 
Painted Grey Ware.pptx, PGW Culture of India
Painted Grey Ware.pptx, PGW Culture of IndiaPainted Grey Ware.pptx, PGW Culture of India
Painted Grey Ware.pptx, PGW Culture of India
 
18-04-UA_REPORT_MEDIALITERAСY_INDEX-DM_23-1-final-eng.pdf
18-04-UA_REPORT_MEDIALITERAСY_INDEX-DM_23-1-final-eng.pdf18-04-UA_REPORT_MEDIALITERAСY_INDEX-DM_23-1-final-eng.pdf
18-04-UA_REPORT_MEDIALITERAСY_INDEX-DM_23-1-final-eng.pdf
 
KSHARA STURA .pptx---KSHARA KARMA THERAPY (CAUSTIC THERAPY)————IMP.OF KSHARA ...
KSHARA STURA .pptx---KSHARA KARMA THERAPY (CAUSTIC THERAPY)————IMP.OF KSHARA ...KSHARA STURA .pptx---KSHARA KARMA THERAPY (CAUSTIC THERAPY)————IMP.OF KSHARA ...
KSHARA STURA .pptx---KSHARA KARMA THERAPY (CAUSTIC THERAPY)————IMP.OF KSHARA ...
 
CELL CYCLE Division Science 8 quarter IV.pptx
CELL CYCLE Division Science 8 quarter IV.pptxCELL CYCLE Division Science 8 quarter IV.pptx
CELL CYCLE Division Science 8 quarter IV.pptx
 
History Class XII Ch. 3 Kinship, Caste and Class (1).pptx
History Class XII Ch. 3 Kinship, Caste and Class (1).pptxHistory Class XII Ch. 3 Kinship, Caste and Class (1).pptx
History Class XII Ch. 3 Kinship, Caste and Class (1).pptx
 
DATA STRUCTURE AND ALGORITHM for beginners
DATA STRUCTURE AND ALGORITHM for beginnersDATA STRUCTURE AND ALGORITHM for beginners
DATA STRUCTURE AND ALGORITHM for beginners
 
Biting mechanism of poisonous snakes.pdf
Biting mechanism of poisonous snakes.pdfBiting mechanism of poisonous snakes.pdf
Biting mechanism of poisonous snakes.pdf
 
Meghan Sutherland In Media Res Media Component
Meghan Sutherland In Media Res Media ComponentMeghan Sutherland In Media Res Media Component
Meghan Sutherland In Media Res Media Component
 
Solving Puzzles Benefits Everyone (English).pptx
Solving Puzzles Benefits Everyone (English).pptxSolving Puzzles Benefits Everyone (English).pptx
Solving Puzzles Benefits Everyone (English).pptx
 
How to Make a Pirate ship Primary Education.pptx
How to Make a Pirate ship Primary Education.pptxHow to Make a Pirate ship Primary Education.pptx
How to Make a Pirate ship Primary Education.pptx
 
Framing an Appropriate Research Question 6b9b26d93da94caf993c038d9efcdedb.pdf
Framing an Appropriate Research Question 6b9b26d93da94caf993c038d9efcdedb.pdfFraming an Appropriate Research Question 6b9b26d93da94caf993c038d9efcdedb.pdf
Framing an Appropriate Research Question 6b9b26d93da94caf993c038d9efcdedb.pdf
 

variability an introduction

  • 1. Variability: An Introduction Dr Rajesh Verma Asst. Prof (Psychology) Govt. College Adampur, Hisar, Haryana
  • 2. Case Two psychology professors assesses students’ assignment with average 38 marks (out of 50). Does this indicate that both teachers have same evaluation temperament (assuming such may be disastrous!). Let us consider (i) teacher A awards within 34 to 40 marks, (ii) while teacher B awards within 20 to 48 marks. If you are a student and seeking to get your assignment assessed which teacher you will prefer?? If you are puzzled do not worry, study of ‘variability’ will help you.
  • 3. Meaning Variability means the ability to vary. It has come from word ‘variable’ which means ‘not staying the same’ or ‘often changing’. A situation, quantity, or number which is not constant or that can vary. For example, ‘memory’ and ‘intelligence’ are variables.
  • 4. Definition An index of scattering of scores around the mean (center of distribution) is called variability. It is also known as Spread, Dispersion or Width (Levin & Fox, 2006). Variability measures how much the scores vary from each other.
  • 5. Introduction Nature has complexity as well as simplicity in its creations and follows a pattern. The complexity in the nature inherently occurs due to inter and intra- creations ‘variability’. For example; two rose flowers grown on the same plant are similar yet different. Two chapattis prepared by same cook under similar conditions are similar yet different. Even different coloured flowers grow on same plant.
  • 6. Understanding with Figures Now it’s time for you to tell, out of A & B which figure have higher variability/ spread/ dispersion in terms of size of the circles.
  • 7. Understanding with Graph In this figure the data represented by B has higher dispersion than data represented by A. It shows B has higher variability in its data set than A.
  • 8. Measures of Variability 1. Range, 2. Interquartile range, 3. Mean deviation, 4. Variance, and 5. Standard deviation.
  • 9. 1. Range – The difference between the highest and lowest score in a data set. For example – In the given data set lowest score is 4 and highest score is 30 therefore, 30-4 = 26, So, range is 26. So simple isn’t it? Data Set 4 21 14 8 25 30 11 20 19 26 10
  • 10. 2. Interquartile Range – Range of middle 50% values of a data set. Or distance between the first and third quartile i.e. IQR = Q3-Q1 3. Mean Deviation – Average of absolute differences of raw score from there mean. MD = ∑|𝒙− 𝒙| 𝑵 Where, ∑ = Summation x = score 𝒙 = mean N = no. of score | = Absolute
  • 11. 4. Variance (s) – It is the average of the squared differences of each raw score from the mean. It is denoted by ‘s’. 𝒔 𝟐 = ∑(𝒙− 𝒙) 𝟐 𝑵 5. Standard Deviation (σ) – The square root of variance. It represents the average variability in a data set because it measures the average of deviations from the mean. σ = ∑(𝒙− 𝒙) 𝟐 𝑵 Where, ∑ = Summation x = score 𝒙 = mean N = no. of score s = variance
  • 12. References: 1. Levin, J & Fox, J. A. (2006). Elementary statistics in in social research. Delhi: Dorling Kindersley (India). 2. http://sphweb.bumc.bu.edu /otlt/mph-modules/bs/bs704_ summarizingdata/bs704_ summarizingdata7.html.