Download as PDF, PPTX


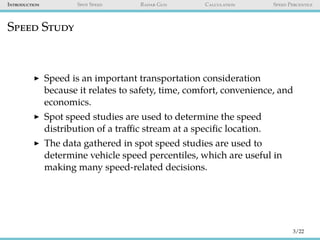
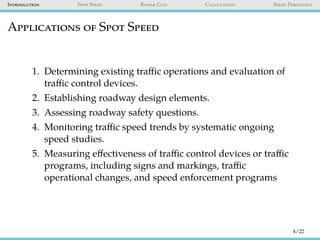


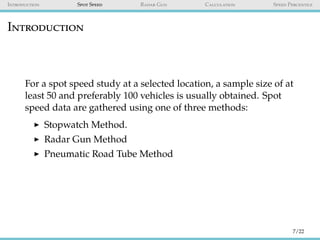


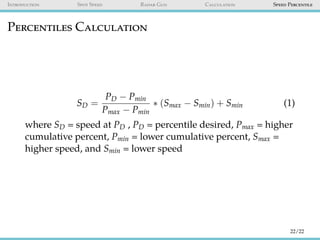


The document is a detailed overview of conducting spot speed studies using radar guns, highlighting its importance in traffic safety, roadway design, and monitoring speed trends. It outlines the methodology for collecting speed data, including strategies for selecting data samples, observed conditions, and calculating speed percentiles. Key variables such as the 50th and 85th percentiles are explained, emphasizing their role in determining effective speed limits and traffic control measures.