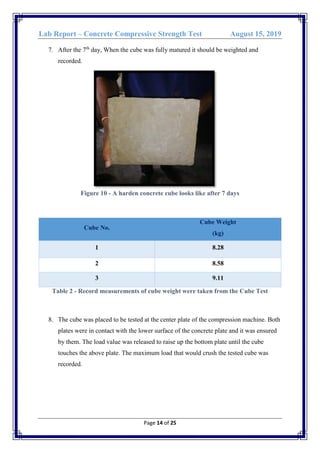
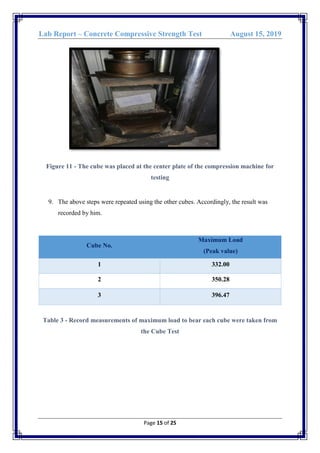
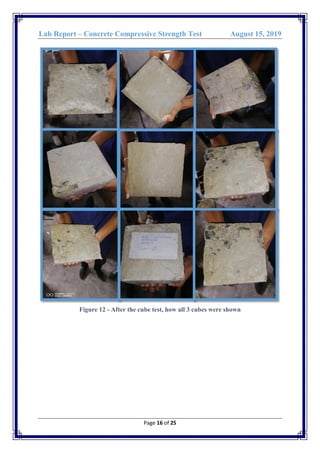
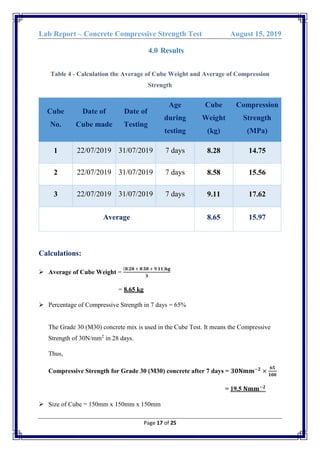
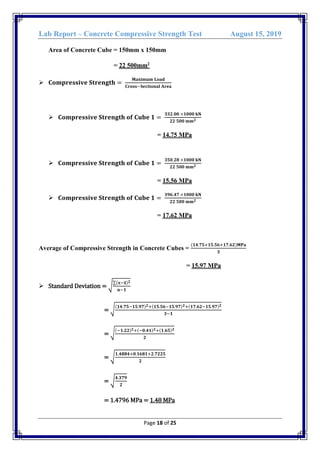
The document describes a laboratory experiment to determine the compressive strength of concrete cubes at 7 days. Three 150mm concrete cubes were cast and tested after 7 days of curing. The average weight of the cubes was 8.65kg. When tested, the cubes failed at an average maximum load of 15.97 MPa. This shows the 7 day compressive strength of the concrete mix met the target strength of 19.5 MPa specified for M30 grade concrete. The results were analyzed to calculate compressive strength and standard deviation according to standard formulas.
The document describes the procedure for conducting a slump test to determine the workability of a concrete mixture. The test involves mixing concrete with a ratio of 1:2:4 of coarse aggregate, fine aggregate, and cement. The mixture is placed in a slump cone in layers and tamped between each layer. When the cone is removed, the slump is measured as the difference between the height of the cone and the highest point of the concrete. For the sample tested, the slump was 50mm indicating medium workability. The slump test provides a simple way to check consistency and uniformity of concrete batches.
The document describes a lab report for a slump test experiment. The objectives were to safely perform a laboratory experiment to determine the workability of freshly mixed concrete. Materials used included cement, coarse aggregates, fine aggregates, and water. Procedures involved mixing the materials, filling a slump cone mold in layers and compacting each layer, lifting the mold, and measuring the slump height. Results showed a true slump of 10mm on the first test and a collapsed slump of 150mm on the second test, indicating too much water was added. The collapsed slump is not suitable for measurement while the true slump corresponds to very low workability concrete for road construction.
This test measures the compressive strength of concrete cubes made and cured according to specific standards. It provides a measure of quality control by testing one property, compressive strength, but results can vary depending on test conditions like specimen size and loading rate. The document outlines how to conduct compression tests on concrete cubes to determine if the concrete meets design specifications. Cubes are made, cured, weighed, and tested for compressive strength at various ages to see how strength develops over time. Detailed procedures are provided for casting, curing, operating the compression machine, and analyzing results.
The document provides information about a site investigation using a Mackintosh probe at a proposed school site. It includes an introduction to site investigations and the purpose of using a Mackintosh probe. Details are given about the equipment, procedures, and sample logs of penetration resistance readings from six probe locations. The conclusion compares the Mackintosh probe to JKR probes and notes limitations of the Mackintosh probe. References for further information are also included.
The sand replacement test determines the in situ density of natural or compacted soils using sand pouring cylinders. The test involves excavating a soil sample, measuring its mass, and replacing the excavated volume with sand of a known density to find the sample volume. This allows calculating the dry density based on the sample mass and volume. The test establishes a relationship between dry density and moisture content. It is used to evaluate compaction levels in the field according to acceptance criteria for different depths.
The document describes procedures for determining the liquid limit and plastic limit of soil samples. The liquid limit test involves adding water to soil and determining the moisture content at which a groove closes after 25 blows. The plastic limit is the moisture content at which a soil ball crumbles after rolling out to 3mm diameter. These limits are used to classify soils and predict properties like strength and compressibility. The plasticity index, defined as the liquid limit minus the plastic limit, provides further information on soil type and reactivity. Proper determination of the Atterberg limits is important for building foundations to ensure suitable shear strength and volume change with moisture fluctuations.
1) The Proctor compaction test is used to determine the optimal moisture content and maximum dry density of soil. It involves compacting soil in layers in a mold using controlled blows and measuring the dry density at different moisture contents.
2) The test procedure involves weighing equipment, sieving dry soil, compacting soil in layers using blows from a ram, weighing the compacted soil, determining moisture content, and repeating at different moisture contents.
3) A compaction curve is made by plotting dry density against moisture content. The peak of the curve indicates the optimum moisture content which produces the highest dry density.
DCC3113 DETERMINATION OF AGGREGATE IMPACT VALUE.YASMINE HASLAN
This document summarizes a laboratory report on determining the aggregate impact value of samples according to Malaysian Public Works Department (JKR) standards. The experiment involved subjecting aggregate samples to impact blows using a test machine and sieve. The percentage of fines passing through a 2.36mm sieve was calculated to determine the aggregate impact value. Sample 1 had a 17% impact value and Sample 2 was 15%, both below the JKR requirement of 20%, indicating the aggregates have medium toughness and resistance to crushing. The results show the aggregates met the JKR specifications and the experiment was successfully conducted.
This experiment examines how shear forces vary with increasing point loads applied to a beam. Theoretical calculations of shear force are compared to experimental measurements. As the applied load increases, both the theoretical and experimental shear forces increase linearly. The experimental shear forces are slightly lower than theoretical values. This shows that the equation used to calculate shear force theoretically accurately predicts the beam's behavior under different loading conditions. The results demonstrate the importance of understanding shear forces in structural engineering design.
1. The document describes a concrete slump test conducted by a student to determine the workability and consistency of a concrete mix.
2. The test procedure involves filling a slump cone with the concrete in layers, tamping each layer with a rod, and measuring the amount the concrete sinks after removing the cone.
3. The results of the test on a concrete mix with a water-cement ratio of 0.45 showed zero slump, indicating a dry mix suitable for road construction where vibration is used for compaction.
1) The document describes procedures for measuring hydrostatic force using a water vessel and scale. Weights are added incrementally while measuring the water level.
2) Data is recorded for appended weight, lever arm length, water level, calculated lever arm, resultant force, and moments.
3) Sources of error are discussed, such as neglecting the weight of the balance and reading errors, which could explain discrepancies between theoretical and experimental values of the center of pressure.
Sieve analysis of coarse and fine aggregate - ReportSarchia Khursheed
1. The document summarizes a sieve analysis test performed on coarse and fine aggregates to determine particle size distribution.
2. Sieve analysis involves sieving aggregate samples using a series of sieves and weighing the material retained on each sieve to determine the percentage passing and retained.
3. The results showed that for coarse aggregate, 18% was retained on the 20mm sieve, 78% on the 10mm sieve, and 4% passed the 5mm sieve. For fine aggregate, 24% was retained on the 4.75mm sieve, and the percentage passing decreased through smaller sieves with 0.11% passing the 150μm sieve.
The document describes an experiment to determine the aggregate impact value of a given specimen through a standardized test procedure. Three samples were tested by subjecting aggregates retained between 10mm and 12.5mm sieves to 15 blows from a falling hammer. The percentage of material passing a 2.36mm sieve was calculated to determine the aggregate impact value, with average values below 10 considered strong and above 35 too weak for construction. The tested samples had average impact values of 44.13%, indicating suitability for construction applications.
This document provides instructions for performing a fly level observation, or rise and fall method, of levelling. The procedure involves taking readings between benchmark points of known elevation and change points using a level, staff, and tripod. Readings are recorded in a level book and used to calculate the reduced level at each change point. Arithmetical checks and allowable misclosures are determined to ensure precision of the work. The document outlines the objective, equipment, procedures, results and computations, conclusion, and references for the fly level observation levelling technique.
1. The document describes an experiment to determine the reactions at supports of a continuous beam subjected to point loads and uniformly distributed loads. Reactions are measured using load cells and compared to theoretical calculations.
2. For a beam with a point load, measured reactions were within 12% of calculations. For a beam with uniform loading, measured reactions matched calculations within 4% except at one support where they matched exactly.
3. Differences between measured and calculated reactions are likely due to imperfections in the old laboratory apparatus and effects of airflow on measurements. The experiment successfully validated the theoretical reactions within an acceptable margin of error.
The report is being made on the experience of 3 weeks office training.
briefly describes the quality tests of Fine and Coarse aggregates .
Complete calculation of concrete mix design is included with solved numerical equations.
Cement, water and admixtures quality test is not performed because the contractor purchase it from other chemical and cement manufacturer company.
1. The document describes an experiment conducted to determine hydrostatic pressure and the center of pressure acting on a plane surface using a hydrostatic pressure apparatus.
2. The experiment involved setting the apparatus at an angle, balancing it by adding weights, and measuring the water level as more weights were added.
3. Calculations were done to find theoretical and practical hydrostatic pressures using equations for the area, height, resultant force, and center of pressure. The results showed some difference between theoretical and practical pressures.
The Mackintosh Probe is a lightweight penetrometer that is faster and cheaper than boring equipment, especially for moderate depths in soft or loose soils. It consists of 16mm steel rods connected by couplings that prevent buckling during driving with a 5kg hammer from 30cm above. The number of blows to penetrate 30cm is recorded and used to evaluate soil consistency, density, and parameters. It allows disturbed soil sampling and subsurface stratigraphy identification. Advantages include being light, easy to use, economical, and faster than other tools, while disadvantages include potential for human error, limited depth, and inability to penetrate medium-strength soils. The procedure involves assembling the probe, driving it with blows counted for 30cm intervals, until 15
This document summarizes a sieve test experiment conducted on fine aggregate to determine its grain size distribution. The experiment involved sieving 500g of dry fine aggregate through various sized sieves, weighing the material retained on each sieve, and calculating the percentage passing and retained. The results were plotted on a grading curve and compared to BS standards to evaluate the quality of the aggregate sample. In conclusion, the experiment was successfully performed and the fineness modulus calculated. The aggregate sample fell within the acceptable range specified by standards.
This report describes an experiment to determine the flakiness index of an aggregate sample. The sample was sieved into different size fractions and particles that passed through thickness gauge slots less than 0.6 times their mean sieve size were considered flaky. Based on the mass of flaky particles measured, the flakiness index of the sample was calculated to be 5.6%, which meets the maximum 20% required by JKR standards. While some experimental error occurred, the conclusion is that the sample's flakiness level is acceptable for highway construction if proper compaction is performed to limit voids.
The document discusses reinforced concrete columns, including their functions, failure modes, classifications, and design considerations. Columns primarily resist axial compression but may also experience bending moments. They can fail due to compression, buckling, or a combination. Design depends on whether the column is short or slender, braced or unbraced. Reinforcement is designed based on the column's expected loads and dimensions using methods specified in design codes like BS 8110.
The document discusses different methods for taking off quantities from construction drawings to produce bills of quantities. Traditionally, quantities were measured and dimensions recorded on ruled paper before being totaled and abstracted into bills. However, many practices now take off quantities directly in bill order or produce abstract sheets in bill order to streamline the process. The Chartered Institute of Building Services Engineers' method (CESMM) is also discussed as the definitive standard for civil engineering measurement.
This document describes the design of a pile cap by a group of civil engineering students. It defines a pile cap as a concrete mat that rests on piles driven into soft ground to provide a stable foundation. It then provides two examples of pile cap design, showing dimensions, load calculations, reinforcement requirements and construction details. The document concludes that a pile cap distributes a building's load to piles to form a stable foundation on unstable soil. It acknowledges the guidance of professors in completing this project.
The document provides derivations of design equations for reinforced concrete beams. It begins by deriving the equation for maximum moment capacity of a singly reinforced beam based on concrete strength as M=0.167*fck*b*d^2. It then derives equations for doubly reinforced beams where compression steel is also required. The document further derives equations for design of flanged beams depending on whether the neutral axis lies within the flange or web. It concludes by outlining design procedures for singly and doubly reinforced beams.
This document discusses various concepts related to structural analysis of arches:
1. An arch is a curved girder supported at its ends, allowing only vertical and horizontal displacements for arch action.
2. The general cable theorem relates the horizontal tension and vertical distance from any cable point to the cable chord moment.
3. Arches are classified based on support conditions (3, 2, or 1 hinged) or shape (curved, parabolic, elliptical, polygonal).
4. Horizontal thrust in arches reduces the bending moment and is calculated differently for various arch types (e.g. parabolic) and loading (e.g. UDL).
The document describes the construction process for columns, slabs, and beams in reinforced concrete structures. It discusses the materials used and the typical steps involved, which include:
1) Layout and formwork installation
2) Placement of reinforcing steel based on structural designs
3) Pouring and finishing of concrete
4) Curing of concrete to gain full strength over 28 days
The columns transfer loads vertically through reinforced concrete that is mixed on site or delivered by ready-mix trucks. Slabs and beams are constructed through similar processes of steel reinforcement, formwork, concrete placement and curing.
The document describes procedures for testing the fineness of cement and aggregates. It includes sieve analysis tests to determine the particle size distribution of coarse and fine aggregates according to ASTM standards. The tests are important to ensure aggregates and cement meet specifications for use in construction materials like concrete. The document provides details on apparatus, procedures, calculations, observations and safety precautions for each test. It contains 13 experiments related to testing concrete and its materials.
IRJET- VStudy on Strength and Durability Properties of Concrete using Steel S...IRJET Journal
This study investigated the strength and durability properties of concrete using steel slag as a replacement for crushed stone coarse aggregate. A total of 81 concrete cubes, cylinders, and prisms were cast with 0%, 25%, 50%, and 75% replacements of steel slag aggregate. Additional mixes replaced 100% of the coarse aggregate with steel slag both with and without silica fume. The concrete was tested for mechanical properties such as compressive strength, modulus of elasticity, and flexural strength as well as durability properties including acid attack resistance and rapid chloride permeability. Test results showed that 50% replacement of steel slag achieved similar mechanical properties as the crushed stone control mix. Durability properties were also comparable or better than the control mix. Therefore
IRJET- Study on Cellular Lightweight Concrete with Crushed Coconut shellsIRJET Journal
The document studies using crushed coconut shells to partially replace fine aggregate in cellular lightweight concrete (CLC) in order to increase its compressive strength. CLC is commonly used but has low compressive strength compared to conventional concrete. Previous research found crushed coconut shells can significantly increase the strength of normal concrete. The study produced CLC cubes with 15%, 20%, 25% and 30% fine aggregate replaced by crushed coconut shells. After 28 days of curing, the 20% replacement cubes achieved the highest compressive strength of 8.44 MPa, showing potential to improve CLC strength through coconut shell addition.
The document provides information about designing and building a concrete beam as part of a student project. Students are given specifications for the beam and learn about concepts related to concrete through a series of questionnaires. They then use what they've learned to design, build, and test their beam. The goal is for the beam to support the greatest weight possible while meeting the specifications.
Micro Silica as Partial Replacement of Cement in ConcreteIRJET Journal
This document summarizes a study on using micro silica as a partial replacement for cement in concrete. Researchers partially replaced cement with micro silica at levels of 5-15% by weight in increments of 2.5% to test the compressive, splitting tensile, and flexural strengths of cubes, cylinders, and beams. The results showed that compressive strength peaked at a 12.5% replacement level. Both splitting tensile and flexural strengths also increased as the micro silica level increased, reaching their highest points at 12.5% replacement. The study concluded that micro silica can improve the strength properties of concrete, with an optimal replacement level of 12.5% cement.
The document describes changes made by CIE to question papers for popular assessments with large candidature. CIE uses different variants of question papers that are closely related and give equal assessment standards. This means for some components there are now two variant question papers, mark schemes, and principal examiner reports, rather than just one previously. Centres will receive both variants, giving more past exam material. The diagram shows the relationship between question papers, mark schemes, and principal examiner reports for the first and second variants. Centres with questions should contact CIE customer services. Variant items should be clearly labeled as first or second variant in the document.
The document describes changes made by CIE to question papers for popular assessments with large candidature. CIE uses different variants of question papers that are closely related and give equal assessment standards. This means for some components there are now two variant question papers, mark schemes, and principal examiner reports, rather than just one previously. The variants are intended to only be used in different countries. The document contains both variants to give centers access to more past exam material. A diagram shows the relationship between the question papers, mark schemes, and principal examiner reports for the first and second variants. Anyone with questions should contact CIE customer services. The titles of the variant items in the document should correspond to those in the diagram.
The document describes changes made by CIE to some question papers for popular assessments with large candidature. CIE uses different but closely related variants of these question papers. This means for some components there are now two variant question papers, mark schemes, and principal examiner reports, rather than just one previously. For any individual country, only one variant will be used. The document contains both variants to provide centres with more past examination material. A diagram shows the relationship between the question papers, mark schemes, and principal examiner's reports for the first and second variants. Centres with questions should contact CIE's customer services. The variant items should be clearly labelled.
The document describes changes made by CIE to some question papers for popular assessments with large candidature. CIE uses different but closely related variants of these question papers. This means for some components there are now two variant question papers, mark schemes, and principal examiner reports, rather than just one previously. Centres will have access to more past examination material as a result. The variants have been thoroughly established to ensure equal assessment standards.
The document summarizes changes made by the Cambridge International Examinations (CIE) to some of their question papers for popular assessments with large numbers of candidates. CIE now uses two similar but distinct variants for some question papers, mark schemes, and examiner reports where previously there was only one. This allows for more past exam material to be available to candidates while maintaining the same standard of assessment across variants. The variants have established relationships to one another through CIE's assessment expertise. Centres will use only one variant for a given administration, but the document provides access to both so candidates have even more practice material.
The document is a thesis report submitted by Ng Jun Jie to the Department of Mechanical Engineering at the National University of Singapore in partial fulfillment of the requirements for a Bachelor of Engineering degree. The report analyzes and aims to improve the jacking systems used for lifting offshore jack-up rigs by studying the fatigue life of the rack and pinion mechanism and proposing ways to reduce stress through modeling and simulation.
IRJET- Interpretation of Compressive Strength in Concrete Cube and CylinderIRJET Journal
This document presents a study on interpreting the compressive strength of concrete cubes and cylinders using destructive and non-destructive testing methods. Concrete cubes and cylinders of varying grades (M20, M25, M30, M40) were tested at 28 days using compressive testing (destructive) as well as rebound hammer and ultrasonic pulse velocity (non-destructive) tests. The results found that the average compressive strengths from cubes were higher than cylinders. Regression analysis was used to develop relationships between the different test methods. Equations relating compressive strength to rebound number and pulse velocity were developed for both cubes and cylinders.
IRJET- An Experimental Study on Flexural Strength of Bubble Deck SlabIRJET Journal
1) The document presents an experimental study on the flexural strength of bubble deck slabs compared to conventional slabs.
2) Four slabs were cast - one conventional slab and three bubble deck slabs with varying numbers of hollow plastic balls.
3) Single point load tests were performed on the slabs using a universal testing machine. The load carrying capacity, load-deflection behavior, and flexural strength were analyzed and compared between the slab types.
4) The results showed that the load carrying capacity, flexural strength, and load-deflection behavior of the bubble deck slabs were similar to the conventional slab, demonstrating that replacing concrete with hollow balls does not negatively impact strength.
IRJET - Experimental Investigation on Plasticizing Agent in ConcreteIRJET Journal
The study investigated the effects of replacing cement with molasses in concrete. Molasses is a byproduct of sugar production that can serve as a plasticizing agent in concrete. Concrete cubes and cylinders were cast using 0%, 0.8%, and 0.9% molasses replacement by weight of cement. The specimens were tested for compressive strength, flexural strength, and split tensile strength at 7, 14, and 28 days. The results showed that up to 0.9% molasses replacement increased the strengths of the concrete over time compared to the 0% replacement mix. Additionally, workability of the fresh concrete decreased with higher molasses content due to its water-reducing effects. Therefore, molasses can effectively be
This document provides instructions for students taking a chemistry exam. It states that students should write their identification details on all work submitted. Answers should be written in dark blue or black pen, with diagrams done in pencil. Staples, paper clips, etc. should not be used. The document contains 13 printed pages and 3 blank pages. It informs students to answer all questions and fasten their work together at the end. The number of marks for each question is provided in brackets.
IRJET- An Experimental Study on Mechanical Properties of Concrete by Partial ...IRJET Journal
The document presents the results of an experimental study on the mechanical properties of concrete with partial replacement of cement with Alccofine and coarse aggregate with recycled concrete aggregate (RCA). Concrete cubes, cylinders, and beams were tested to determine the compressive strength, split tensile strength, and flexural strength at 7, 14, and 28 days. The results show that compressive strength decreases with increasing replacement levels but is highest at 15% Alccofine and 5% RCA replacement. Split tensile strength also decreases with higher replacement levels except at 15% Alccofine and 5% RCA replacement, which produced the maximum strength. Flexural strength follows a similar trend. Therefore, the optimum replacement for improved mechanical
IRJET- Combined Effect of Glass Powder & Coconut Fiber on Strength of ConcreteIRJET Journal
This document summarizes research into using glass powder and coconut fiber as partial replacements for cement and coarse aggregate in concrete. In initial tests, coconut fiber was used to replace coarse aggregate at levels of 3%, 5%, and 7%. Compressive strength was highest with 3% fiber replacement. Additional tests then used 3% fiber and replaced cement with 5%, 10%, 15%, and 20% glass powder. Compressive and flexural strengths were found to be similar to or higher than standard concrete without replacements. The research aims to improve sustainability by using waste materials in concrete without compromising strength.
Assessment of Properties of Concrete with Partial Replacement by Coconut Cons...IRJET Journal
This study assessed properties of concrete with partial replacements of cement and coarse aggregate by coconut constituents. Various concrete mixtures were prepared with 0-20% replacement of cement by coconut shell ash and 0-20% replacement of coarse aggregate by coconut shell. Tests on compressive strength, split tensile strength, and bond strength showed that maximum increases occurred with 10% cement and 10% coarse aggregate replacements. Concrete density was lowest with 20% coarse aggregate replacement, classifying it as lightweight concrete. The study concluded that using coconut constituents as replacements provides an economical concrete option for construction in areas where coconut is abundant.
This document is a master's thesis submitted by Tina Lai to the Department of Civil and Environmental Engineering at MIT in 2010. It examines the structural behavior of BubbleDeck* slabs and their potential application to lightweight bridge decks. The thesis provides an overview of BubbleDeck* construction, analyzes its structural properties through previous testing and research, models test office and bridge deck slabs using BubbleDeck* and solid concrete, and compares the results. The analysis demonstrates that BubbleDeck* can achieve comparable structural performance to solid slabs while reducing material usage and weight.
IRJET- Utilization of Bottle Cap and E-Glass Powder on Partial Coarse and ...IRJET Journal
This document summarizes a study on utilizing waste materials like bottle caps and e-glass powder as partial replacements for coarse and fine aggregates in concrete.
Trial mixes were conducted to determine the optimum percentages of e-glass and fly ash replacements. Concrete mixtures were then prepared with bottle caps replacing coarse aggregates at 1-4%. Testing showed that workability decreased as bottle cap content increased. Compressive, tensile, and flexural strengths generally increased up to 3% bottle cap replacement but decreased at 4%. Replacing fine aggregate with 10% e-glass and cement with 5% fly ash produced the highest strengths compared to normal concrete. The use of these wastes as partial replacements improved the sustainability of the concrete.
Redefining brain tumor segmentation: a cutting-edge convolutional neural netw...IJECEIAES
Medical image analysis has witnessed significant advancements with deep learning techniques. In the domain of brain tumor segmentation, the ability to
precisely delineate tumor boundaries from magnetic resonance imaging (MRI)
scans holds profound implications for diagnosis. This study presents an ensemble convolutional neural network (CNN) with transfer learning, integrating
the state-of-the-art Deeplabv3+ architecture with the ResNet18 backbone. The
model is rigorously trained and evaluated, exhibiting remarkable performance
metrics, including an impressive global accuracy of 99.286%, a high-class accuracy of 82.191%, a mean intersection over union (IoU) of 79.900%, a weighted
IoU of 98.620%, and a Boundary F1 (BF) score of 83.303%. Notably, a detailed comparative analysis with existing methods showcases the superiority of
our proposed model. These findings underscore the model’s competence in precise brain tumor localization, underscoring its potential to revolutionize medical
image analysis and enhance healthcare outcomes. This research paves the way
for future exploration and optimization of advanced CNN models in medical
imaging, emphasizing addressing false positives and resource efficiency.
Literature Review Basics and Understanding Reference Management.pptxDr Ramhari Poudyal
Three-day training on academic research focuses on analytical tools at United Technical College, supported by the University Grant Commission, Nepal. 24-26 May 2024
A review on techniques and modelling methodologies used for checking electrom...nooriasukmaningtyas
The proper function of the integrated circuit (IC) in an inhibiting electromagnetic environment has always been a serious concern throughout the decades of revolution in the world of electronics, from disjunct devices to today’s integrated circuit technology, where billions of transistors are combined on a single chip. The automotive industry and smart vehicles in particular, are confronting design issues such as being prone to electromagnetic interference (EMI). Electronic control devices calculate incorrect outputs because of EMI and sensors give misleading values which can prove fatal in case of automotives. In this paper, the authors have non exhaustively tried to review research work concerned with the investigation of EMI in ICs and prediction of this EMI using various modelling methodologies and measurement setups.
DEEP LEARNING FOR SMART GRID INTRUSION DETECTION: A HYBRID CNN-LSTM-BASED MODELgerogepatton
As digital technology becomes more deeply embedded in power systems, protecting the communication
networks of Smart Grids (SG) has emerged as a critical concern. Distributed Network Protocol 3 (DNP3)
represents a multi-tiered application layer protocol extensively utilized in Supervisory Control and Data
Acquisition (SCADA)-based smart grids to facilitate real-time data gathering and control functionalities.
Robust Intrusion Detection Systems (IDS) are necessary for early threat detection and mitigation because
of the interconnection of these networks, which makes them vulnerable to a variety of cyberattacks. To
solve this issue, this paper develops a hybrid Deep Learning (DL) model specifically designed for intrusion
detection in smart grids. The proposed approach is a combination of the Convolutional Neural Network
(CNN) and the Long-Short-Term Memory algorithms (LSTM). We employed a recent intrusion detection
dataset (DNP3), which focuses on unauthorized commands and Denial of Service (DoS) cyberattacks, to
train and test our model. The results of our experiments show that our CNN-LSTM method is much better
at finding smart grid intrusions than other deep learning algorithms used for classification. In addition,
our proposed approach improves accuracy, precision, recall, and F1 score, achieving a high detection
accuracy rate of 99.50%.
A SYSTEMATIC RISK ASSESSMENT APPROACH FOR SECURING THE SMART IRRIGATION SYSTEMSIJNSA Journal
The smart irrigation system represents an innovative approach to optimize water usage in agricultural and landscaping practices. The integration of cutting-edge technologies, including sensors, actuators, and data analysis, empowers this system to provide accurate monitoring and control of irrigation processes by leveraging real-time environmental conditions. The main objective of a smart irrigation system is to optimize water efficiency, minimize expenses, and foster the adoption of sustainable water management methods. This paper conducts a systematic risk assessment by exploring the key components/assets and their functionalities in the smart irrigation system. The crucial role of sensors in gathering data on soil moisture, weather patterns, and plant well-being is emphasized in this system. These sensors enable intelligent decision-making in irrigation scheduling and water distribution, leading to enhanced water efficiency and sustainable water management practices. Actuators enable automated control of irrigation devices, ensuring precise and targeted water delivery to plants. Additionally, the paper addresses the potential threat and vulnerabilities associated with smart irrigation systems. It discusses limitations of the system, such as power constraints and computational capabilities, and calculates the potential security risks. The paper suggests possible risk treatment methods for effective secure system operation. In conclusion, the paper emphasizes the significant benefits of implementing smart irrigation systems, including improved water conservation, increased crop yield, and reduced environmental impact. Additionally, based on the security analysis conducted, the paper recommends the implementation of countermeasures and security approaches to address vulnerabilities and ensure the integrity and reliability of the system. By incorporating these measures, smart irrigation technology can revolutionize water management practices in agriculture, promoting sustainability, resource efficiency, and safeguarding against potential security threats.
Introduction- e - waste – definition - sources of e-waste– hazardous substances in e-waste - effects of e-waste on environment and human health- need for e-waste management– e-waste handling rules - waste minimization techniques for managing e-waste – recycling of e-waste - disposal treatment methods of e- waste – mechanism of extraction of precious metal from leaching solution-global Scenario of E-waste – E-waste in India- case studies.
Advanced control scheme of doubly fed induction generator for wind turbine us...IJECEIAES
This paper describes a speed control device for generating electrical energy on an electricity network based on the doubly fed induction generator (DFIG) used for wind power conversion systems. At first, a double-fed induction generator model was constructed. A control law is formulated to govern the flow of energy between the stator of a DFIG and the energy network using three types of controllers: proportional integral (PI), sliding mode controller (SMC) and second order sliding mode controller (SOSMC). Their different results in terms of power reference tracking, reaction to unexpected speed fluctuations, sensitivity to perturbations, and resilience against machine parameter alterations are compared. MATLAB/Simulink was used to conduct the simulations for the preceding study. Multiple simulations have shown very satisfying results, and the investigations demonstrate the efficacy and power-enhancing capabilities of the suggested control system.
Optimizing Gradle Builds - Gradle DPE Tour Berlin 2024Sinan KOZAK
Sinan from the Delivery Hero mobile infrastructure engineering team shares a deep dive into performance acceleration with Gradle build cache optimizations. Sinan shares their journey into solving complex build-cache problems that affect Gradle builds. By understanding the challenges and solutions found in our journey, we aim to demonstrate the possibilities for faster builds. The case study reveals how overlapping outputs and cache misconfigurations led to significant increases in build times, especially as the project scaled up with numerous modules using Paparazzi tests. The journey from diagnosing to defeating cache issues offers invaluable lessons on maintaining cache integrity without sacrificing functionality.
Comparative analysis between traditional aquaponics and reconstructed aquapon...bijceesjournal
The aquaponic system of planting is a method that does not require soil usage. It is a method that only needs water, fish, lava rocks (a substitute for soil), and plants. Aquaponic systems are sustainable and environmentally friendly. Its use not only helps to plant in small spaces but also helps reduce artificial chemical use and minimizes excess water use, as aquaponics consumes 90% less water than soil-based gardening. The study applied a descriptive and experimental design to assess and compare conventional and reconstructed aquaponic methods for reproducing tomatoes. The researchers created an observation checklist to determine the significant factors of the study. The study aims to determine the significant difference between traditional aquaponics and reconstructed aquaponics systems propagating tomatoes in terms of height, weight, girth, and number of fruits. The reconstructed aquaponics system’s higher growth yield results in a much more nourished crop than the traditional aquaponics system. It is superior in its number of fruits, height, weight, and girth measurement. Moreover, the reconstructed aquaponics system is proven to eliminate all the hindrances present in the traditional aquaponics system, which are overcrowding of fish, algae growth, pest problems, contaminated water, and dead fish.
The Python for beginners. This is an advance computer language.
Cube test report
1. HND in Civil Engineering
Module
Code Title Assessor / Examiner
CE 403
Engineering Mechanics and Strength of
Materials
Eng. C. Peiris
Assessment 1
Title : Portfolio – Lab Reports Weighting :
20%
Submit to: Deadline
Office Blackboard Other
SIS
Late submissions will incur a penalty according to the regulations
Additional submission details:
OBJECTIVES OF THIS ASSESMENT IS TO LET THE STUDENT:
Perform laboratory experiments safely and deal with recording, analyzing
and interpretation of results.
ASSESSMENT STRATEGY AND METHODS
Assessment
Assessment
Type Description
Task
Weighting%
Deadline
Assessment 01 COURSEWORK(CW) Investigative Report – 1500 30% Week 7
Assessment 02 COURSEWORK(CW) Portfolio - Lab Reports 20% Week 10
Assessment 0 EXAM
Written Examination (Closed Book –
2 Hours)
50%
Week 17
2. Lab Report – Concrete Compressive Strength Test August 15, 2019
Page 2 of 25
3. Lab Report – Concrete Compressive Strength Test August 15, 2019
Page 3 of 25
Laboratory Experiment No. 02 –
Concrete Compressive Strength Test
4. Lab Report – Concrete Compressive Strength Test August 15, 2019
Page 4 of 25
ICBT Higher National Diploma in Civil Engineering
Cardiff Metropolitan University – UK
International College of Business & Technology
Colombo Campus
No: 36, De Krester Place,
R. A. De. Mel Mawatha,
Bambalapitiya,
Sri Lanka.
Assignment No- 02
“ Portfolio - Lab Report ’’
By
Sri Sanduli Devini Weerasekara
Colombo Campus - CL/HNDCivil/12/35
HND in Civil Engineering
Submit to – Mr. C.N. Peirispulle
Submitted date – 2019.08.15
ICBT Campus
2019
5. Lab Report – Concrete Compressive Strength Test August 15, 2019
Page 5 of 25
Acknowledgement
I take the opportunity to offer a sincere graduate to my guide Ms. Eeshani Perera
Laboratory lecture in Laboratory Experiment of Engineering Mechanics and Strength of
Materials subject for her kind support in completion of this Lab Practicals and Lab Report in
a very successful manner. And also, I wish to thank you for teaching how to do this practicals
easily.
And also, I wish to thank you Ms. Sachini De Silva and Mr. C.N. Peirispulle for
teaching well about how to do these practicals in an easy way to us before doing the lab
practicals.
Finally, I wish to thank my parents & friends for their support & encouragement
throughout the completion of this report.
6. Lab Report – Concrete Compressive Strength Test August 15, 2019
Page 6 of 25
Table of Contents
1.0 Introduction...................................................................................................................8
2.0 Apparatus & Materials.................................................................................................9
3.0 Procedure.....................................................................................................................13
4.0 Results..........................................................................................................................17
5.0 Discussion.....................................................................................................................19
6.0 Conclusion ...................................................................................................................21
7.0 References....................................................................................................................23
Table of Tables
Table 1 - Quantities of using materials of concrete mix.....................................................12
Table 2 - Record measurements of cube weight were taken from the Cube Test............14
Table 3 - Record measurements of maximum load to bear each cube were taken from
the Cube Test..........................................................................................................................15
Table 4 - Calculation the Average of Cube Weight and Average of Compression
Strength...................................................................................................................................17
Table 5 - The Compressive Strength of concrete at different Ages...................................21
Table 6 - Compressive Strength of Different Grades of Concrete at 7 and 28 Days.......22
7. Lab Report – Concrete Compressive Strength Test August 15, 2019
Page 7 of 25
Table of Figures
Figure 1 - Concrete Cube Test kit set.....................................................................................9
Figure 2 - Compression Testing Machine..............................................................................9
Figure 3 - Steel Cube Molds..................................................................................................10
Figure 4 - Measurements of a Cube Mold ...........................................................................10
Figure 5 - Steel Rod ...............................................................................................................11
Figure 6 - Hand Float ............................................................................................................11
Figure 7 - Materials of Concrete mix...................................................................................12
Figure 8 - Grease....................................................................................................................12
Figure 9 - How the group members were filled the cubes and compacted each layer 35
times using the steel rod ........................................................................................................13
Figure 10 - A harden concrete cube looks like after 7 days ...............................................14
Figure 11 - The cube was placed at the center plate of the compression machine for
testing ......................................................................................................................................15
Figure 12 - After the cube test, how all 3 cubes were shown .............................................16
Figure 13 - Water-Cement ratio versus Strength ...............................................................20
8. Lab Report – Concrete Compressive Strength Test August 15, 2019
Page 8 of 25
1.0 Introduction
The Concrete Cube Crushing Test is determined the Compressive
Strength of hardening concrete. Via this test determined the specification of concrete fulfills
required. Compressive Strength means the ability of the structure to carry the loads on its
surface without any deflections or cracks. In here, under compression, the size of the
structure is reduced.
The Formula of Compressive Strength of Hardening Concrete
𝐂𝐨𝐦𝐩𝐫𝐞𝐬𝐬𝐢𝐯𝐞 𝐒𝐭𝐫𝐞𝐧𝐠𝐭𝐡 =
𝑴𝒂𝒙𝒊𝒎𝒖𝒎 𝑳𝒐𝒂𝒅
𝑪𝒓𝒐𝒔𝒔 − 𝑺𝒆𝒄𝒕𝒊𝒐𝒏𝒂𝒍 𝑨𝒓𝒆𝒂
After removing cubes the age of 3, 7, 14, 21 and 28 days in curing bath, the cube test can be
done for the harden concrete cubes. Day by day, the compressive strength of concrete
increased. Therefore, The compressive strength of concrete increases according to age. The
28 days concrete strength considered as the standard day for most of the concrete works. The
temperature and moisture affect the increment rate of the concrete strength in the hardening
process. The Grade 30 (M30) concrete mix is used in the Cube Test. Followings are the
factors affecting the compressive strength of concrete.
Water-Cement ratio
Cement Strength
Quality of concrete materials
Quality control during production of concrete
9. Lab Report – Concrete Compressive Strength Test August 15, 2019
Page 9 of 25
2.0 Apparatus & Materials
Apparatus
Figure 1 - Concrete Cube Test kit set (Anon., n.d.)
1. Compression Testing Machine
Figure 2 - Compression Testing Machine (Anon., n.d.)
The Compression Strength Machine is used to test the Compressive Strength of
hardening concrete.
10. Lab Report – Concrete Compressive Strength Test August 15, 2019
Page 10 of 25
2. Steel Cube Mold
Figure 3 - Steel Cube Molds (Anon., n.d.)
Figure 4 - Measurements of a Cube Mold (Anon., n.d.)
The Steel Cube Molds is used to place the fresh concrete for the hardening process.
3. Steel Rod
The Steel Rod is used to compact each concrete layer to remove the air voids and
subsequent layers penetrate into the underlying layer.
Height of Steel Rod – 60 cm
Length of Steel Rod – 25 mm
11. Lab Report – Concrete Compressive Strength Test August 15, 2019
Page 11 of 25
Width of Steel Rod – 25 mm
Figure 5 - Steel Rod (Anon., n.d.)
4. Hand Float
Figure 6 - Hand Float (Anon., n.d.)
Hand Float is used to level (plate) the surface in the over concrete layer.
Materials
1. Cement, Sand, Aggregates & Water
12. Lab Report – Concrete Compressive Strength Test August 15, 2019
Page 12 of 25
Figure 7 - Materials of Concrete mix (Anon., n.d.)
Materials
Cement
(kg)
Fine
Aggregate
(kg)
Coarse
Aggregate
(kg)
Water
(kg or liters)
Quantities 3.465 1.87 6.105 15.62
Table 1 - Quantities of using materials of concrete mix
Mix ratio of Cement : Fine Aggregate : Coarse Aggregate = 1 : 2 : 4
2. Grease
Figure 8 - Grease (Anon., n.d.)
Grease oil is used to prevent the concrete from sticking to the cube mold.
13. Lab Report – Concrete Compressive Strength Test August 15, 2019
Page 13 of 25
3.0 Procedure
1. The mold that was used in the cube test must be cleaned internally using the wire
brush. Because remove any residual particles from previous concrete tests.
2. The interior surface of the assembled mold was required to be thinly coated with
grease oil to prevent adhesion of concrete.
3. The mixed concrete was poured with a certain mix proportion into the mold in 3
layers and each layer was must be tamped 35 times using the compacting steel rod.
The mold was filled up until overflow and leveled the surface using the hand float.
Figure 9 - How the group members were filled the cubes and compacted each layer 35
times using the steel rod
4. The concrete mixture cube was left for 24 hours setting.
5. The above steps were should be repeated for another 2 more cubes with the same mix
proportion.
6. The date of the mixture was recorded for every cube and all 3 cubes were submerged
in the curing tank at the temperature of 18 degrees Celsius – 20 degrees Celsius.
Tested on the 7th
day.
14. Lab Report – Concrete Compressive Strength Test August 15, 2019
Page 14 of 25
7. After the 7th
day, When the cube was fully matured it should be weighted and
recorded.
Figure 10 - A harden concrete cube looks like after 7 days
Cube No.
Cube Weight
(kg)
1 8.28
2 8.58
3 9.11
Table 2 - Record measurements of cube weight were taken from the Cube Test
8. The cube was placed to be tested at the center plate of the compression machine. Both
plates were in contact with the lower surface of the concrete plate and it was ensured
by them. The load value was released to raise up the bottom plate until the cube
touches the above plate. The maximum load that would crush the tested cube was
recorded.
15. Lab Report – Concrete Compressive Strength Test August 15, 2019
Page 15 of 25
Figure 11 - The cube was placed at the center plate of the compression machine for
testing
9. The above steps were repeated using the other cubes. Accordingly, the result was
recorded by him.
Cube No.
Maximum Load
(Peak value)
1 332.00
2 350.28
3 396.47
Table 3 - Record measurements of maximum load to bear each cube were taken from
the Cube Test
16. Lab Report – Concrete Compressive Strength Test August 15, 2019
Page 16 of 25
Figure 12 - After the cube test, how all 3 cubes were shown
17. Lab Report – Concrete Compressive Strength Test August 15, 2019
Page 17 of 25
4.0 Results
Table 4 - Calculation the Average of Cube Weight and Average of Compression
Strength
Cube
No.
Date of
Cube made
Date of
Testing
Age
during
testing
Cube
Weight
(kg)
Compression
Strength
(MPa)
1 22/07/2019 31/07/2019 7 days 8.28 14.75
2 22/07/2019 31/07/2019 7 days 8.58 15.56
3 22/07/2019 31/07/2019 7 days 9.11 17.62
Average 8.65 15.97
Calculations:
Average of Cube Weight =
(𝟖.𝟐𝟖 + 𝟖.𝟓𝟖 + 𝟗.𝟏𝟏)𝐤𝐠
𝟑
= 8.65 kg
Percentage of Compressive Strength in 7 days = 65%
The Grade 30 (M30) concrete mix is used in the Cube Test. It means the Compressive
Strength of 30N/mm2
in 28 days.
Thus,
Compressive Strength for Grade 30 (M30) concrete after 7 days = 𝟑𝟎𝐍𝐦𝐦−𝟐
×
𝟔𝟓
𝟏𝟎𝟎
= 19.5 𝐍𝐦𝐦−𝟐
Size of Cube = 150mm x 150mm x 150mm
19. Lab Report – Concrete Compressive Strength Test August 15, 2019
Page 19 of 25
5.0 Discussion
1. Why the inner surface of the mold shall be coated with the grease oil?
The inner surface of the mold shall be coated with the grease oil because to
prevent leakage during filling the concrete and to prevent the concrete from sticking to it,
otherwise, the hardening concrete cube won’t release from the mold.
2. How can the value of standard deviation describe the strength and quality of the
concrete?
Standard Deviation indicates the deviation of a set of variables from the mean value.
The less the standard deviation value is, the more values are close together and
indicates more consistency results. It is a measure of how the strength behavior of the
concrete is changing. That when the cubes are tested compressive strength the range
of minimum and maximum value determine the SD. Its value increases along with the
strength of cement required, as much more accuracy is required for making high
strength grade mixture. SD will be less if the quality at the materials of a concrete
mixture is better and if the quality is poor, the SD will be high. Thus, Standard
Deviation inversely proportional to the Quality of concrete. It is best if our
compressive strength value is a bit less than our minimum range of strength.
According to our cube test results, our SD value is 1.48. Thus, it is a very low
value. Therefore, the strength and quality of our concrete are very high.
3. Describe how the strength can be affected with the variation of water cement ratio?
The ratio of the amount of water to the amount of cement by weight is known as the
“water-cement ratio”. The strength of concrete depends on this ratio. In a hardened concrete,
strength is inversely proportional to the water/cement ratio. The quantity of water added to
the cement while preparing concrete mixes has been known to exert tremendous influence on
the quality of concrete. Water affects the durability and strength of concrete.
The relation between the water-cement ratio and the strength of concrete in 28
days is shown in the below figure. Compressive strength is high when the water-cement ratio
20. Lab Report – Concrete Compressive Strength Test August 15, 2019
Page 20 of 25
is low. The lower water-cement ratio could be used when the concrete is vibrated to achieve
higher strength. The lower water-cement ratio means less water, or more cement and lower
workability.
Figure 13 - Water-Cement ratio versus Strength
When the water-cement ratio is high
If the W / c ratio is high, a large quantity of water can be obtained per unit
weight of cement in the concrete mix. Then some water will still be left when the concrete
hardens and is ready for use. This trapped water was evaporated, leaving some air voids in
the concrete block. The presence of voids results in reduced strength.
When the water-cement ratio is low
In this case, there will be very less amount of water in the block of formwork
when the concrete is poured into it, and hence lesser voids.
Therefore, low water and cement ratio can cause serious problems in hard concrete.
Thus, the water-cement ratio is the most important factor in the concrete.
21. Lab Report – Concrete Compressive Strength Test August 15, 2019
Page 21 of 25
6.0 Conclusion
In the Cube Test is determined the Compressive Strength of hardening concrete.
The apparatus of the cube molds, steel rod, hand float, and compression testing machine
(CTM) are used for doing the cube test.
The ratio of cement, fine aggregate, coarse aggregate and water to 1: 2: 4: ½ were used to
prepare the concrete mixture.
The Grade 30 (M30) concrete mix is used in the Cube Test.
After removing cubes the age of 3, 7, 14, 21 and 28 days in curing bath, the cube test can
be done for the harden concrete cubes.
After 28 days, the compressive strength of hardening concrete is very high.
We were done our cube test after 7 days.
According to our results, we were done our cube practical test in very successfully.
But some of the factors such as the first time we added water, we got a dry mix and after
we added water, then the concrete mix is too wet, the top surface was absorbed some
water from the concrete mix, the cement is spread through the air because of the wind and
when mixing the material of concrete mix, they were spread everywhere and some of the
cubes are loose, therefore that cubes can’t be fixed properly were affected our cube test
results.
However, our cube practical test was a success and we got the idea such as how to do the
cube test, the situation of freshly mixed concrete and how to do the practicals in the
practical lab with safety, how to use the material of concrete, how to prepare the good
concrete mix are some of them.
Table 5 - The Compressive Strength of concrete at different Ages (Anon.,
2014)
Age Percentage of Compressive Strength
1 day 16%
3 day 40%
7 day 65%
22. Lab Report – Concrete Compressive Strength Test August 15, 2019
Page 22 of 25
14 day 90%
28 day 99%
Table 6 - Compressive Strength of Different Grades of Concrete at 7 and
28 Days (Anon., 2014)
Grade of Concrete
Minimum compressive
strength N/mm2 at 7 days
Specified characteristic
compressive strength
(N/mm2) at 28 days
M15 10 15
M20 13.5 20
M25 17 25
M30 20 30
M35 23.5 35
M40 27 40
M45 30 45
Finally, I would like to thank our guide Ms. Eeshani Perera in our practical tests to give
your knowledge clearly to us.
And also, I think these practical tests benefit a lot on my subject and for my future as it
prepares me to overcome many upcoming problems. Overall, it was a great experience for
me.
23. Lab Report – Concrete Compressive Strength Test August 15, 2019
Page 23 of 25
7.0 References
Anon., 2014. The Constructor - Civil Engineering Home. [Online]
Available at: https://theconstructor.org/concrete/compressive-strength-concrete-cube-
test/1561/
[Accessed 02 04 2014].
Anon., n.d. Compression Testing Machine. [Online]
Available at: https://theconstructor.org/wp-content/uploads/2011/11/digital-compression-
testing-machine.jpg
Anon., n.d. Cube test apparatures. [Online]
Available at:
data:image/jpeg;base64,/9j/4AAQSkZJRgABAQAAAQABAAD/2wCEAAkGBxISEhU
TExMVFhUXFRgXFRgXGBcXGBcYFxUWFxgXGBgYHSggGBolHRcWITEhJSkrLi4
vFx8zODMtNygtLisBCgoKDg0OGxAQGy0lHyUtLS0tLS0tLS0uLS0tLTUtLS0tLS0tLS
0tLS0tLS0tLS0tLSstLS0tLS0rLS0tLS0tLf/AABEIAI0BZQMBIgACEQEDEQH/
Anon., n.d. Grease. [Online]
Available at:
data:image/jpeg;base64,/9j/4AAQSkZJRgABAQAAAQABAAD/2wCEAAkGBxITEhU
TExIVFRUXFhUVFRUYFRUVFxYWFxUWFhUVFRcYHSggGBolGxUWITEhJikrLi4
uFx8zODMtNygtLisBCgoKDg0OGhAQGy0lICUtLS0tLS0tLS0tLS0tLS0tLS0tLS0tLS0
tLS0tLS0tLS0tLS0tLS0tLS0tLS0tLS0tLf/AABEIAOEA4QMBIgACEQEDEQH/
Anon., n.d. Hand Float. [Online]
Available at:
https://www.masterwholesale.com/media/catalog/product/cache/1/image/9df78eab33525d
08d6e5fb8d27136e95/t/-/t-mt_14634.jpg
Anon., n.d. Materials of Concrete mix. [Online]
Available at:
data:image/jpeg;base64,/9j/4AAQSkZJRgABAQAAAQABAAD/2wCEAAkGBxMTEh
USEhIWFhUXGB4YFhgXGRogHRoeIR8aGB4dGh4YICkgGh0lHh8gIjEiJikrLi4uGB8z
ODMsNygtLisBCgoKDg0OGxAQGy0mICUtLS0tLy4rLS0vLy0tLS0tLS0tLS8tLi0tLS8t
LS0vLS0tLy8tLS0tLS0tLS8tLS0tLf/AABEIAH8BiwMBEQACEQEDEQH/
24. Lab Report – Concrete Compressive Strength Test August 15, 2019
Page 24 of 25
Anon., n.d. Steeel Rod. [Online]
Available at: https://5.imimg.com/data5/VN/KE/MY-720938/tamping-bar-500x500.jpg
Anon., n.d. Steel Cube Mold. [Online]
Available at:
data:image/jpeg;base64,/9j/4AAQSkZJRgABAQAAAQABAAD/2wCEAAkGBxMTEh
UTExMWFhUVFRgVFxgWFRcVFhYXGBUWFhUYGBcYHSggGBolHRUVITEhJSkr
Li4uFx8zODMtNygtLisBCgoKDg0OGhAQGi0lIB0tLS0tLS0tLS0tLS0tLS0tKy0tLS0tL
S0tLS0tLS0tLS0tLS4tLS0tLS0tLy0tLS0tLf/AABEIAOEA4QMBEQACEQEDEQH/
Anon., n.d. Steel Cube Molds. [Online]
Available at:
data:image/jpeg;base64,/9j/4AAQSkZJRgABAQAAAQABAAD/2wCEAAkGBxISEhUS
EhIWFRUXFRYVFRUVFRgWFxgVFRUWFhUXFxYYHSggGBolHRUVITEhJSkrLi4
uFx8zODMtNygtLisBCgoKDg0OFxAQGi0eHx8tLS0tLS0tLS0tLSstLy0tLS0tLS0tLS0t
LS0tKy0tLS0tLS0tLS0tKy0tLS0rLSstLf/AABEIAOEA4QMBIgACEQEDEQH/
25. Lab Report – Concrete Compressive Strength Test August 15, 2019
Page 25 of 25