
Recommended
Recommended
More Related Content
What's hot
What's hot (20)
Similar to Genetic divergence study in introgressed F6 progenies from interspecific cross of (g. arboreum x g. anomalum) x g. barbadense
Similar to Genetic divergence study in introgressed F6 progenies from interspecific cross of (g. arboreum x g. anomalum) x g. barbadense (20)
Recently uploaded
Recently uploaded (20)
Genetic divergence study in introgressed F6 progenies from interspecific cross of (g. arboreum x g. anomalum) x g. barbadense
- 1. Electronic Journal of Plant Breeding, 6(3): 680-687 (Sep 2015) ISSN 0975-928X http://ejplantbreeding.com 680 Research Article Genetic divergence study in introgressed F6 progenies from interspecific cross of (G. arboreum x G. anomalum) x G. barbadense . Parde N. S.1 , Zate D.K.2 , Bhalerao G.A.3 , and Mehetre S. S.4 1 Department of Agricultural Botany, Mahatma Phule Krishi Vidyapeeth, Rahuri, Ahmednagar District, Maharashtra, India -413 722, E-mail: nimuparde1@gmail.com 2 College of Agriculture, Golegaon, VNMKV, Parbhani, Hingoli District, Maharashtra -431705. 3 College of Agriculture, Golegaon, VNMKV, Parbhani, Hingoli District, Maharashtra-431705, 4 Mahatma PhuleKrishiVidyapeeth, Rahuri, Ahmednagar District, Maharashtra-413 722 (Received:10 Mar 2015; Accepted:28 May 2015) Abstract The present investigation was conducted with an objective to study genetic diversity available in 41 diverse F6 progenies of interspecific cross with six checks of cotton, evaluated during Summer, 2009 by using Mahalanobis D2 method. The genotypes were grouped into fourteen clusters indicating presence of appreciable amount of diversity and maximum number of progenies (22) were grouped into cluster-I followed by cluster-III, with thirteen progenies and remaining clusters were solitary. The highest intra cluster distance was observed between the progenies of cluster-III and included more diverse genotypes than the remaining clusters. The highest inter cluster D2 value was observed between clusters XI and XIV. Among the characters studied the highest contribution to the divergence was noted for short fibre index followed by plant height and seed cotton yield per plant. This study helps to understand diversity in the progenies and to identify appropriate genetic material for improvement of specific characters. Key words Cotton, genetic diversity, D2 analysis, fibre properties Introduction Cotton, the ‘White Gold’ and ‘King of fibre crops’ enjoys a pre-eminent status among all the cash crops in the country and elsewhere by providing principle raw material, the cotton, for textile industry. It is an important agricultural commodity and provides remunerative income to millions of farmers both in developed and developing countries. About 60 million people in our country are engaged in textile industry. Taxonomically cotton is described under the class Malvales, family Malvaceae, series Hibisceae and the genus Gossypium. The genus Gossypium includes about 50 species out of which 45 are diploid (2n=2x=26) and five are tetraploid (2n=4x=52). Currently Gossypium includes 50 species, four of which are cultivated, 44 are wild diploids and two are wild tetraploids (Percival and Kohel, 1990). Out of the four cultivated species, Gossypium hirsutumL. and G. barbadense commonly called as new world cottons belong to tetraploids (2n = 4x = 52), whereas G. herbaceum L. and G. arboretum are diploids (2n = 2x = 26) and are commonly called as old world cottons. It was one of the first crops to which, the rediscovered Mendelian principles were applied (Ballis, 1906). Wild species of Gossypium are rich with rare desirable attributes that are not available in the germplasm of cultivated species. Hence, conservation of wild germplasm along with other genetic stocks forms an integral part of breeding strategy in cotton improvement. Hybridization between species is undertaken either for exploiting the hybrid vigour or to incorporate desirable gene or constellation of genes into cultivated species. Hence, introgression of character/s through interspecific hybridization is resorted to, to enrich the genetic heritage of the cultivated species. The possibilities of evolving interspecific commercial hybrid between G. hirsutum and G. barbadense with extra long, fine, strong and silky fibre were indicated in early 1950s. The first of such interspecific hybrid between American and Egyptian cotton known as Varalaxmi was released in 1972 (Katarki, 1981). Katageri and Kadapa (1989) identified bollworm tolerant interspecific hybrids. Wild species of cotton which form the bulk of the genus Gossypium are the source of genes for resistance to pests and diseases, with good fibre properties. As G. anomalum is known to contribute high fibre strength, there is need to transfer this trait to cultivated species to meet textile needs. If the fertile derivatives are recovered from crosses between cultivated cotton and G. anomalum, having normal seed setting, they will be a valuable source of exceptional good qualities like strength, luster and smooth silky feel. Attempt were made (Mehetre et. al., 2002) to transfer some of the useful character of G. anomalum to cultivated cottons, through interspecific hybridization and hexaploid F1 hybrids of G. hirsutum X G. anomalum have also been reported (Mehetre et. al., 2003). Materials and Methods The present investigation was carried out under All India Co-ordinated Cotton Improvement Project, at Rahuri, Ahmed nagar District, during summer, 2009. The materials for present investigation were consisted of F6 generation of three ways cross (G.
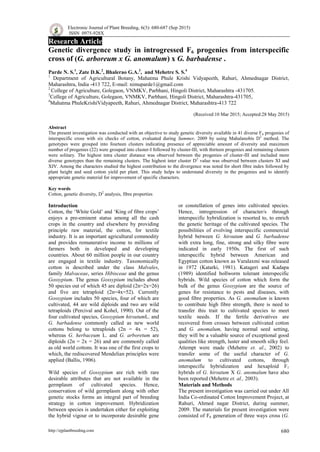
- 2. Electronic Journal of Plant Breeding, 6(3): 680-687 (Sep 2015) ISSN 0975-928X http://ejplantbreeding.com 681 arboretum × G. anomalum) × G. barbadense. The parental material was selected from species garden maintained at Cotton Improvement Project, M.P.K.V., Rahuri. The experimental seed material was already generated by (Mehetre et al., 2004) at All India Co-ordinated Cotton Improvement Project (AICCIP), Rahuri. The experiment was conducted in Randomized Block Design with three replications during summer, 2009. Each plot consisted of single row of 7.2 mt in length with spacing of 90 cm between rows and 60 cm between plants within rows for introgressed progenies, 90 cm between rows and 90.0 cm between plants within rows for intra hirsutum hybrids and 120 cm between rows and 120 cm between plants within rows for inter specific hybrids. The randomization was done irrespective of spacing. The border row of maize along with cowpea was grown from all sides of plot as trap crops. Five randomly selected competitive plants of each progeny of each replication were taken for recording observations on 16 morphological characters viz, Days to first flowering, days to 50% flowering, days to boll bursting, days to maturity, plant height, plant spread/plant, average boll weight, seed index, lint index, ginning per cent, seed cotton yield per plant, locular damage, jassids / aphids / thrips/ white fly incidence (no./leaves/grate) and 5 fibre properties viz., 2.5% span length, fibre strength, micronaire, elongation and SFI. The data was subjected to multivariate analysis as suggested by Mahalanobis (1936) and genotypes were grouped into different clusters following Tocher’s method (Rao, 1952) and character contribution towards diversity was estimated. The intra and inter cluster distances were calculated by the formula given by Singh and Chaudhary (1977). Results and discussion In the present study during summer 2009, the 41 introgressed F6 progenies with 6 standard checks grouped into 14 clusters based on D2 statistics for 21 characters. Similar reports indicating substantial diversity in cotton were available from Sandhu et al. (1987) and Sandhu and Boparai (1997) who grouped 69 F6 genotypes into twelve clusters and from Basavaraddi and Katageri (2011) who grouped twenty four derivatives of F8 generation of cross between G. hirsutum var. DS-28 and G. barbadense var. SB (YF) - 425 into eight clusters. The distribution pattern of genotypes into fourteen clusters is shown in table 1. The torcher’s cut off Value were at 173.20. The diagrammatic representation depicting the special position of each cluster in relation to other cluster is shown in figure 1. Among fourteen cluster, cluster I was the largest with 22 progenies followed by cluster III with 13 progenies. The remaining clusters (cluster II, IV, V, VI, VII, VIII, IX, X, XI, XII, XIII and XIV) were solitary each containing single progeny. Distribution of genotypes into different clusters suggested the presence of substantial genetic divergence among the genotypes and indicated that these materials may serve as a good source for selecting the diverse parents for hybridization programme aimed at isolating desirable recombinants for seed cotton yield as well as other characters. Average intra and inter cluster D2 values are given in table 2. Intra cluster distance was highest in the cluster III with D2 values of 157.92 followed by cluster I with D2 value 114.52, suggesting that genotypes in cluster III were relatively more diverse than the genotypes in other clusters. The highest inter cluster distance (1532.90) was recorded between cluster XI and cluster XIV followed by 1269.91 (cluster V and cluster XIV), 1144.66 (cluster IV and cluster XIV). The lowest inter cluster distance was noticed between cluster IV and cluster V (71.55) followed by 99.61(cluster VIII and cluster IX) indicating close genetic relationship between genotypes of these clusters and consequently lesser importance in enhancing expression of desirable traits. Similar results were reported by Singh et al. (2004), Satish et al. (2009) and Basavaraddi and Katageri (2011). The contribution of individual characters to the divergence has been worked out in terms of number of times it appeared first. The percent contribution of each character towards the divergence is given in table 3. Among the characters studied the highest contribution to the divergence was recorded for short fibre index (55.23%) followed by plant height (10.27%) and seed cotton yield per plant (5.92%). Contribution to total divergence was also reported by Sandhu and Boparai (1997), Sambarmurthyet al. (1995a and 1995b ), Singh et al. (2004) and Sakthi et al. (2009). Analysis of cluster means revealed the relative contribution of different traits to the total divergence by the different clusters. Based on range of means, it is possible to know the characters influencing divergence. In the present investigation, it was observed that progenies grouped under cluster IV recorded highest (83.73 g) cluster mean for seed cotton yield. In respect of component characters, cluster XI recorded minimum value (55.33) for days to first flowering at desirable direction, cluster II recorded minimum value (76.00) for days to 50% flowering, cluster X recorded minimum mean (107.67) for days to boll bursting and locular damage (10.67%), while cluster VII recorded minimum value (128.33) for maturity. Cluster XIII recorded highest cluster mean for plant height (144.40 cm), while cluster VI for plant spread (90.27 cm). Cluster XII recorded highest mean (4.01 g) for boll weight, while cluster X recorded for seed index (10.25 g) and cluster V recorded highest mean for lint index
- 3. Electronic Journal of Plant Breeding, 6(3): 680-687 (Sep 2015) ISSN 0975-928X http://ejplantbreeding.com 682 (6.53) and ginning percentage (41.67%) (Table 4).In case of sucking pest infestation, cluster IX recorded lowest mean for aphids (9.55) and jassids (4.22) incidence, while cluster VIII recorded lowest mean (0.22) for white fly incidence. Progenies in cluster II, IV, V, VI, VII, IX, X and XIV recorded zero cluster mean value for thrips incidence (Table 5). In case of fibre properties, progenies in cluster XI recorded maximum mean for 2.5% span length (34.20) and fibre strength (25.30). Cluster VII recorded for minimum mean (2.80) in desirable direction for micronaire and progeny in cluster XIV recorded highest mean (14.30) for short fibre index (Table 6). Thus, these genotypes hold great promise as parental stock to create genetic variability as well as suitable donors for improvement of these characters in hybridization programme. References Ballis, W. L. 1906. Studies in Egyptian cotton in ‘yearbook khediv, agric. Soc., pp: 29-89. Basavaraddi, N. and Katageri, I.S. 2011.Genetic diversity studies in recombinant lines from interspecific cross of G. hirsutumx G. barbadense. Karnataka J. Agric. Sci., 24(3): 268 - 272. Katageri, I.S. and Kadapa, S.N. 1989. Heterosis and gene action for yield and contributing characters in inter-specific hybrids (G. hirsutumx G. barbadense).The Indian J. Genet Plant Breed.,49(1): 107-111. Katarki, B.H. 1981. Annual Report, DCH-32, high yielding interspecific hybrid, University of Agricultural Sciences, Bangalore. Mahalanobis, P. C. 1936. On the generalized distance in statistics.Proc. Nat. Acad. Sci., India, 2 : 49- 55. Mehetre, S.S., Aher, A.R., Shinde, G.C., Gomes, M. and Eapen, S. 2004. RAPD analysis of interspecific hybrid between Gossypium arboretum and Gossypium stocksii. Caryologia, 57(2): 167-171. Mehetre, S.S., Aher, A.R., Patil, V.R., Gawande, V.L., Mokate, A.S., Gomes, M. and Eapen, S. 2003. Cytomorphological and molecular bases of interspecific hybrid of Gossypium davidsonii and Gossypium anomalum. Sabrao J. Breed.,5(1): 43-56. Mehetre, S.S., Gawande, V.L. and Aher, A.R. 2002. Use of exogenous chemicals for overcoming cross incompatibility in Gossypiumspp. J. Plant. Biol., 29(1): 33-38. Percival, E. and Kohel, R.J. 1990. Distribution collection and evaluation of Gossypium.Adv. Agron., 44: 225-228. Rao, C.R. 1952. Advanced Statistics Methods in Biometry, John Wiley, New York, pp. 357- 369. Sakthi, A.R. Kumar, M and Ravikesavan, R. 2009. Genetic diversity in cotton (Gossypium hirsutum). Adv. Plant Sci., 22(1): 285-291. Sambamurthy, J.S.V., Reddy, D.M. and Reddy, K.H.G. 1995a .Studies on the nature of genetic divergence in upland cotton (G. hirsutumL.).Ann. Agric. Res., 16(3): 307-310. Sambamurthy, J.S.V., Reddy, D.M. and Reddy, K.H.G. 1995b . Genetic divergence for lint characters in upland cotton (G. hirsutum). Ann. Agric. Res., 16(3): 357- 359. Sandhu, B.S. and Boparai, M.S. 1997. Genetic divergence in GossypiumarboreumL. Indian J. Genet.,57(4) : 461-465. Sandhu, B.S., Arora, R.L. and Mehandiratta, P.D. 1987. Genetic divergence in Gossypiumarboreum L. Genetica Agraria, 41: 411-418. Satish, Y., Jain, P.P. and Chhabra, B.S. 2009. Studies on genetic diversity in upland cotton (Gossypium hirsutum L.). J. Cotton Res., 23(1): 18-22 Singh P., Rao, G. N. and Reddy, M. S., 2004. Studies on heritability and variability for yield and its components in cotton(Gossypium hirsutumL.). J. Cot. Res. Dev., 15(1): 84-86. Singh, P.K. and Chaudhary, B.D. 1977. Biometrical Methods in Quantitative Genetic Analysis, 1st Edn., Kalyani Publishers, New Delhi.
- 4. Electronic Journal of Plant Breeding, 6(3): 680-687 (Sep 2015) ISSN 0975-928X http://ejplantbreeding.com 683 Table 1. Cluster-wise distribution of 47 F6 progenies of Cotton Sl. No. Cluster No. of genotypes Name of progenies 1 I 22 64A/3R1T2-19, 52WA/3R2T1-9, LRA-5166, 9T/3R1T2-12, 63WA/6-5, 64A/3R2T1-6, 8T/6R2T2-5, 63WA/3R1T1, 10aab/20R2T2-12, 52WA/9R1T2-5, 9aab/6R2T1-10, 9aab/7R1T1-5, 45/7R1T1-2, 8T/6R1T2-12, 13D/3R2T1-1, 64A/3R1T1-1, Mallika non Bt, 9aab/6R1T2-18, 1T/5R1T2-1, 8T/6R2T2-8, 15/12R2T2-7, 10aab/6R2T2-17. 2 II 1 Phule 388 3 III 13 4T/5R1T2-15, 8T/6R1T2-1, 4T/5R1T1-8, 4T/5R1T2-15, 47/6R1T1-12, 15/1R1T2-7, 1T/5R2T2-13, 52WA/17R2T1-3, 1T/5R2T2-6, 10aab/20R2T2-7, 9aab/4R2T1-8, 1T/3R1T1- 13, 15/12R1T2-9 4 IV 1 MallikaBt 5 V 1 83/8R1T2-5 6 VI 1 5T/2R1T2-13 7 VII 1 52WA/3R2T1-6 8 VIII 1 10aab/20R1T2-15 9 IX 1 1T/5R2T2-5 10 X 1 RHCB-001 11 XI 1 Phule 688 12 XII 1 10aab/6R1T2-15 13 XIII 1 15/6R1T1-7 14 XIV 1 13D/9R2T2-9 Table 2. Average intra and inter cluster D2 values in 47 cotton progenies Cluster I II III IV V VI VII VIII IX X XI XII XIII XIV I 114.52 237.64 246.11 184.20 214.14 222.96 194.78 191.61 243.62 225.04 350.26 209.30 331.57 632.06 II 0.00 121.69 489.82 655.32 221.65 490.73 424.09 402.97 522.03 777.15 285.78 453.69 214.93 III 157.92 494.16 596.66 241.01 438.55 416.68 395.68 527.88 793.17 308.14 391.78 303.18 IV 0.00 71.55 240.67 143.63 194.48 328.66 115.10 131.45 347.45 403.58 1144.66 V 0.00 390.52 154.83 199.42 343.15 109.02 122.78 360.69 461.67 1269.91 VI 0.00 273.07 322.85 291.77 313.56 502.68 354.74 234.08 708.71 VII 0.00 140.95 185.55 124.98 170.16 401.91 400.49 1019.89 VIII 0.00 99.61 280.96 244.72 483.95 605.28 926.04 IX 0.00 383.18 381.78 517.44 518.52 918.85 X 0.00 117.45 302.49 417.85 1083.83 XI 0.00 544.17 696.75 1532.90 XII 0.00 225.91 579.75 XIII 0.00 871.66 XIV 0.00
- 5. Electronic Journal of Plant Breeding, 6(3): 680-687 (Sep 2015) ISSN 0975-928X http://ejplantbreeding.com 684 Table 3. Per cent contribution of each character towards divergence in 47 F6 progenies of Cotton Sr. No. Characters Per cent contribution Rank 1 Days to 50% Flowering 0.09 1 2 Days to Maturity 6.20 67 3 Plant Height (cm) 10.27 111 4 Plant Spread (cm) 2.31 25 5 Average Boll Weight (g) 0.00 0 6 Seed Index (g) 0.93 10 7 Lint index 0.46 5 8 Ginning % 6.20 67 9 Locular Damage (%) 1.94 21 10 2.5 % Span Length (mm) 1.20 13 11 Fibre Strength (g/Tex) 3.05 33 12 Micronaire (µg/Inch) 0.19 2 13 Elongation (%) 2.50 27 14 SFI (%) 55.23 597 15 Seed Cotton Yield/ Plant (g) 5.92 64
- 6. Electronic Journal of Plant Breeding, 6(3): 680-687 (Sep 2015) ISSN 0975-928X http://ejplantbreeding.com 685 Table 4. The cluster-wise mean values for twelve characters of F6 progenies of cotton Cluster Days to 1st Flower (no.) Days to 50% Flower (no.) Days to Boll Burst (no.) Days to Maturity (no.) Plant Height (cm) Plant Spread (cm) Average Boll Weight (g) Seed Index (g) Lint index (g) Ginning % Locular Damage (%) Seed Yield/pl (g) 1 Cluster 66.59 80.42 115.70 135.30 100.18 72.03 3.31 8.52 5.45 38.99 14.86 63.98 2 Cluster 66.00 76.00 116.33 136.67 106.60 72.00 3.21 9.26 4.86 34.40 12.33 78.28 3 Cluster 63.59 79.00 114.67 133.64 102.54 70.77 3.04 8.12 4.86 37.30 16.74 61.59 4 Cluster 66.33 79.67 109.00 130.00 115.87 86.87 3.60 9.65 5.67 36.99 13.00 83.73 5 Cluster 67.00 79.00 116.00 133.67 104.53 79.87 3.37 9.14 6.53 41.67 16.00 54.67 6 Cluster 64.33 80.67 112.67 131.33 141.67 90.27 3.27 9.01 5.00 35.71 19.00 70.33 7 Cluster 67.00 78.00 110.00 128.33 102.33 71.07 3.37 7.77 4.38 35.96 15.67 43.01 8 Cluster 62.67 78.00 114.33 136.33 88.80 76.07 3.35 9.35 4.75 33.67 19.33 48.27 9 Cluster 68.33 79.67 125.00 141.67 103.20 74.40 2.45 7.63 3.81 33.33 21.33 41.67 10 Cluster 62.00 79.00 107.67 130.67 113.53 72.80 2.61 10.25 6.15 37.50 10.67 48.93 11 Cluster 55.33 77.00 112.67 132.00 106.40 70.67 3.43 10.07 5.70 36.16 16.33 79.33 12 Cluster 63.67 77.00 118.00 136.00 104.20 68.47 4.01 9.38 6.01 39.06 13.67 57.20 13 Cluster 64.00 79.00 112.33 132.33 144.40 75.53 2.75 6.59 4.71 41.67 12.00 51.53 14 Cluster 62.33 76.67 121.67 133.33 77.40 52.33 2.56 9.02 5.01 35.71 13.33 44.27
- 7. Electronic Journal of Plant Breeding, 6(3): 680-687 (Sep 2015) ISSN 0975-928X http://ejplantbreeding.com 686 Table 5. The cluster-wise mean values for sucking pest incidence in F6 cotton progenies Table 6. The cluster-wise mean values for fibre parameters in cotton progenies Cluster Aphids incidence (no) Jassids incidence (no) Thrips incidence (no) White Fly incidence (no) 1 Cluster 20.93 5.86 0.19 0.57 2 Cluster 23.00 5.55 0.00 0.56 3 Cluster 19.65 7.05 0.42 0.51 4 Cluster 30.56 5.34 0.00 1.00 5 Cluster 30.33 7.66 0.00 0.33 6 Cluster 39.45 7.67 0.00 0.89 7 Cluster 10.22 5.55 0.00 0.78 8 Cluster 19.89 4.56 1.00 0.22 9 Cluster 9.55 6.44 0.00 0.55 10 Cluster 31.00 9.67 0.00 0.78 11 Cluster 21.11 4.22 0.33 1.45 12 Cluster 17.00 8.78 0.22 1.11 13 Cluster 38.34 8.56 0.11 0.66 14 Cluster 33.67 6.78 0.00 1.00 Cluster 2.5 % Span Length (mm) Fibre Strength (g/Tex) Micronaire (µg/Inch) Elongation (%) SFI (%) 1 Cluster 29.09 22.26 4.06 4.89 7.74 2 Cluster 26.80 22.20 3.70 5.20 10.90 3 Cluster 27.69 21.39 3.99 4.87 10.73 4 Cluster 31.00 22.60 4.00 4.70 5.90 5 Cluster 31.40 23.20 4.70 4.93 5.00 6 Cluster 28.40 23.60 3.40 5.30 8.70 7 Cluster 32.80 24.30 2.80 5.70 6.80 8 Cluster 31.10 24.90 3.60 4.60 6.70 9 Cluster 31.80 21.90 3.30 4.70 7.00 10 Cluster 32.20 24.40 3.90 6.40 6.60 11 Cluster 34.20 25.30 3.30 6.00 4.30 12 Cluster 24.30 18.90 3.70 5.30 5.30 13 Cluster 24.50 20.40 5.30 4.90 5.40 14 Cluster 25.30 20.50 4.20 4.90 14.30
- 8. Electronic Journal of Plant Breeding, 6(3): 680-687 (Sep 2015) ISSN 0975-928X http://ejplantbreeding.com 687 Figure 1.Dendrogram showing clustering of 47 F6 cotton progenies using Mahalanobis D2 statistics.