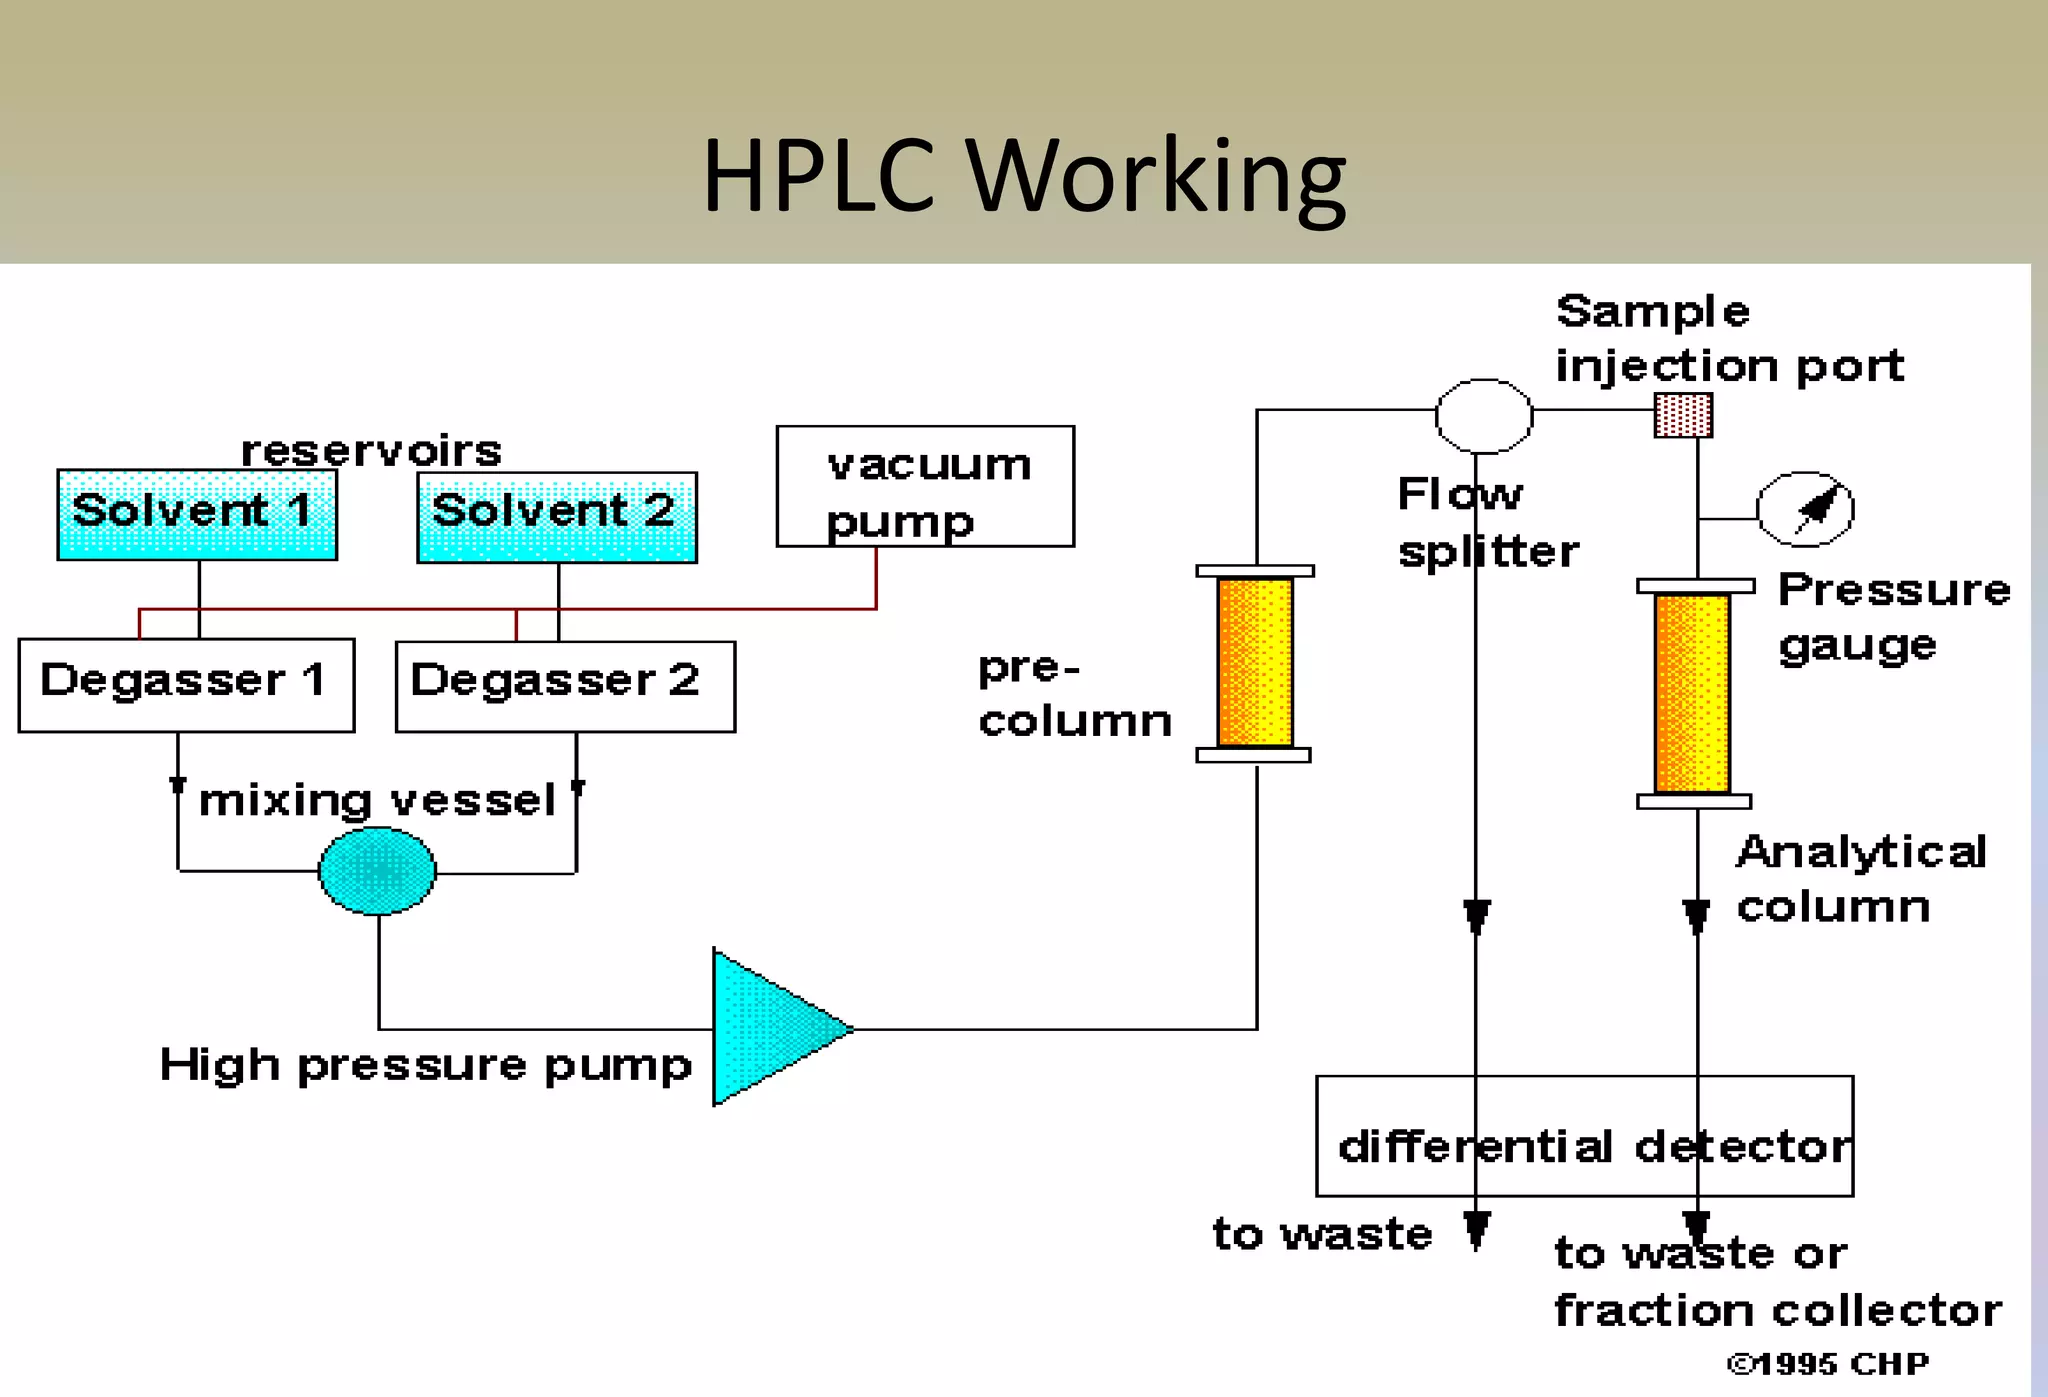
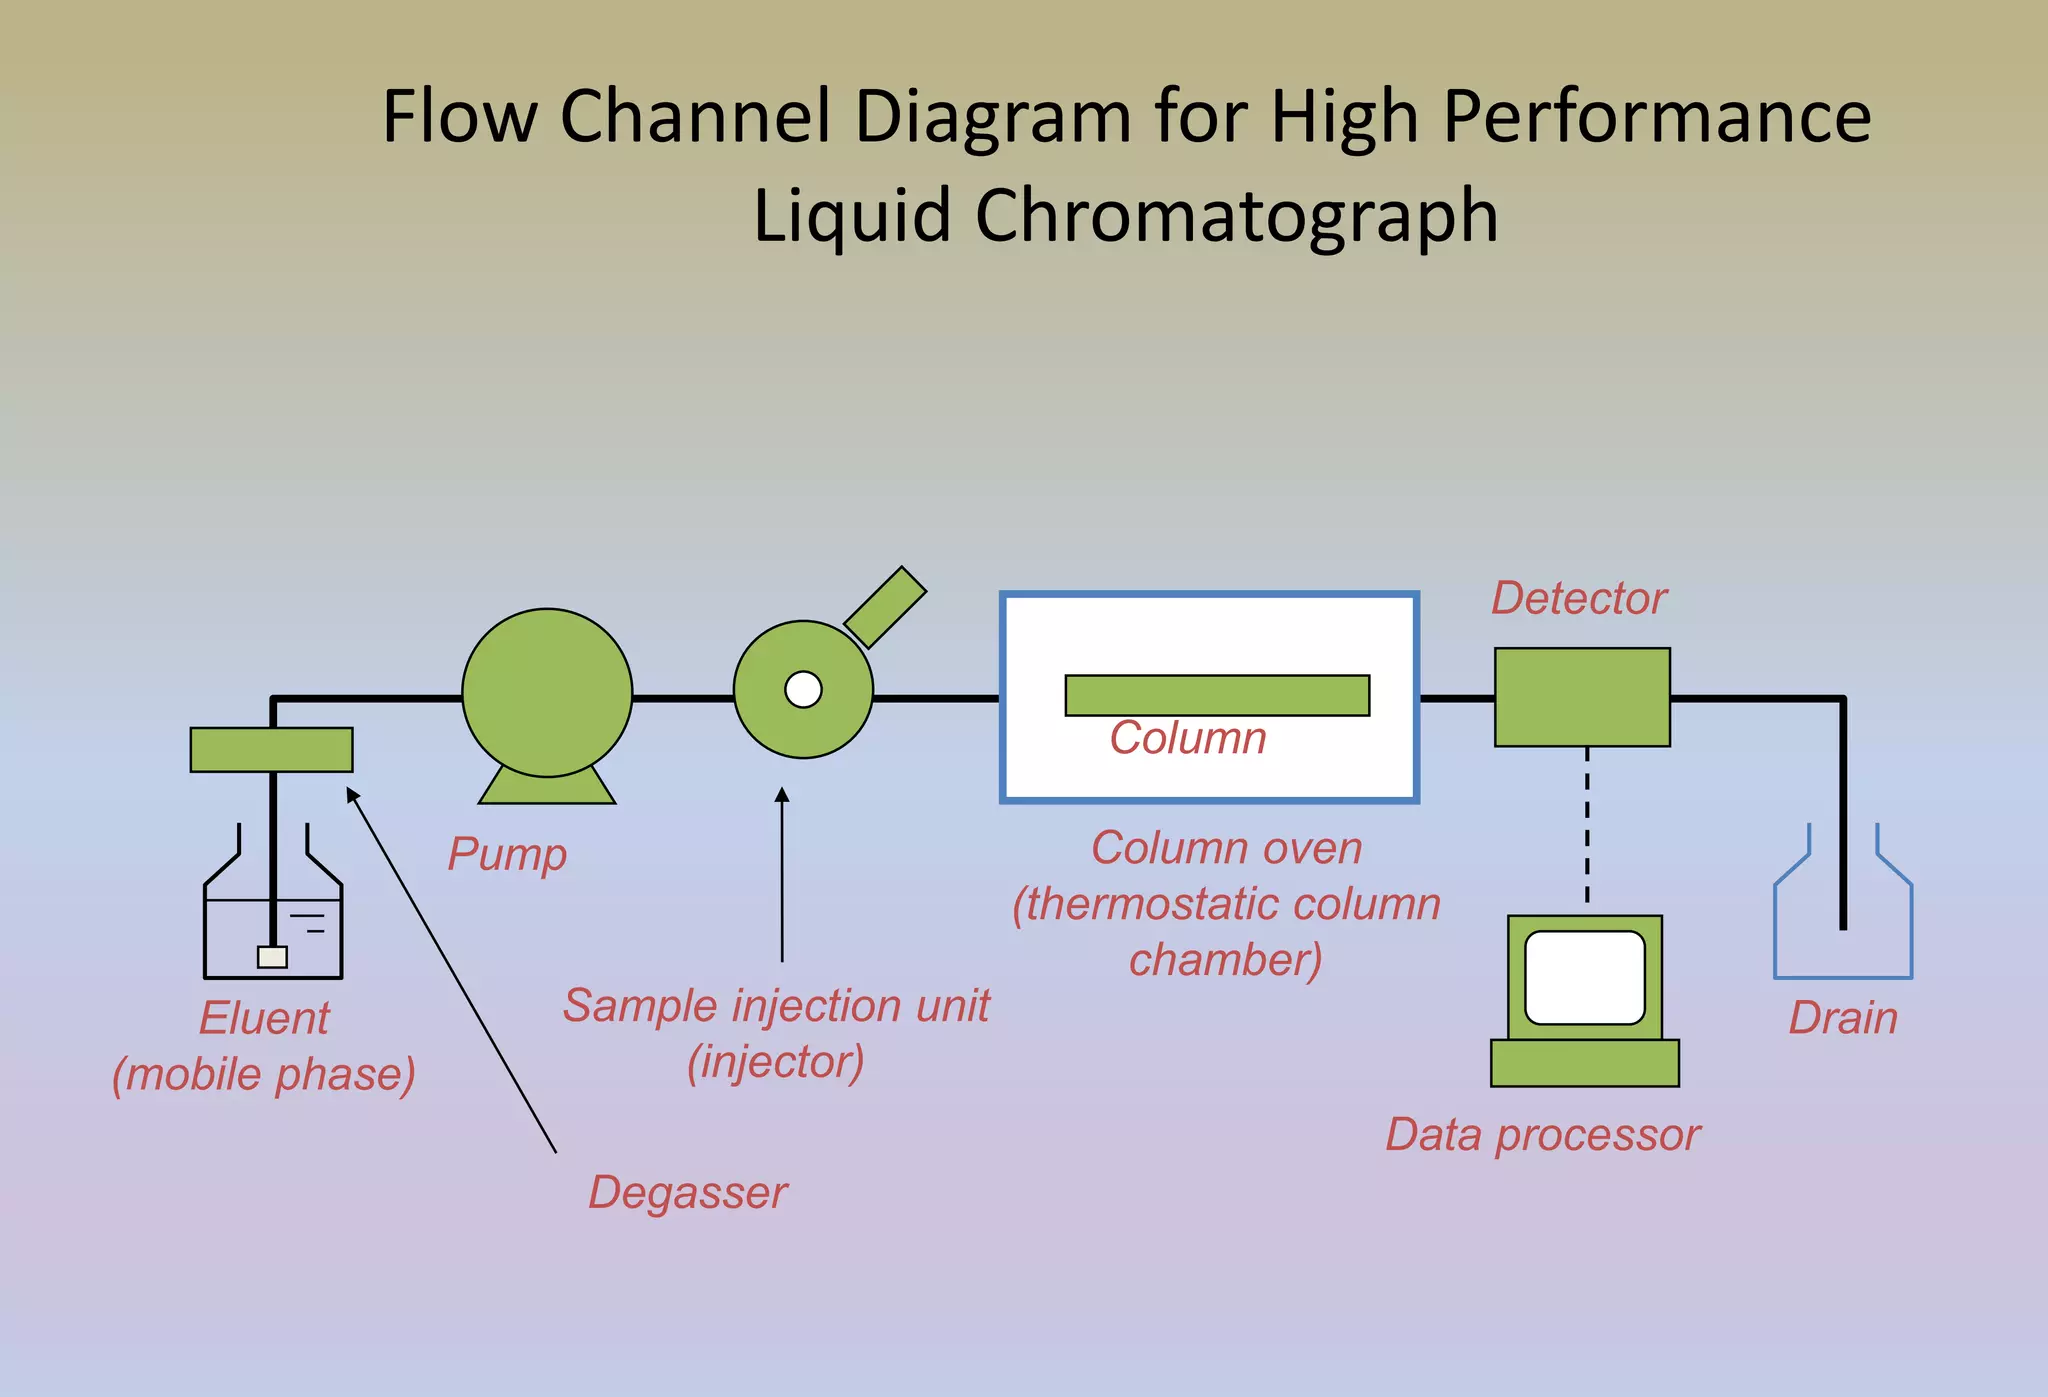
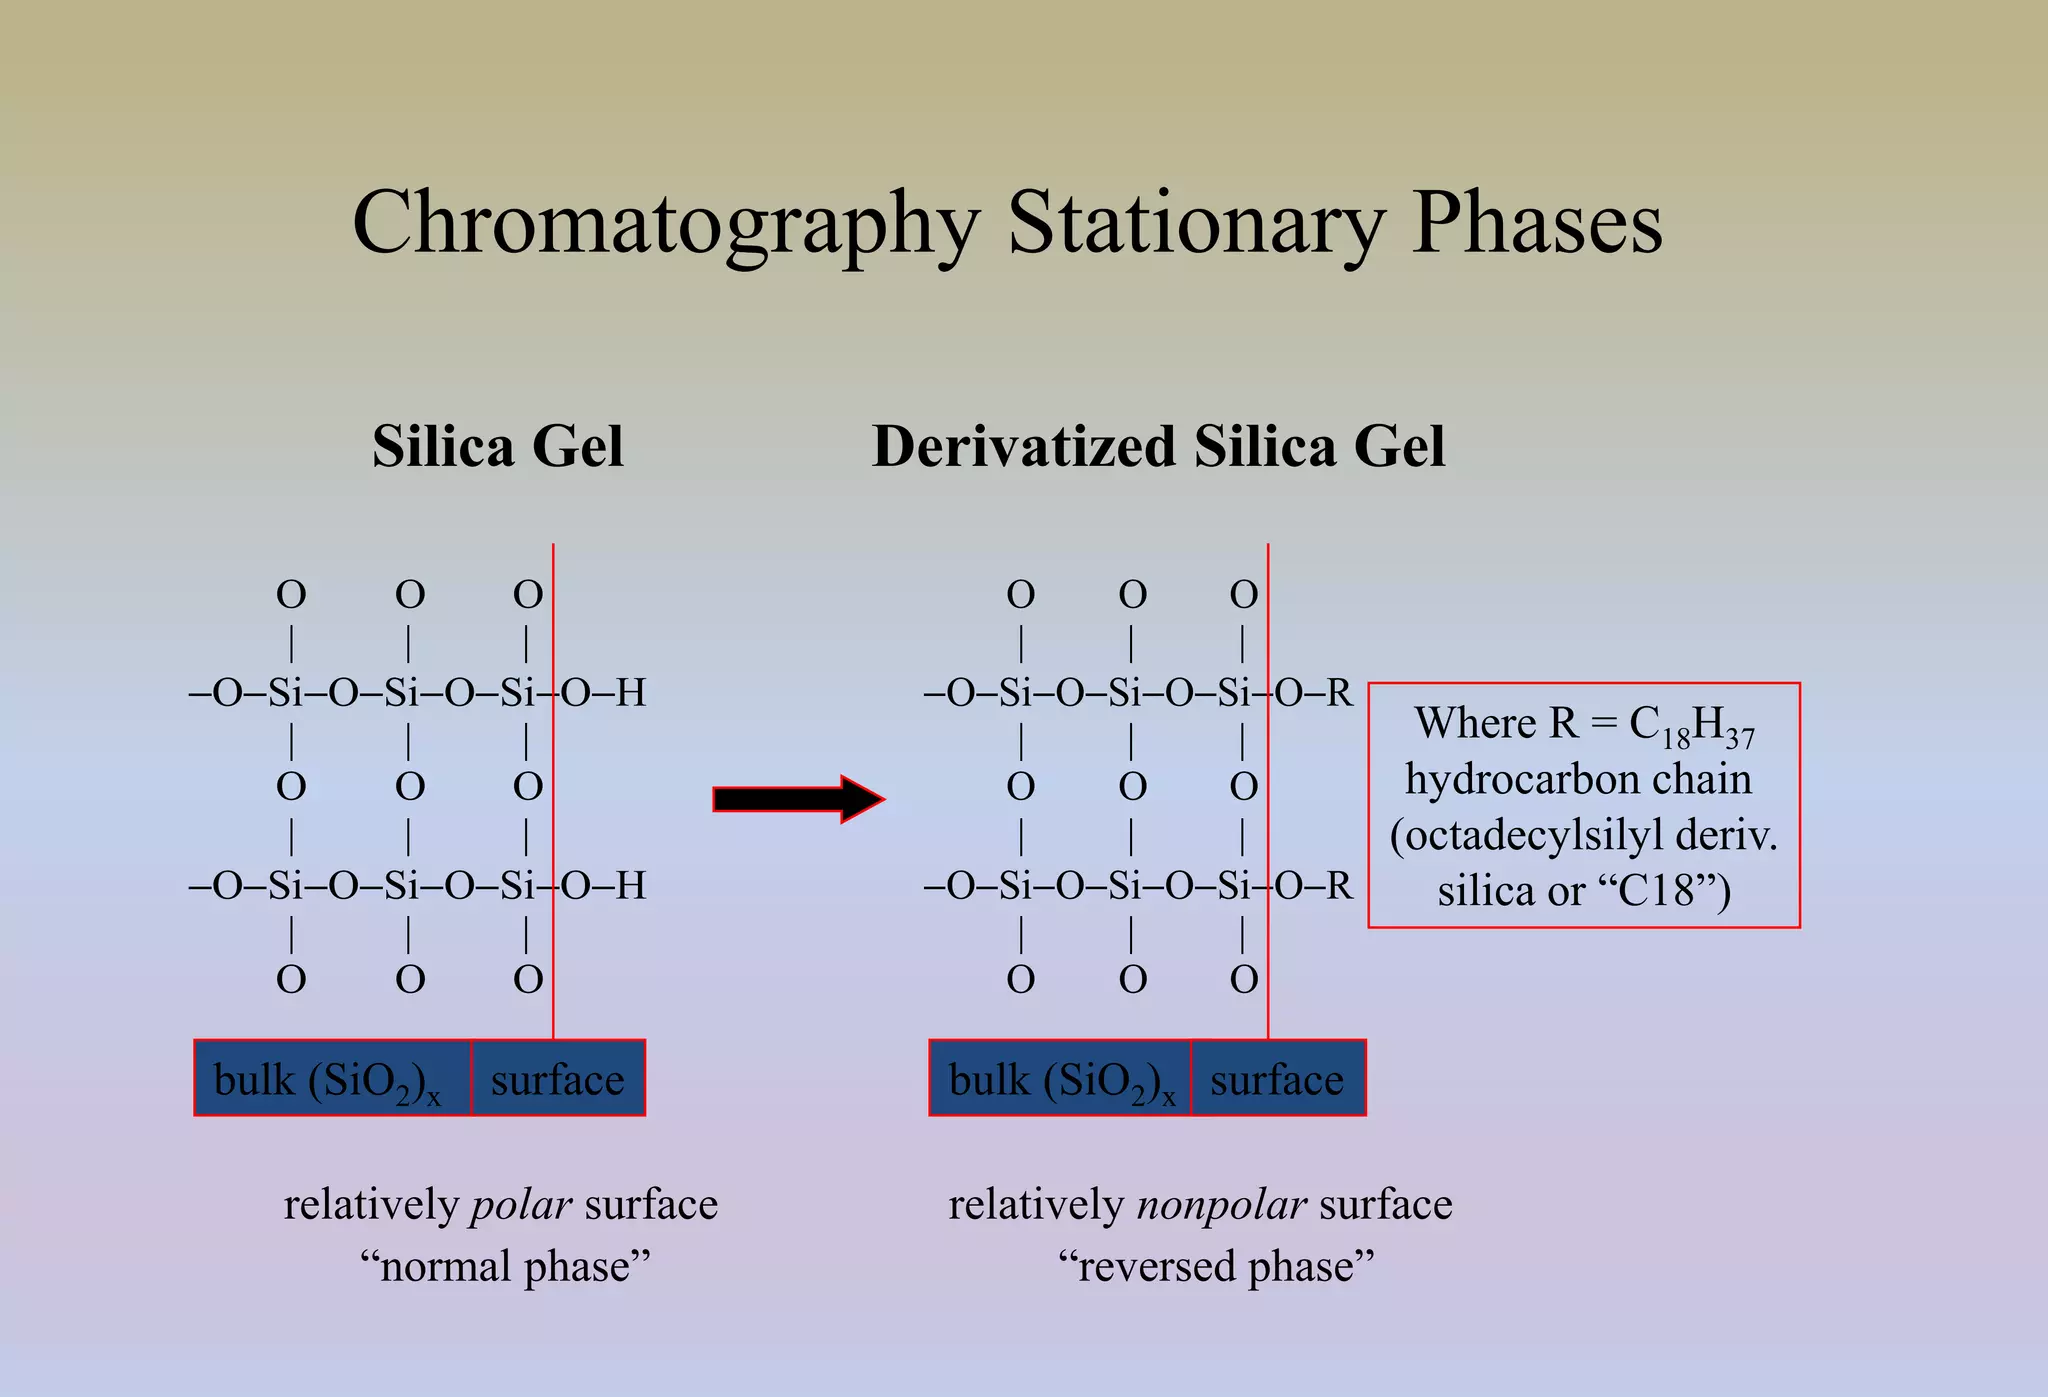
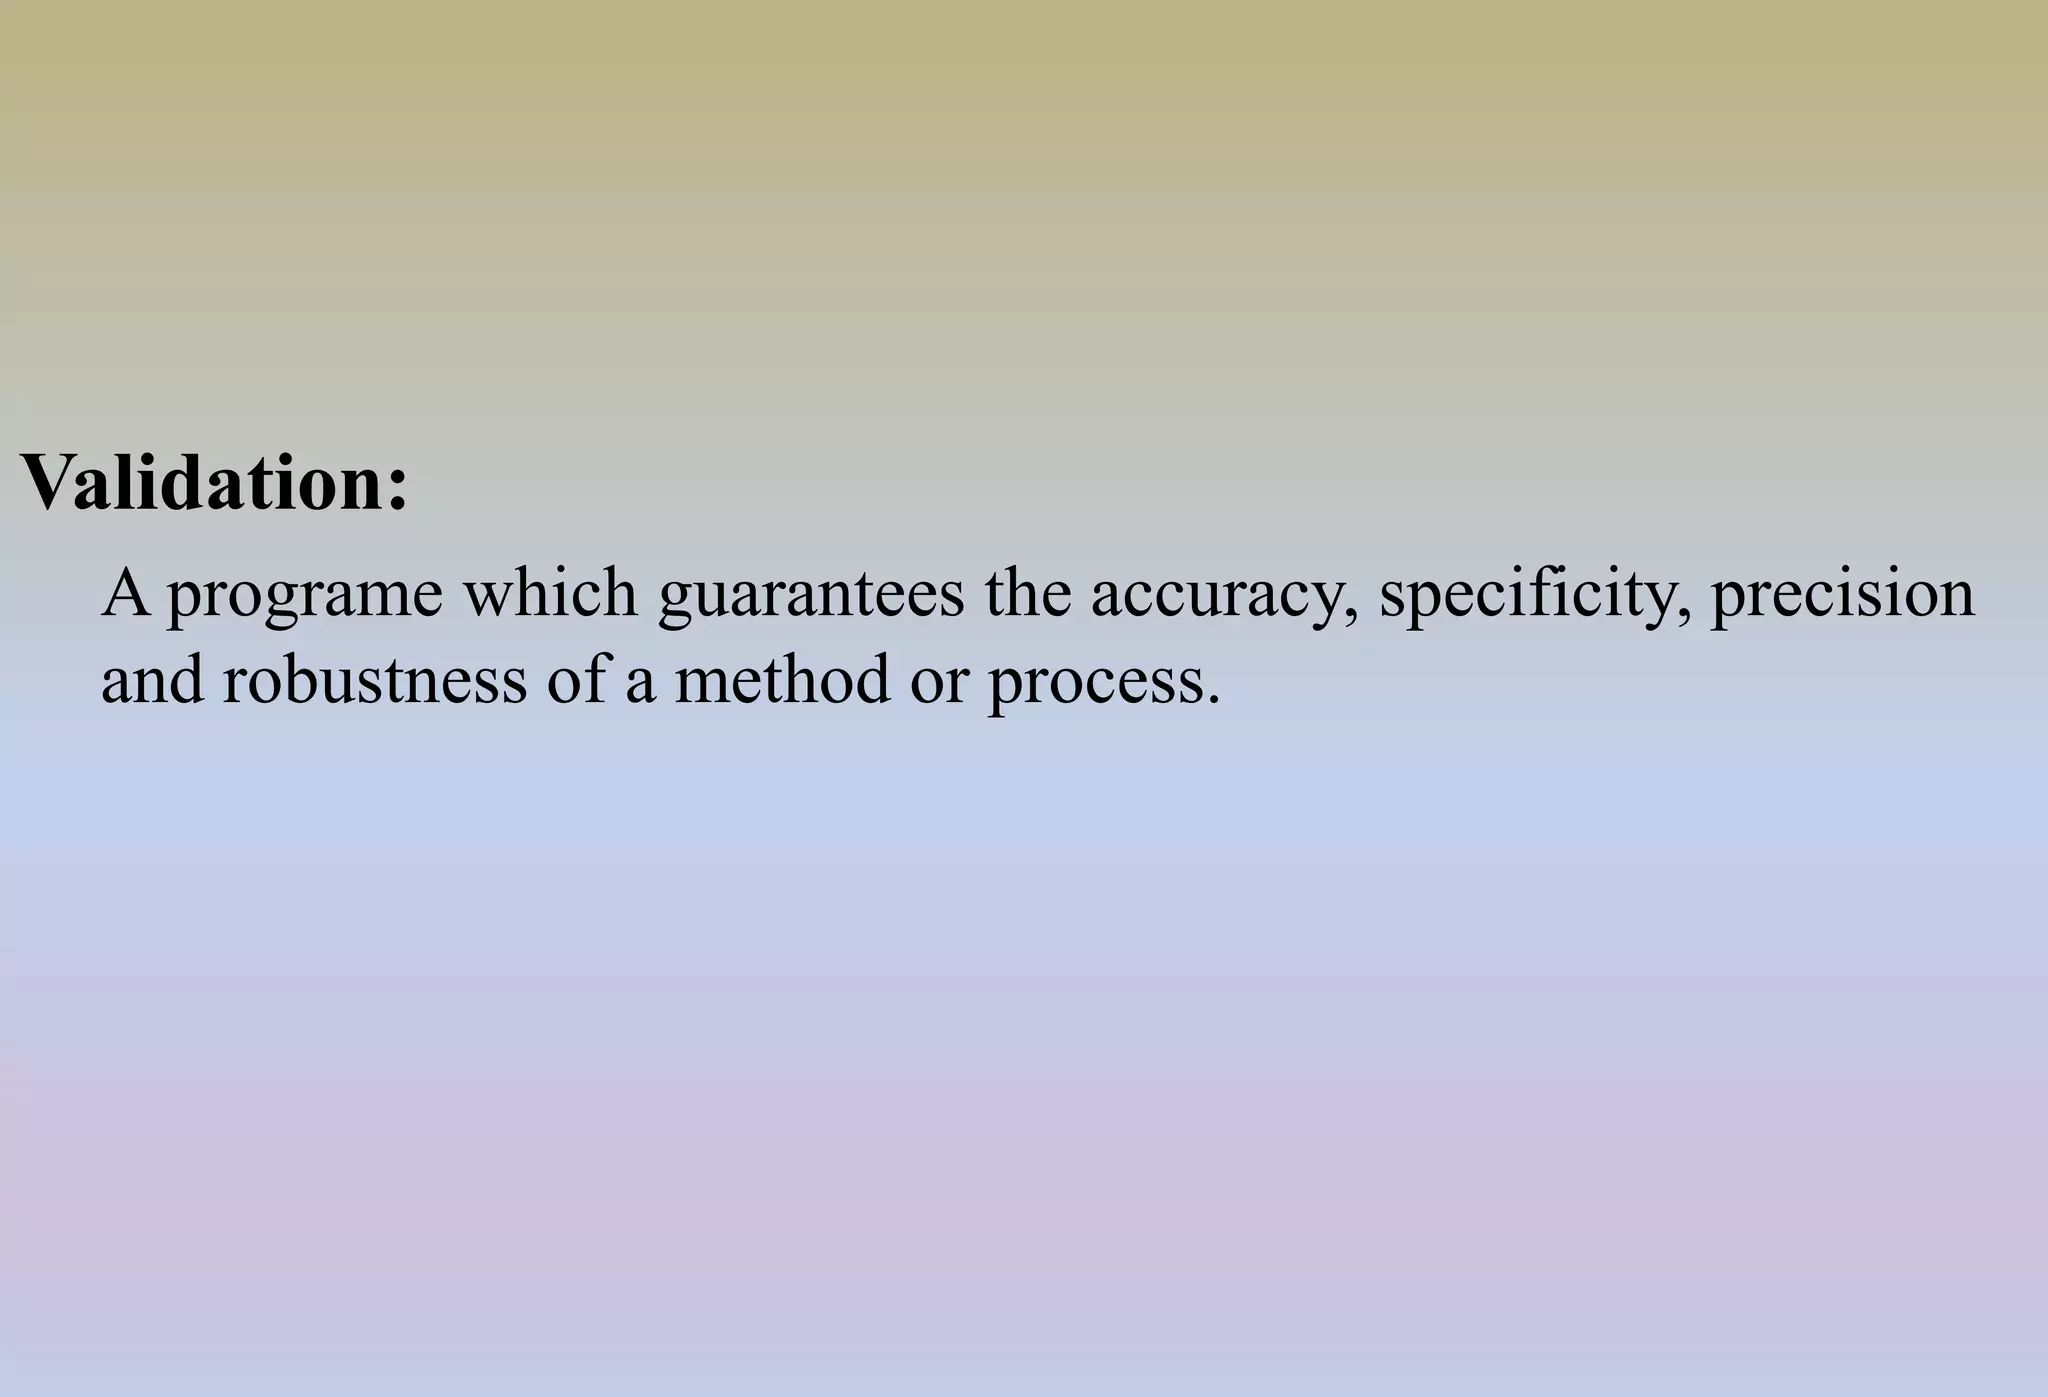
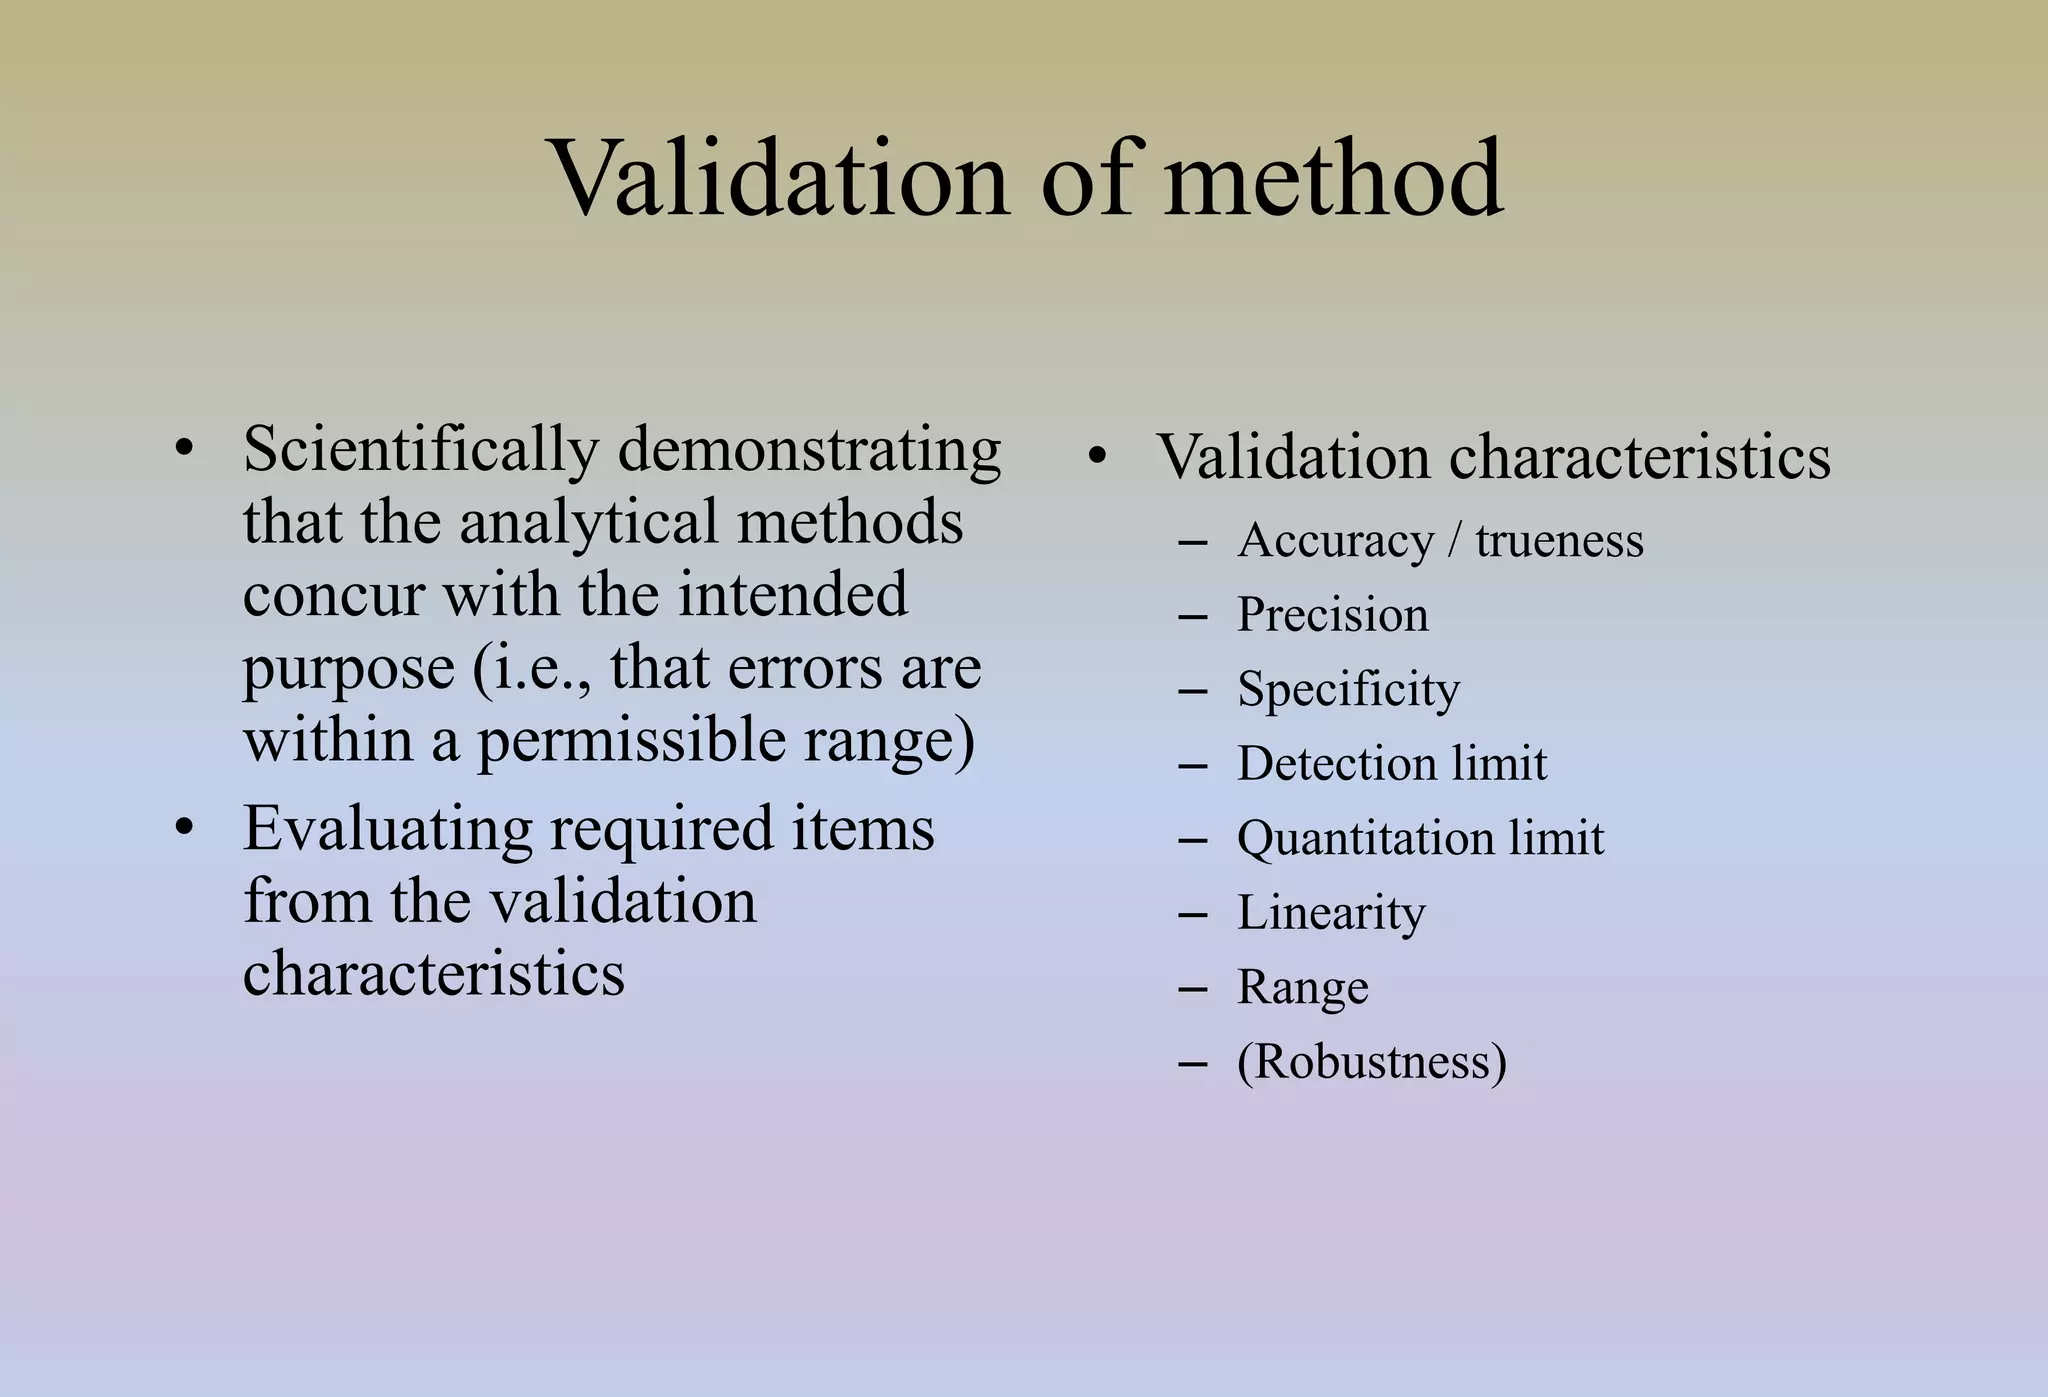
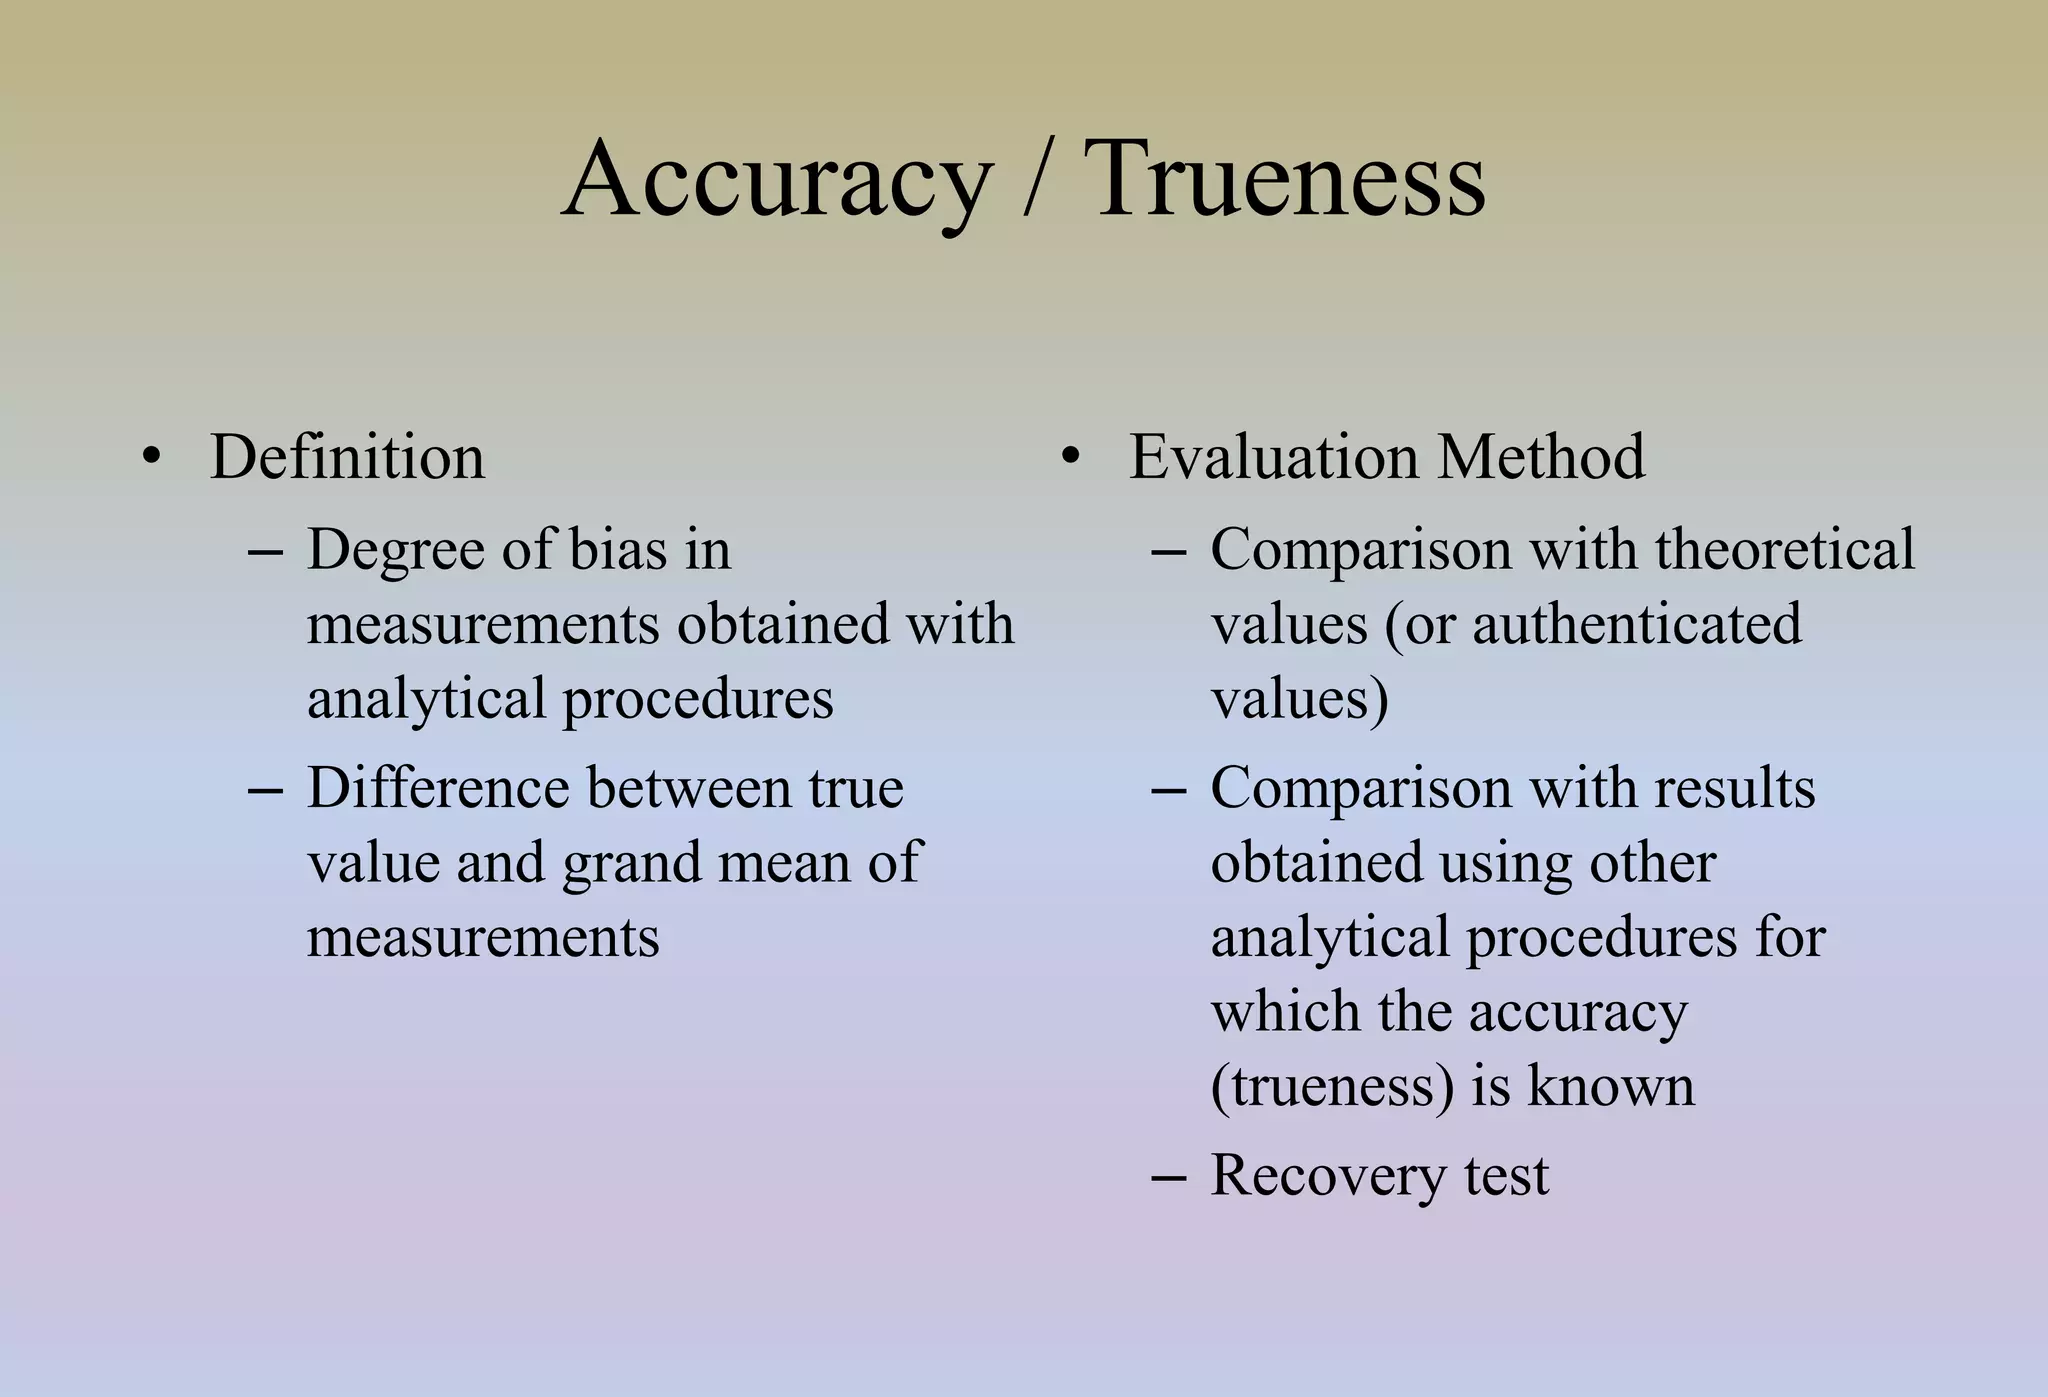
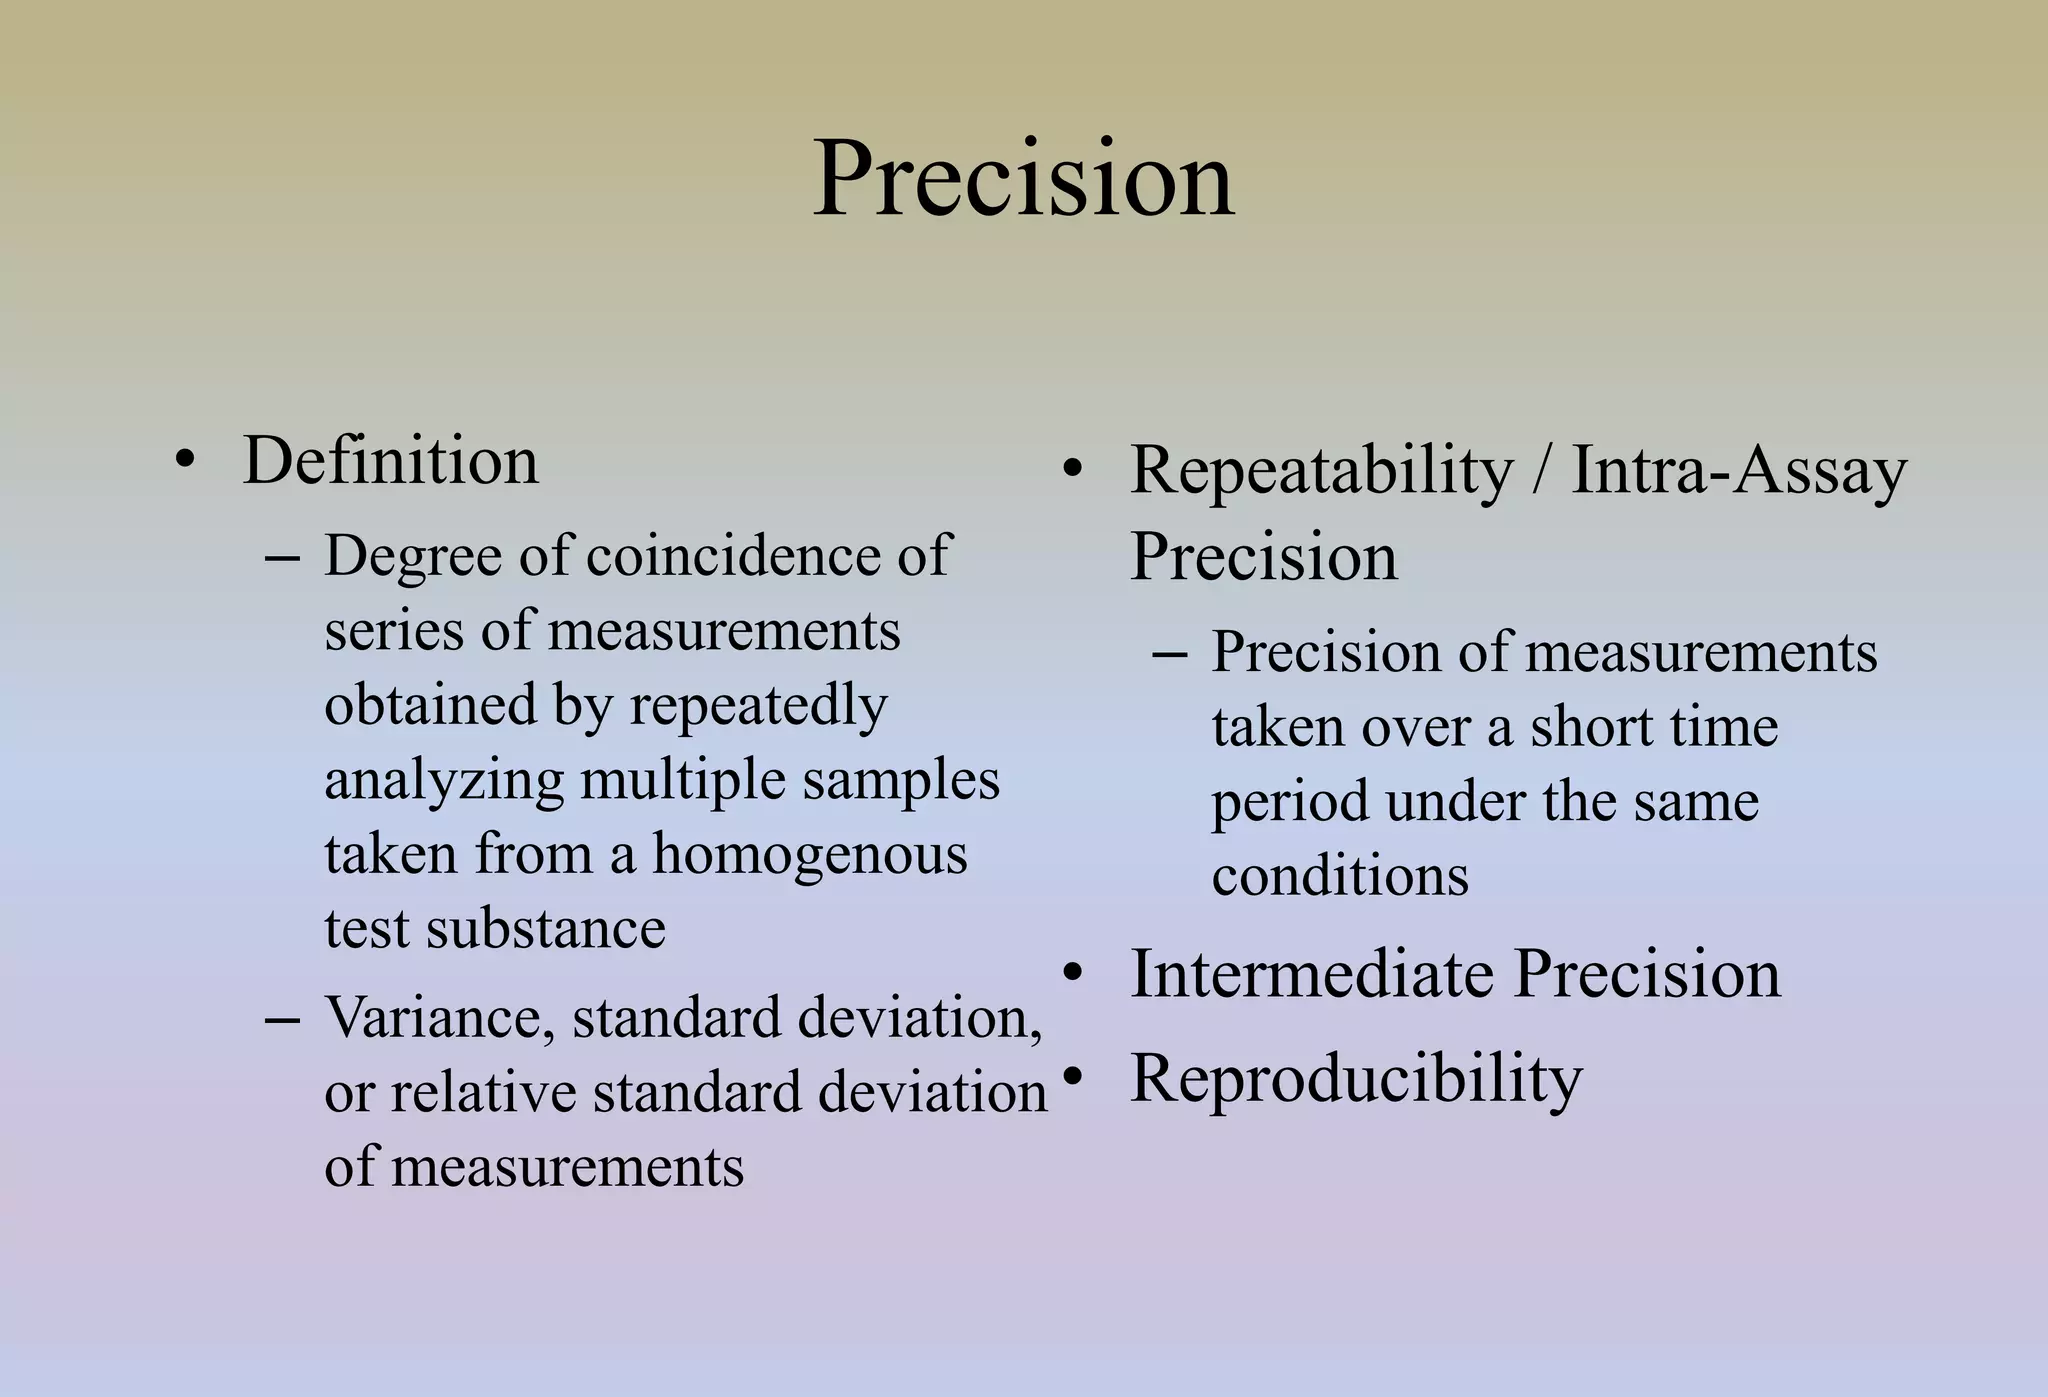
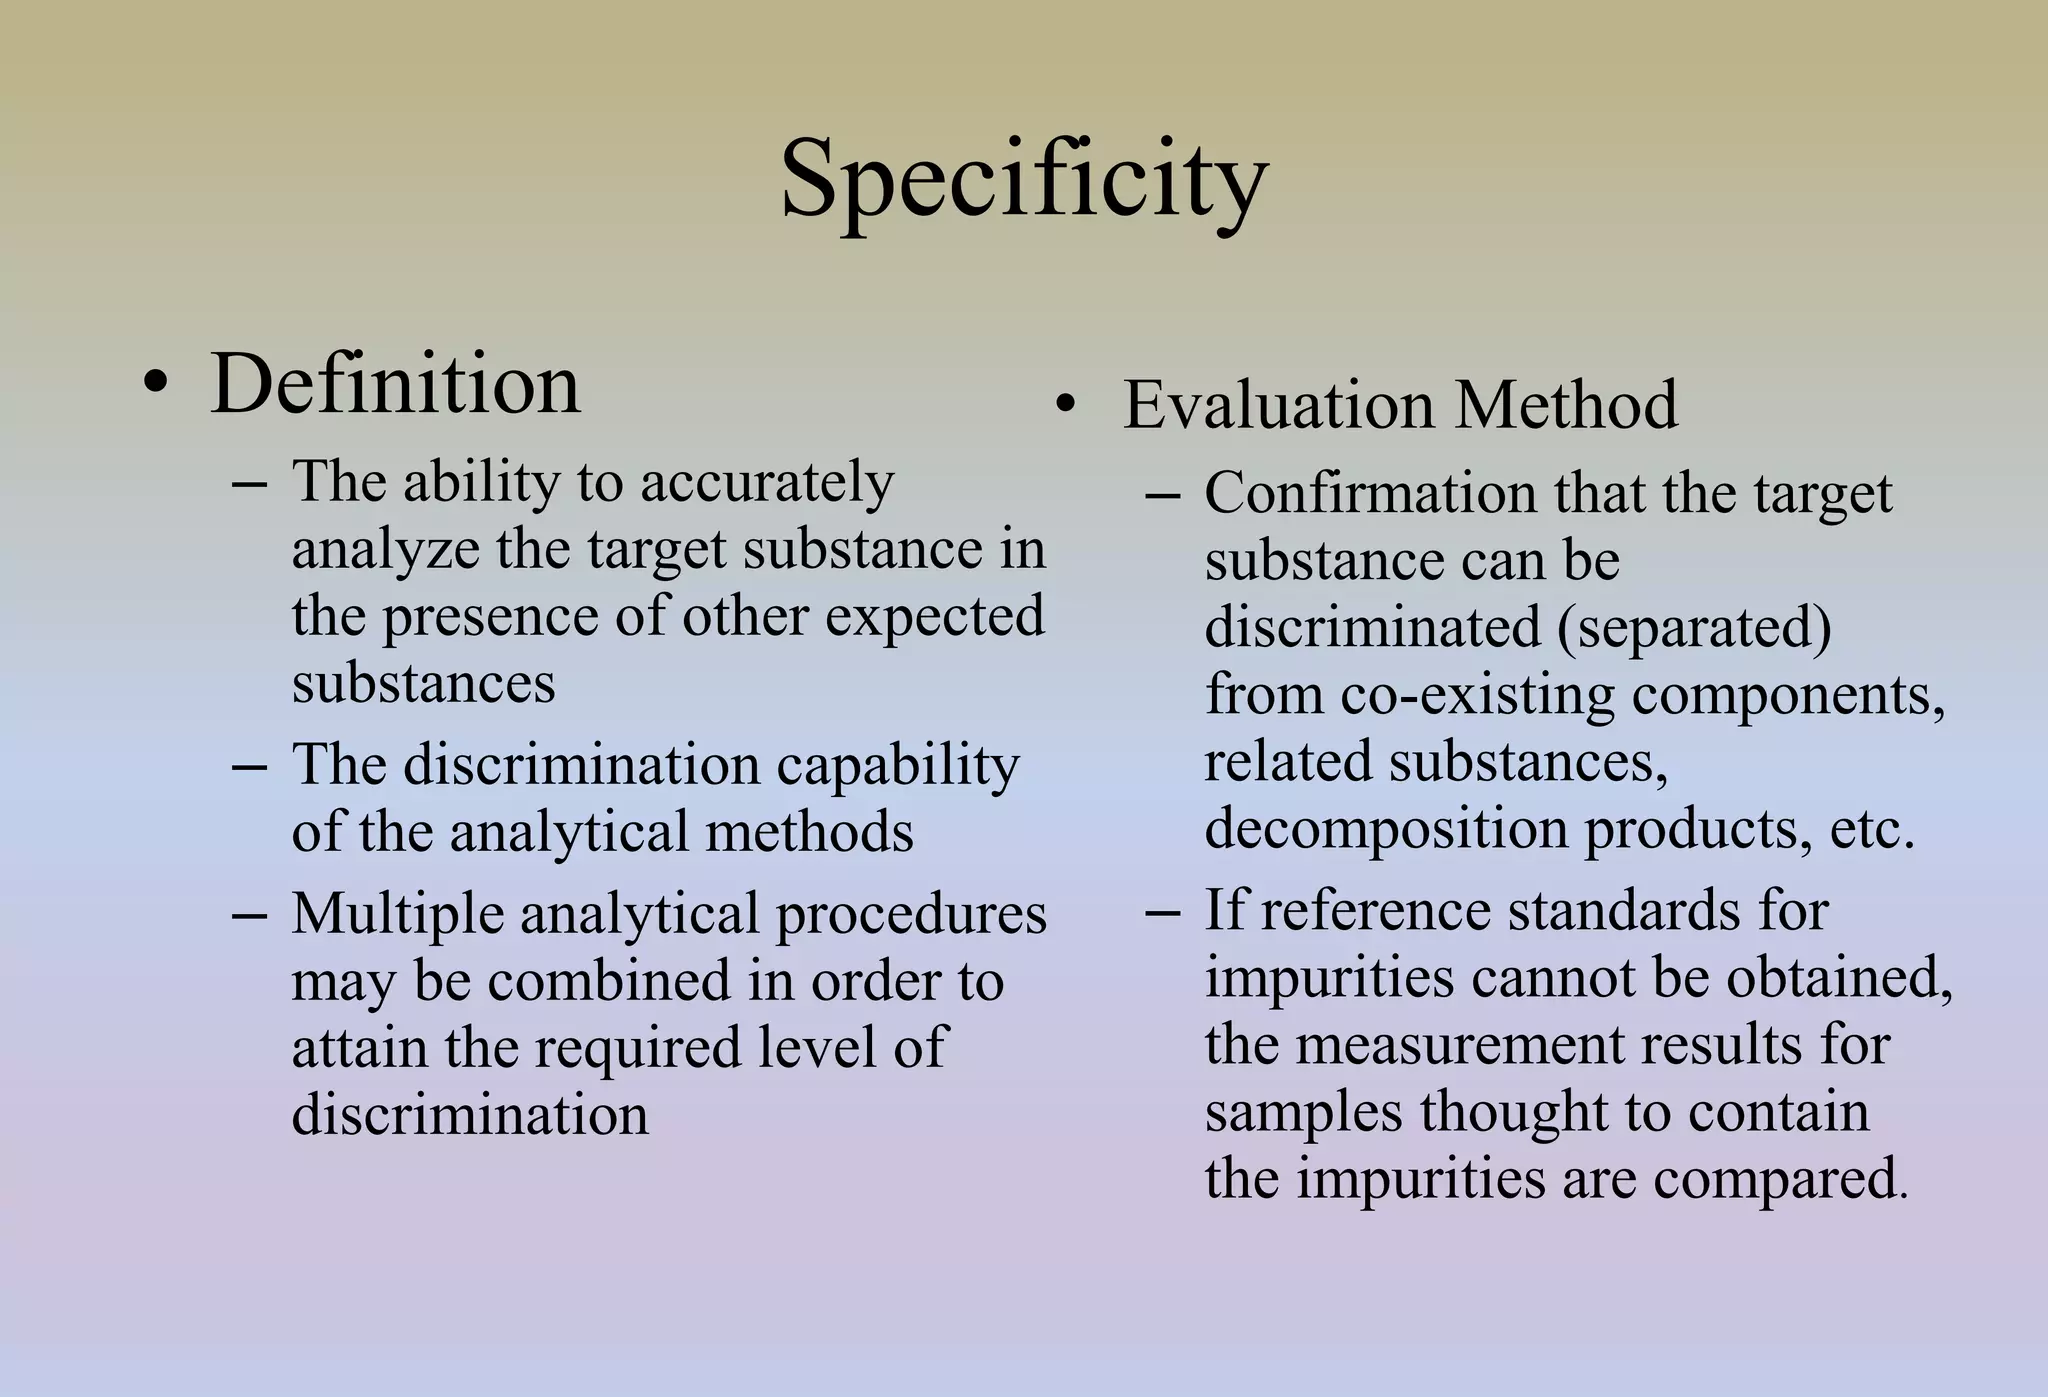
HPLC
Ahsan Saqi
The Islamia University of Bahawalpur
High Performance Liquid Chromatography
HPLC is characterized by the use of high pressure to
push a mobile phase solution through a column of
stationary phase allowing separation of complex
mixtures with high resolution
Chromato-graphy / -graph / -gram / -grapher
• Chromatography: Analytical technique
• Chromatograph: Instrument
• Chromatogram: Obtained “picture”
• Chromatographer: Person
Absorption:
In chromatography, absorption signifies the process by which a solute
partitions into a liquid-like stationary phase.
Adsorption:
The process by which a chemical entity is accumulated on a surface.
Mobile Phase:
The eluate moving through the column. In gas chromatography (GC)
this will be a gas, and in liquid chromatography (LC) a liquid.
Stationary Phase:
The substance that remains in one place in the column. In GC this will
be a liquid of high-viscosity, which clings to the inner walls of the
column; in LC it will be some sort of packing, either solid or gel-based.
Capillary Column:
A column whose inner diameter is under 0.5 mm.
Eluate:
The mobile phase exiting a column.
Eluent:
The mobile phase entering a column.
Elution:
The passage of the mobile phase through the
column to transport solutes
Partition Chromatography:
A type of chromatography based on a thin film formed on the
surface of a solid support by a liquid stationary phase. Solute
equilibrates between the mobile phase and the stationary liquid.
Flow Rate:
The amount of mobile phase that has passed through the column
per unit time. The units are milliliters per second (mL/sec) or,
more commonly, milliliters per minute (mL/min).
Solute:
The term for the sample components being analyzed.
HPLC System
Solvent
Delivery System
Variable
UV/Vis Detector
HPLC Solvent
Reservoirs
HPLC
Column
Injector
Detector Computer
Workstation
Keep an eye on
these 4 screens!
Solvent Delivery System
Injector
%A %B %C Flow Rate Pressure
{H2O} {MeOH} (mL/min) (atmos.)
Ready
Ternary Pump
A
C
B
from solvent
reservoir
Column
to
detector
to column
through
pulse
dampener
to injector
through pump
load
inject
UV/Visble Detector
ABS Flow rate l RunTime EndTime
0.001 2.000 238 0.00 min 10.0 min
Ready
HPLC Working
Pump
Sample injection unit
(injector)
Column
Column oven
(thermostatic column
chamber)
Detector
Eluent
(mobile phase)
Drain
Data processor
Degasser
Flow Channel Diagram for High Performance
Liquid Chromatograph
Picture of an HPLC column
HPLC Column
• Material
– Stainless steel (SUS)
– PEEK (polyether ether
ketone)
– Fluororesin
• O.D. (outer diameter)
– 1.6 mm
• I.D. (inner diameter)
– 0.1 mm
– 0.3 mm
– 0.5 mm
– 0.8 mm etc.
Column Storage
• Storage Solution
– It is generally safe to use
the same storage solution
as used at shipment.
– In order to prevent
putrefaction, alcohol or
some other preservative
substance may be added.
• Storage Conditions
– Insert an airtight stopper in the
column end.
– Never allow the packing
material to dry.
– Make a record of the storage
solution and final usage
conditions and store it together
with the column.
– Store the column in a location
not subject to shocks or sudden
temperature changes.
WHAT will AFFECTS the SYSTEM?
Column
Parameters
• Column Material
• Deactivation
• Stationary Phase
• Coating Material
Instrument
Parameters
• Temperature
• Flow
• Signal
• Sample Sensitivity
• Detector
Sample
Parameters
• Concentration
• Matrix
• Solvent Effect
• Sample Effect
HPLC Chromatogram
tR
t0
Intensityofdetectorsignal
Time
Peak
tR : Retention time
h
A
t0 : Non-retention time
A : Peak area
h : Peak height
HPLC Chromatograms
Rt = 3.0 min.
faster moving
less retained
Rt = 5.2 min.
slower moving
more retained
0 1 2 3 4 5 6 7
Time (minutes)
Absorbance
Approximation
of peak area by
triangulation
Area =
base x height
2
base
height
Peak A Peak B
Normal phase
• In this column type, the retention is governed
by the interaction of the polar parts of the
stationary phase and solute. For retention to
occur in normal phase, the packing must be
more polar than the mobile phase with respect
to the sample
Reverse phase
• In this column the packing material is relatively
nonpolar and the solvent is polar with respect to the
sample. Retention is the result of the interaction of
the nonpolar components of the solutes and the
nonpolar stationary phase. Typical stationary phases
are nonpolar hydrocarbons, waxy liquids, or bonded
hydrocarbons (such as C18, C8, etc.) and the solvents
are polar aqueous-organic mixtures such as methanol-
water or acetonitrile-water.
Normal vs. Reversed Phase Chromatography
Normal Phase Reversed Phase
Stationary phase Polar (silica gel) Non-polar (C18)
Mobile phase
Non-polar
(organic solvents)
Polar
(aqueous/organic)
Sample movement Non-polar fastest Polar fastest
Separation based on
Different polarities
(functionality)
Different
hydrocarbon content
Chromatography Stationary Phases
relatively polar surface
O O O
| | |
OSiOSiOSiOH
| | |
O O O
| | |
OSiOSiOSiOH
| | |
O O O
bulk (SiO2)x surface
relatively nonpolar surface
Silica Gel
O O O
| | |
OSiOSiOSiOR
| | |
O O O
| | |
OSiOSiOSiOR
| | |
O O O
bulk (SiO2)x surface
Derivatized Silica Gel
Where R = C18H37
hydrocarbon chain
(octadecylsilyl deriv.
silica or “C18”)
“normal phase” “reversed phase”
Validation:
A programe which guarantees the accuracy, specificity, precision
and robustness of a method or process.
Validation of method
• Scientifically demonstrating
that the analytical methods
concur with the intended
purpose (i.e., that errors are
within a permissible range)
• Evaluating required items
from the validation
characteristics
• Validation characteristics
– Accuracy / trueness
– Precision
– Specificity
– Detection limit
– Quantitation limit
– Linearity
– Range
– (Robustness)
Accuracy / Trueness
• Definition
– Degree of bias in
measurements obtained with
analytical procedures
– Difference between true
value and grand mean of
measurements
• Evaluation Method
– Comparison with theoretical
values (or authenticated
values)
– Comparison with results
obtained using other
analytical procedures for
which the accuracy
(trueness) is known
– Recovery test
Precision
• Definition
– Degree of coincidence of
series of measurements
obtained by repeatedly
analyzing multiple samples
taken from a homogenous
test substance
– Variance, standard deviation,
or relative standard deviation
of measurements
• Repeatability / Intra-Assay
Precision
– Precision of measurements
taken over a short time
period under the same
conditions
• Intermediate Precision
• Reproducibility
Specificity
• Definition
– The ability to accurately
analyze the target substance in
the presence of other expected
substances
– The discrimination capability
of the analytical methods
– Multiple analytical procedures
may be combined in order to
attain the required level of
discrimination
• Evaluation Method
– Confirmation that the target
substance can be
discriminated (separated)
from co-existing components,
related substances,
decomposition products, etc.
– If reference standards for
impurities cannot be obtained,
the measurement results for
samples thought to contain
the impurities are compared.
Detection Limit
• Definition
– The minimum quantity of a
target substance that can be
detected.
– Quantitation is not
absolutely necessary.
• Evaluation Method
– Calculated from the standard
deviation of measurements
and the slope of the
calibration curve.
• DL = 3.3 /slope
(: Standard deviation of
measurements)
(Slope: Slope of calibration
curve)
– Calculated from the signal-
to-noise ratio.
• Concentration for which S/N =
3 or 2
Quantitation Limit
• Definition
– The minimum quantity of a
target substance that can be
quantified
– Quantitation with an
appropriate level of
accuracy and precision
must be possible. (In
general, the relative
standard deviation must not
exceed 10%.)
• Evaluation Method
– Calculated from the standard
deviation of measurements and
the slope of the calibration curve.
• QL = 10 /slope
(: Standard deviation of
measurements)
(Slope: Slope of calibration curve)
– Calculated from the signal-to-
noise ratio.
• Concentration for which S/N = 10
Linearity
• Definition
– The ability of the analytical
method to produce
measurements for the
quantity of a target
substance that satisfy a
linear relationship.
– Values produced by
converting quantities or
measurements of the target
substance using a precisely
defined formula may be
used.
• Evaluation Method
– Samples containing different
quantities of the target
substance (usually 5
concentrations) are analyzed
repeatedly, and regression
equations and correlation
coefficients are obtained.
– Residuals obtained from the
regression equations of the
measurements are plotted,
and it is confirmed that there
is no specific slope.
Range
• Definition
– The region between the
lower and upper limits of the
quantity of a target
substance that gives
appropriate levels of
accuracy and precision
• Evaluation Method
– The accuracy, precision, and
linearity are investigated for
samples containing
quantities of a target
substance that correspond to
the lower limit, upper limit,
and approximate center of
the range.
Robustness
• Definition
– The ability of an analytical
procedure to remain
unaffected by small
changes in analytical
conditions.
• Evaluation Method
– Some or all of the variable
factors (i.e., the analytical
conditions) are changed
and the effects are
evaluated.
Advantages of methods validation:
There are a number of very good reasons why
analytical methods are validated. First, the laboratory
conducting the tests will have an increased output with
fewer reductions in rejections of the results. The
method is therefore cost effective and avoids additional
capital expenditure on other equipment and reduced
testing of the finished goods e.g. a batch of drugs.

Hplc

  • 1.
    HPLC Ahsan Saqi The IslamiaUniversity of Bahawalpur
  • 2.
    High Performance LiquidChromatography HPLC is characterized by the use of high pressure to push a mobile phase solution through a column of stationary phase allowing separation of complex mixtures with high resolution
  • 3.
    Chromato-graphy / -graph/ -gram / -grapher • Chromatography: Analytical technique • Chromatograph: Instrument • Chromatogram: Obtained “picture” • Chromatographer: Person
  • 4.
    Absorption: In chromatography, absorptionsignifies the process by which a solute partitions into a liquid-like stationary phase. Adsorption: The process by which a chemical entity is accumulated on a surface. Mobile Phase: The eluate moving through the column. In gas chromatography (GC) this will be a gas, and in liquid chromatography (LC) a liquid. Stationary Phase: The substance that remains in one place in the column. In GC this will be a liquid of high-viscosity, which clings to the inner walls of the column; in LC it will be some sort of packing, either solid or gel-based.
  • 5.
    Capillary Column: A columnwhose inner diameter is under 0.5 mm. Eluate: The mobile phase exiting a column. Eluent: The mobile phase entering a column. Elution: The passage of the mobile phase through the column to transport solutes
  • 6.
    Partition Chromatography: A typeof chromatography based on a thin film formed on the surface of a solid support by a liquid stationary phase. Solute equilibrates between the mobile phase and the stationary liquid. Flow Rate: The amount of mobile phase that has passed through the column per unit time. The units are milliliters per second (mL/sec) or, more commonly, milliliters per minute (mL/min). Solute: The term for the sample components being analyzed.
  • 8.
    HPLC System Solvent Delivery System Variable UV/VisDetector HPLC Solvent Reservoirs HPLC Column Injector Detector Computer Workstation Keep an eye on these 4 screens!
  • 9.
  • 10.
    Solvent Delivery System Injector %A%B %C Flow Rate Pressure {H2O} {MeOH} (mL/min) (atmos.) Ready Ternary Pump A C B from solvent reservoir Column to detector to column through pulse dampener to injector through pump load inject
  • 11.
    UV/Visble Detector ABS Flowrate l RunTime EndTime 0.001 2.000 238 0.00 min 10.0 min Ready
  • 12.
  • 13.
    Pump Sample injection unit (injector) Column Columnoven (thermostatic column chamber) Detector Eluent (mobile phase) Drain Data processor Degasser Flow Channel Diagram for High Performance Liquid Chromatograph
  • 14.
    Picture of anHPLC column
  • 15.
    HPLC Column • Material –Stainless steel (SUS) – PEEK (polyether ether ketone) – Fluororesin • O.D. (outer diameter) – 1.6 mm • I.D. (inner diameter) – 0.1 mm – 0.3 mm – 0.5 mm – 0.8 mm etc.
  • 16.
    Column Storage • StorageSolution – It is generally safe to use the same storage solution as used at shipment. – In order to prevent putrefaction, alcohol or some other preservative substance may be added. • Storage Conditions – Insert an airtight stopper in the column end. – Never allow the packing material to dry. – Make a record of the storage solution and final usage conditions and store it together with the column. – Store the column in a location not subject to shocks or sudden temperature changes.
  • 17.
    WHAT will AFFECTSthe SYSTEM? Column Parameters • Column Material • Deactivation • Stationary Phase • Coating Material Instrument Parameters • Temperature • Flow • Signal • Sample Sensitivity • Detector Sample Parameters • Concentration • Matrix • Solvent Effect • Sample Effect
  • 19.
    HPLC Chromatogram tR t0 Intensityofdetectorsignal Time Peak tR :Retention time h A t0 : Non-retention time A : Peak area h : Peak height
  • 20.
    HPLC Chromatograms Rt =3.0 min. faster moving less retained Rt = 5.2 min. slower moving more retained 0 1 2 3 4 5 6 7 Time (minutes) Absorbance Approximation of peak area by triangulation Area = base x height 2 base height Peak A Peak B
  • 21.
    Normal phase • Inthis column type, the retention is governed by the interaction of the polar parts of the stationary phase and solute. For retention to occur in normal phase, the packing must be more polar than the mobile phase with respect to the sample
  • 22.
    Reverse phase • Inthis column the packing material is relatively nonpolar and the solvent is polar with respect to the sample. Retention is the result of the interaction of the nonpolar components of the solutes and the nonpolar stationary phase. Typical stationary phases are nonpolar hydrocarbons, waxy liquids, or bonded hydrocarbons (such as C18, C8, etc.) and the solvents are polar aqueous-organic mixtures such as methanol- water or acetonitrile-water.
  • 23.
    Normal vs. ReversedPhase Chromatography Normal Phase Reversed Phase Stationary phase Polar (silica gel) Non-polar (C18) Mobile phase Non-polar (organic solvents) Polar (aqueous/organic) Sample movement Non-polar fastest Polar fastest Separation based on Different polarities (functionality) Different hydrocarbon content
  • 24.
    Chromatography Stationary Phases relativelypolar surface O O O | | | OSiOSiOSiOH | | | O O O | | | OSiOSiOSiOH | | | O O O bulk (SiO2)x surface relatively nonpolar surface Silica Gel O O O | | | OSiOSiOSiOR | | | O O O | | | OSiOSiOSiOR | | | O O O bulk (SiO2)x surface Derivatized Silica Gel Where R = C18H37 hydrocarbon chain (octadecylsilyl deriv. silica or “C18”) “normal phase” “reversed phase”
  • 26.
    Validation: A programe whichguarantees the accuracy, specificity, precision and robustness of a method or process.
  • 27.
    Validation of method •Scientifically demonstrating that the analytical methods concur with the intended purpose (i.e., that errors are within a permissible range) • Evaluating required items from the validation characteristics • Validation characteristics – Accuracy / trueness – Precision – Specificity – Detection limit – Quantitation limit – Linearity – Range – (Robustness)
  • 28.
    Accuracy / Trueness •Definition – Degree of bias in measurements obtained with analytical procedures – Difference between true value and grand mean of measurements • Evaluation Method – Comparison with theoretical values (or authenticated values) – Comparison with results obtained using other analytical procedures for which the accuracy (trueness) is known – Recovery test
  • 29.
    Precision • Definition – Degreeof coincidence of series of measurements obtained by repeatedly analyzing multiple samples taken from a homogenous test substance – Variance, standard deviation, or relative standard deviation of measurements • Repeatability / Intra-Assay Precision – Precision of measurements taken over a short time period under the same conditions • Intermediate Precision • Reproducibility
  • 30.
    Specificity • Definition – Theability to accurately analyze the target substance in the presence of other expected substances – The discrimination capability of the analytical methods – Multiple analytical procedures may be combined in order to attain the required level of discrimination • Evaluation Method – Confirmation that the target substance can be discriminated (separated) from co-existing components, related substances, decomposition products, etc. – If reference standards for impurities cannot be obtained, the measurement results for samples thought to contain the impurities are compared.
  • 31.
    Detection Limit • Definition –The minimum quantity of a target substance that can be detected. – Quantitation is not absolutely necessary. • Evaluation Method – Calculated from the standard deviation of measurements and the slope of the calibration curve. • DL = 3.3 /slope (: Standard deviation of measurements) (Slope: Slope of calibration curve) – Calculated from the signal- to-noise ratio. • Concentration for which S/N = 3 or 2
  • 32.
    Quantitation Limit • Definition –The minimum quantity of a target substance that can be quantified – Quantitation with an appropriate level of accuracy and precision must be possible. (In general, the relative standard deviation must not exceed 10%.) • Evaluation Method – Calculated from the standard deviation of measurements and the slope of the calibration curve. • QL = 10 /slope (: Standard deviation of measurements) (Slope: Slope of calibration curve) – Calculated from the signal-to- noise ratio. • Concentration for which S/N = 10
  • 33.
    Linearity • Definition – Theability of the analytical method to produce measurements for the quantity of a target substance that satisfy a linear relationship. – Values produced by converting quantities or measurements of the target substance using a precisely defined formula may be used. • Evaluation Method – Samples containing different quantities of the target substance (usually 5 concentrations) are analyzed repeatedly, and regression equations and correlation coefficients are obtained. – Residuals obtained from the regression equations of the measurements are plotted, and it is confirmed that there is no specific slope.
  • 34.
    Range • Definition – Theregion between the lower and upper limits of the quantity of a target substance that gives appropriate levels of accuracy and precision • Evaluation Method – The accuracy, precision, and linearity are investigated for samples containing quantities of a target substance that correspond to the lower limit, upper limit, and approximate center of the range.
  • 35.
    Robustness • Definition – Theability of an analytical procedure to remain unaffected by small changes in analytical conditions. • Evaluation Method – Some or all of the variable factors (i.e., the analytical conditions) are changed and the effects are evaluated.
  • 36.
    Advantages of methodsvalidation: There are a number of very good reasons why analytical methods are validated. First, the laboratory conducting the tests will have an increased output with fewer reductions in rejections of the results. The method is therefore cost effective and avoids additional capital expenditure on other equipment and reduced testing of the finished goods e.g. a batch of drugs.