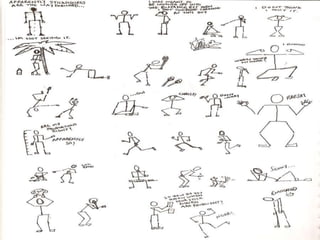
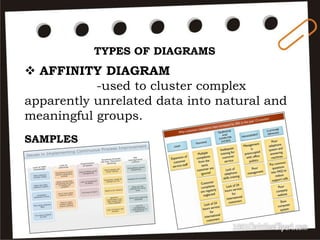
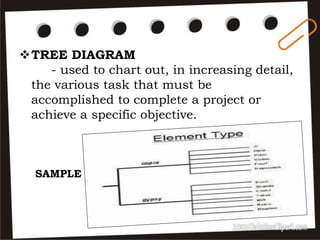
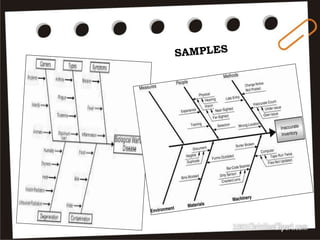
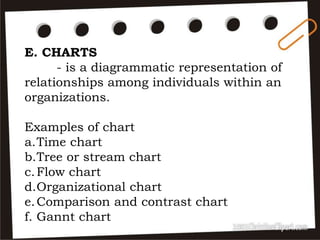
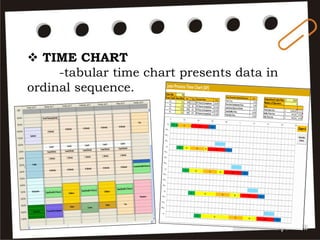
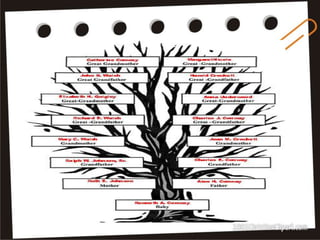
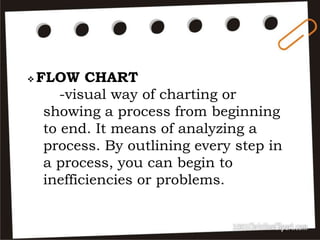
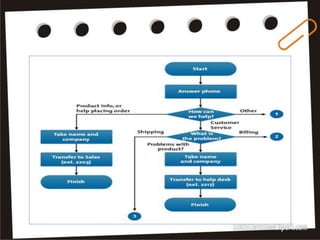
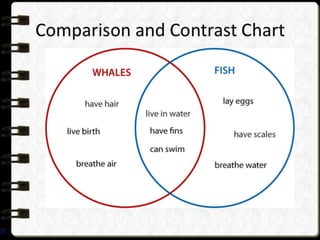
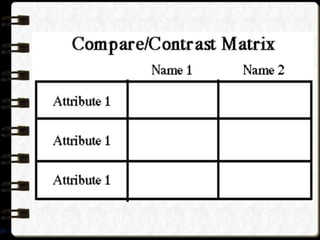
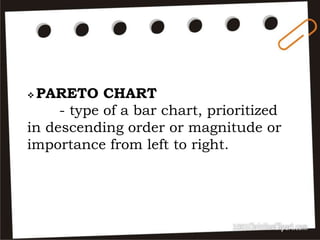
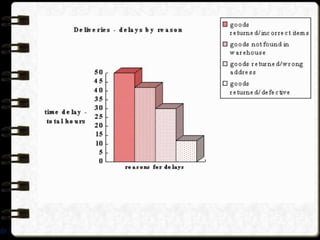
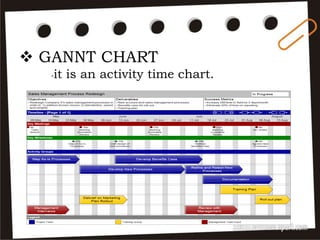
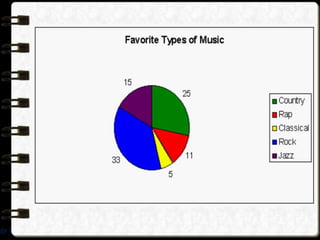
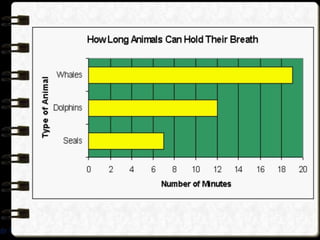
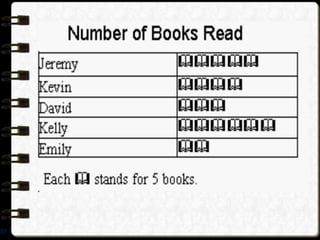
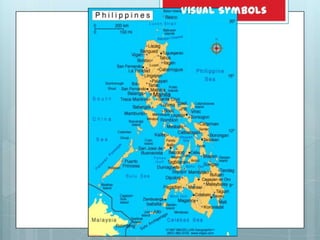
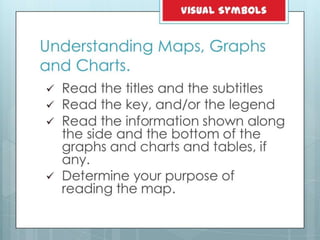
Visual symbols include drawings, cartoons, diagrams, charts, graphs, and maps. They are more clearly understood than text alone. Drawings, cartoons, and strip drawings can be used to motivate students or illustrate concepts. Diagrams show relationships and include affinity, tree, and fishbone diagrams. Charts organize information and include time charts, flow charts, organizational charts, and Pareto charts. Graphs depict quantitative data visually, through pie graphs, bar graphs, and picture graphs. Maps show spatial relationships and include physical, relief, economic, and political maps. Visual symbols convey information more effectively than text alone.


![satya[1] (1)](https://cdn.slidesharecdn.com/ss_thumbnails/0e7983af-bf1a-41c2-b9a6-cad0981e51eb-150830025449-lva1-app6891-thumbnail.jpg?width=640&height=640&fit=bounds)


