1. Daily Technical Outlook
2nd February 2012
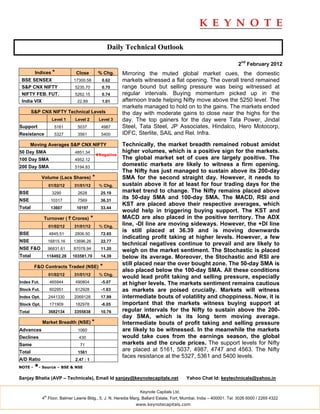
Indices * Close % Chg. Mirroring the muted global market cues, the domestic
BSE SENSEX 17300.58 0.62 markets witnessed a flat opening. The overall trend remained
S&P CNX NIFTY 5235.70 0.70 range bound but selling pressure was being witnessed at
NIFTY FEB. FUT. 5262.15 0.74 regular intervals. Buying momentum picked up in the
India VIX 22.89 1.01 afternoon trade helping Nifty move above the 5250 level. The
markets managed to hold on to the gains. The markets ended
S&P CNX NIFTY Technical Levels the day with moderate gains to close near the highs for the
Level 1 Level 2 Level 3 day. The top gainers for the day were Tata Power, Jindal
Support 5161 5037 4987 Steel, Tata Steel, JP Associates, Hindalco, Hero Motocorp,
Resistance 5327 3561 5400 IDFC, Sterlite, SAIL and Rel. Infra.
Moving Averages S&P CNX NIFTY Technically, the market breadth remained robust amidst
50 Day SMA 4851.34 higher volumes, which is a positive sign for the markets.
◄Negative
100 Day SMA 4952.12 The global market set of cues are largely positive. The
200 Day SMA 5194.83
domestic markets are likely to witness a firm opening.
The Nifty has just managed to sustain above its 200-day
Volume (Lacs Shares) * SMA for the second straight day. However, it needs to
01/02/12 31/01/12 % Chg. sustain above it for at least for four trading days for the
BSE 3290 2628 25.19 market trend to change. The Nifty remains placed above
NSE 10317 7569 36.31
its 50-day SMA and 100-day SMA. The MACD, RSI and
KST are placed above their respective averages, which
Total 13607 10197 33.44
would help in triggering buying support. The KST and
Turnover ( ` Crores) * MACD are also placed in the positive territory. The ADX
01/02/12 31/01/12 % Chg.
line, -DI line are moving sideways. However, the +DI line
is still placed at 36.39 and is moving downwards
BSE 4845.51 2806.50 72.65
indicating profit taking at higher levels. However, a few
NSE 16815.16 13696.26 22.77
technical negatives continue to prevail and are likely to
NSE F&O 96831.61 87078.94 11.20 weigh on the market sentiment. The Stochastic is placed
Total 118492.28 103581.70 14.39 below its average. Moreover, the Stochastic and RSI are
still placed near the over bought zone. The 50-day SMA is
F&O Contracts Traded (NSE) *
also placed below the 100-day SMA. All these conditions
01/02/12 31/01/12 % Chg.
would lead profit taking and selling pressure, especially
Index Fut. 465944 490804 -5.07 at higher levels. The markets sentiment remains cautious
Stock Fut. 602951 612928 -1.63 as markets are poised crucially. Markets will witness
Index Opt. 2441330 2069128 17.99 intermediate bouts of volatility and choppiness. Now, it is
Stock Opt. 171909 182978 -6.05 important that the markets witness buying support at
Total 3682134 3355838 10.76 regular intervals for the Nifty to sustain above the 200-
day SMA, which is its long term moving average.
Market Breadth (NSE) * Intermediate bouts of profit taking and selling pressure
Advances 1060 are likely to be witnessed. In the meanwhile the markets
Declines 430 would take cues from the earnings season, the global
Same 71 markets and the crude prices. The support levels for Nifty
Total 1561
are placed at 5161, 5037, 4987, 4747 and 4563. The Nifty
faces resistance at the 5327, 5361 and 5400 levels.
A/D Ratio 2.47 : 1
NOTE - *- Source – BSE & NSE
Sanjay Bhatia (AVP – Technicals), Email Id sanjay@keynotecapitals.net Yahoo Chat Id: keytechnicals@yahoo.in
Keynote Capitals Ltd.
th
4 Floor, Balmer Lawrie Bldg., 5, J. N. Heredia Marg, Ballard Estate, Fort, Mumbai, India – 400001. Tel: 3026 6000 / 2269 4322
www.keynotecapitals.com
2. Short Term Trading Ideas Based On Technical Analysis (5 - 7 Days)
Stop
Initiation Stop Loss Target
Stock Close Action Price Loss * (%) Target (%) Remarks
Allahabad Bank 164.20 Buy Above 165.00 160.90 2.48 175 6.06
Bhushan Steel 360.00 Buy Above 362.00 353.90 2.24 380 4.97
Bombay Dying 426.60 Buy Above 430.00 414.25 3.66 465 8.14
Godrej Inds. 206.50 Buy Above 207.00 203.40 1.74 215 3.86
* Stop Losses are to be considered strictly on Closing basis.
Intra-day Resistance Intra-day Support
Indices Close Pivot Point R1 R2 R3 S1 S2 S3
BSE SENSEX 17301 17230 17398 17495 17761 17132 16964 16698
S&P CNX NIFTY 5236 5213 5267 5299 5384 5182 5128 5042
NIFTY FEB. FUT. 5262 5237 5296 5330 5423 5203 5144 5051
Keynote Capitals Ltd.
th
4 Floor, Balmer Lawrie Bldg., 5, J. N. Heredia Marg, Ballard Estate, Fort, Mumbai, India – 400001. Tel: 3026 6000 / 2269 4322
www.keynotecapitals.com
3. Disclaimer
This document is not for public distribution and has been furnished to you solely for your information and must not be
reproduced or redistributed to any other person. Persons into whose possession this document may come are
required to observe these restrictions.
This material is for the personal information of the authorized recipient, and we are not soliciting any action based
upon it. This report is not to be construed as an offer to sell or the solicitation of an offer to buy any security in any
jurisdiction where such an offer or solicitation would be illegal. It is for the general information of clients of Keynote
Capitals Ltd. It does not constitute a personal recommendation or take into account the particular investment
objectives, financial situations, or needs of individual clients.
We have reviewed the report, and in so far as it includes current or historical information, it is believed to be reliable
though its accuracy or completeness cannot be guaranteed. Neither Keynote Capitals Ltd., nor any person connected
with it, accepts any liability arising from the use of this document. The recipients of this material should rely on their
own investigations and take their own professional advice. Price and value of the investments referred to in this
material may go up or down. Past performance is not a guide for future performance. Certain transactions -including
those involving futures, options and other derivatives as well as non-investment grade securities - involve substantial
risk and are not suitable for all investors. Reports based on technical analysis centers on studying charts of a stock’s
price movement and trading volume, as opposed to focusing on a company’s fundamentals and as such, may not
match with a report on a company’s fundamentals.
Opinions expressed are our current opinions as of the date appearing on this material only. While we endeavor to
update on a reasonable basis the information discussed in this material, there may be regulatory, compliance, or
other reasons that prevent us from doing so. Prospective investors and others are cautioned that any forward-looking
statements are not predictions and may be subject to change without notice. Our proprietary trading and investment
businesses may make investment decisions that are inconsistent with the recommendations expressed herein.
We and our affiliates, officers, directors, and employees world wide may: (a) from time to time, have long or short
positions in, and buy or sell the securities thereof, of company (ies) mentioned herein or (b) be engaged in any other
transaction involving such securities and earn brokerage or other compensation or act as a market maker in the
financial instruments of the company (ies) discussed herein or act as advisor or lender / borrower to such company
(ies) or have other potential conflict of interest with respect to any recommendation and related information and
opinions.
The analyst for this report certifies that all of the views expressed in this report accurately reflect his or her personal
views about the subject company or companies and its or their securities, and no part of his or her compensation
was, is or will be, directly or indirectly related to specific recommendations or views expressed in this report.
No part of this material may be duplicated in any form and/or redistributed without Keynote Capitals Ltd’s., prior
written consent.
Keynote Capitals Ltd.
th
4 Floor, Balmer Lawrie Bldg., 5, J. N. Heredia Marg, Ballard Estate, Fort, Mumbai, India – 400001. Tel: 3026 6000 / 2269 4322
www.keynotecapitals.com