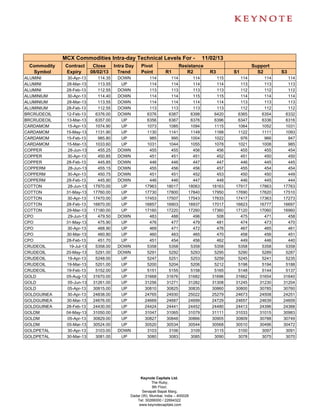
2. MCX Commodities Intra-day Technical Levels For - 11/02/13
Commodity Contract Close Intra Day Pivot Resistance Support
Symbol Expiry 08/02/13 Trend Point R1 R2 R3 S1 S2 S3
GOLDPETAL 28-Feb-13 3051.00 UP 3050 3053 3054 3058 3049 3046 3042
KAPAS 30-Mar-13 860.10 UP 858 863 865 872 856 852 845
KAPAS 30-Apr-13 893.30 UP 892 896 899 906 889 885 878
KAPASKHALI 31-May-13 1356.00 DOWN 1356 1357 1358 1360 1355 1354 1352
KAPASKHALI 30-Apr-13 1331.00 DOWN 1334 1341 1351 1368 1324 1317 1300
KAPASKHALI 28-Feb-13 1279.00 DOWN 1281 1287 1296 1311 1272 1266 1251
KAPASKHALI 30-Mar-13 1306.50 DOWN 1308 1315 1323 1338 1300 1293 1278
LEAD 30-Apr-13 130.65 DOWN 131 131 131 132 130 130 130
LEAD 28-Mar-13 130.25 DOWN 130 131 131 132 130 130 129
LEAD 28-Feb-13 129.80 DOWN 130 130 131 131 130 129 129
LEADMINI 31-May-13 130.85 UP 131 131 131 132 131 130 130
LEADMINI 30-Apr-13 130.40 DOWN 131 131 132 133 130 129 128
LEADMINI 28-Mar-13 130.20 DOWN 130 131 131 132 130 130 129
LEADMINI 28-Feb-13 129.80 DOWN 130 130 131 131 130 129 129
MENTHAOIL 30-Apr-13 1247.50 UP 1243 1256 1265 1286 1235 1222 1201
MENTHAOIL 31-May-13 1160.90 UP 1159 1170 1179 1198 1150 1140 1120
MENTHAOIL 30-Mar-13 1311.40 UP 1303 1322 1332 1361 1293 1274 1245
MENTHAOIL 28-Feb-13 1412.10 UP 1398 1429 1447 1495 1381 1350 1302
NATURALGAS 25-Apr-13 185.60 DOWN 186 187 188 189 185 184 183
NATURALGAS 25-Mar-13 180.80 UP 181 181 182 183 180 180 179
NATURALGAS 25-Feb-13 176.10 DOWN 176 177 177 178 176 175 174
NICKEL 30-Apr-13 992.90 DOWN 993 994 995 997 992 991 989
NICKEL 28-Mar-13 987.70 DOWN 988 989 990 992 987 986 984
NICKEL 28-Feb-13 982.80 DOWN 983 984 985 988 982 981 978
NICKELM 30-Apr-13 994.20 DOWN 995 999 1004 1013 990 986 977
NICKELM 28-Mar-13 987.80 DOWN 988 989 991 994 987 986 983
NICKELM 28-Feb-13 982.90 DOWN 983 984 985 987 982 981 979
POTATO 15-Apr-13 827.40 UP 824 833 838 852 819 811 797
POTATO 15-Mar-13 836.00 UP 834 842 848 863 828 819 805
POTATO 15-May-13 830.00 UP 827 834 838 849 823 816 805
REFSOYOIL 15-Feb-13 734.60 DOWN 735 738 742 750 731 727 719
SILVER 04-May-13 59613.00 UP 59598 59657 59700 59802 59555 59496 59394
SILVER 05-Mar-13 58246.00 UP 58223 58300 58354 58485 58169 58092 57961
SILVER1000 28-Feb-13 57778.00 DOWN 57806 57962 58145 58484 57623 57467 57128
SILVERM 29-Jun-13 60968.00 UP 60908 61109 61250 61592 60767 60566 60224
SILVERM 30-Apr-13 59622.00 UP 59610 59677 59731 59852 59556 59489 59368
SILVERM 28-Feb-13 58262.00 UP 58242 58314 58366 58490 58190 58118 57994
SILVERMIC 29-Jun-13 60950.00 UP 60945 61005 61059 61173 60891 60831 60717
SILVERMIC 30-Apr-13 59623.00 UP 59615 59681 59739 59863 59557 59491 59367
SILVERMIC 28-Feb-13 58257.00 UP 58226 58322 58387 58548 58161 58065 57904
STEELRPR 18-Apr-13 32240.00 DOWN 32267 32323 32407 32547 32183 32127 31987
STEELRPR 20-Feb-13 31000.00 DOWN 31050 31140 31280 31510 30910 30820 30590
STEELRPR 20-Mar-13 31760.00 DOWN 31797 31873 31987 32177 31683 31607 31417
ZINC 31-May-13 119.40 UP 119 120 120 120 119 119 119
ZINC 30-Apr-13 118.75 DOWN 119 119 119 120 119 118 118
ZINC 28-Mar-13 118.25 DOWN 118 119 119 120 118 118 117
ZINC 28-Feb-13 117.60 DOWN 118 118 118 119 117 117 116
ZINCMINI 31-May-13 119.15 DOWN 119 119 120 120 119 119 118
ZINCMINI 30-Apr-13 118.70 DOWN 119 119 120 120 118 118 117
Keynote Capitals Ltd.
The Ruby,
9th Floor,
Senapati Bapat Marg,
Dadar (W), Mumbai, India – 400028
Tel: 30266000 / 22694322
www.keynotecapitals.com
3. MCX Commodities Intra-day Technical Levels For - 11/02/13
Commodity Contract Close Intra Day Pivot Resistance Support
Symbol Expiry 08/02/13 Trend Point R1 R2 R3 S1 S2 S3
ZINCMINI 28-Mar-13 118.20 DOWN 118 119 119 120 118 117 116
ZINCMINI 28-Feb-13 117.55 DOWN 118 118 118 119 117 117 116
Sanjay Bhatia (AVP – Technical Research), Email Id sanjay@keynotecapitals.net
Pivot Point: Intra- Day Trading Tool. - The key to the use of this tool is the use of Stop Loss
Intra Day Trend: It is valid only till the point where Price trades above Pivot Point. For Eg. “UP” would be valid till Price
remains above Pivot Point. It would become “DOWN” in event Price trades below Pivot Point.
Pivot Point (PP): This is a trigger point for Intra Day Buy / Sell based on the price range of the previous day.
R1: Resistance 1: 1st Resistance level over Pivot Point, R2: Resistance 2: Next Resistance level after R1.
R3: Resistance 3: Next Resistance level after R2.
S1: Support 1: 1st Support level after Pivot Point, S2: Support 2: Next Support level after S1.
S3: Support 3: Next Support level after S2.
Note: As per this tool, the trader should take BUY position just above the Pivot Point and keep the Pivot Point level as stop
loss and the first target would be R1 level (Resistance 1). If R1 is crossed then R2 (Resistance 2) becomes the next target
with the stop loss placed at R1 level. If R2 is crossed then R3 (Resistance 3) becomes the next target with the stop loss
placed at R2 level.
Similarly if price goes below the Pivot Point the trader should take a SELL position and keep the Pivot Point level as the
stop loss and the first target would be S1 level (Support 1). If S1 level is breached then S2 level (Support 2) becomes the
next target with the stop loss placed at S1 level. If S2 level is breached then S3 level (Support 3) becomes the next target
with the stop loss placed at S2 level.
Disclaimer: This document is not for public distribution and has been furnished to you solely for your information and must not be reproduced or
redistributed to any other person. Persons into whose possession this document may come are required to observe these restrictions. This material is for
the personal information of the authorized recipient, and we are not soliciting any action based upon it. This report is not to be construed as an offer to
sell or the solicitation of an offer to buy any security in any jurisdiction where such an offer or solicitation would be illegal. It is for the general information
of clients of Keynote Capitals Ltd. It does not constitute a personal recommendation or take into account the particular investment objectives, financial
situations, or needs of individual clients. We have reviewed the report, and in so far as it includes current or historical information, it is believed to be
reliable though its accuracy or completeness cannot be guaranteed. Neither Keynote Capitals Ltd., nor any person connected with it, accepts any liability
arising from the use of this document. The recipients of this material should rely on their own investigations and take their own professional advice. Price
and value of the investments referred to in this material may go up or down. Past performance is not a guide for future performance. Certain transactions
-including those involving futures, options and other derivatives as well as non-investment grade securities - involve substantial risk and are not suitable
for all investors. Reports based on technical analysis centers on studying charts of a stock’s price movement and trading volume, as opposed to focusing
on a company’s fundamentals and as such, may not match with a report on a company’s fundamentals. Opinions expressed are our current opinions as
of the date appearing on this material only. While we endeavor to update on a reasonable basis the information discussed in this material, there may be
regulatory, compliance, or other reasons that prevent us from doing so. Prospective investors and others are cautioned that any forward-looking
statements are not predictions and may be subject to change without notice. Our proprietary trading and investment businesses may make investment
decisions that are inconsistent with the recommendations expressed herein. We and our affiliates, officers, directors, and employees world wide may: (a)
from time to time, have long or short positions in, and buy or sell the securities thereof, of company (ies) mentioned herein or (b) be engaged in any other
transaction involving such securities and earn brokerage or other compensation or act as a market maker in the financial instruments of the company
(ies) discussed herein or act as advisor or lender / borrower to such company (ies) or have other potential conflict of interest with respect to any
recommendation and related information and opinions. The analyst for this report certifies that all of the views expressed in this report accurately reflect
his or her personal views about the subject company or companies and its or their securities, and no part of his or her compensation was, is or will be,
directly or indirectly related to specific recommendations or views expressed in this report. No part of this material may be duplicated in any form and/or
redistributed without Keynote Capitals Ltd’s., prior written consent.
Keynote Capitals Ltd.
The Ruby,
9th Floor,
Senapati Bapat Marg,
Dadar (W), Mumbai, India – 400028
Tel: 30266000 / 22694322
www.keynotecapitals.com