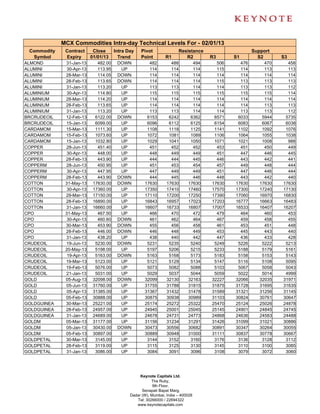
2. MCX Commodities Intra-day Technical Levels For - 02/01/13
Commodity Contract Close Intra Day Pivot Resistance Support
Symbol Expiry 01/01/13 Trend Point R1 R2 R3 S1 S2 S3
GOLDPTLDEL 30-Mar-13 3154.00 DOWN 3156 3183 3211 3266 3128 3101 3046
GOLDPTLDEL 31-Jan-13 3127.00 DOWN 3138 3157 3186 3234 3109 3090 3042
GOLDPTLDEL 28-Feb-13 3168.00 UP 3160 3198 3229 3298 3129 3091 3022
KAPAS 30-Mar-13 981.50 UP 979 985 989 998 975 969 959
KAPAS 30-Apr-13 994.80 UP 992 999 1002 1012 989 982 972
KAPASKHALI 30-Apr-13 1488.50 UP 1488 1495 1502 1516 1481 1474 1460
KAPASKHALI 30-Mar-13 1455.50 UP 1455 1460 1464 1473 1451 1446 1437
KAPASKHALI 28-Feb-13 1419.50 UP 1419 1424 1429 1439 1414 1409 1399
KAPASKHALI 31-Jan-13 1388.50 UP 1387 1394 1399 1411 1382 1375 1363
LEAD 30-Apr-13 127.60 DOWN 128 128 128 128 127 127 127
LEAD 28-Mar-13 127.55 DOWN 128 128 128 128 127 127 127
LEAD 28-Feb-13 127.75 UP 128 128 128 129 127 127 127
LEAD 31-Jan-13 127.55 UP 127 128 128 129 127 127 126
LEADMINI 30-Apr-13 127.25 DOWN 127 127 128 128 127 127 127
LEADMINI 28-Mar-13 127.45 UP 127 128 128 128 127 127 127
LEADMINI 28-Feb-13 127.65 UP 128 128 128 129 127 127 127
LEADMINI 31-Jan-13 127.50 UP 127 128 128 129 127 127 126
MENTHAOIL 30-Apr-13 1460.90 UP 1456 1472 1484 1512 1444 1427 1399
MENTHAOIL 30-Mar-13 1464.40 UP 1461 1473 1482 1503 1452 1439 1418
MENTHAOIL 28-Feb-13 1467.20 UP 1460 1479 1491 1521 1448 1429 1399
MENTHAOIL 31-Jan-13 1453.10 UP 1446 1465 1476 1507 1434 1415 1385
NATURALGAS 25-Mar-13 190.40 DOWN 190 191 192 194 190 189 187
NATURALGAS 25-Feb-13 187.20 DOWN 187 188 189 191 186 185 184
NATURALGAS 28-Jan-13 185.10 DOWN 185 186 187 189 184 183 182
NICKEL 30-Apr-13 967.00 DOWN 967 968 969 971 966 965 963
NICKEL 28-Mar-13 961.20 DOWN 961 962 964 966 960 959 956
NICKEL 28-Feb-13 955.30 UP 955 957 958 961 953 952 949
NICKEL 31-Jan-13 948.60 UP 947 951 953 958 945 942 936
NICKELM 28-Mar-13 960.80 DOWN 961 962 964 967 959 958 955
NICKELM 30-Apr-13 965.40 UP 965 968 971 978 962 958 952
NICKELM 28-Feb-13 955.10 UP 954 957 959 963 952 950 945
NICKELM 31-Jan-13 949.00 UP 948 951 953 959 946 942 937
POTATO 15-Apr-13 720.90 DOWN 723 725 730 737 718 716 708
POTATO 15-May-13 720.40 DOWN 723 726 731 740 717 714 705
POTATO 15-Mar-13 763.30 DOWN 764 769 774 784 759 755 745
SILVER 05-Jul-13 60530.00 UP 60527 60606 60682 60837 60451 60372 60217
SILVER 04-May-13 59261.00 UP 59226 59355 59449 59672 59132 59003 58780
SILVER 05-Mar-13 57918.00 UP 57882 58009 58100 58318 57791 57664 57446
SILVER1000 28-Feb-13 56985.00 UP 56980 57417 57849 58718 56548 56111 55242
SILVER1000 31-Jan-13 56702.00 UP 56660 56931 57159 57658 56432 56161 55662
SILVERM 29-Jun-13 60632.00 UP 60594 60738 60843 61092 60489 60345 60096
SILVERM 30-Apr-13 59315.00 UP 59232 59453 59592 59952 59093 58872 58512
SILVERM 28-Feb-13 57946.00 UP 57891 58053 58159 58427 57785 57623 57355
SILVERMIC 29-Jun-13 60661.00 UP 60524 60837 61014 61504 60347 60034 59544
SILVERMIC 30-Apr-13 59294.00 UP 59248 59404 59515 59782 59137 58981 58714
SILVERMIC 28-Feb-13 57950.00 UP 57888 58062 58173 58458 57777 57603 57318
Keynote Capitals Ltd.
The Ruby,
9th Floor,
Senapati Bapat Marg,
Dadar (W), Mumbai, India – 400028
Tel: 30266000 / 22694322
www.keynotecapitals.com
3. MCX Commodities Intra-day Technical Levels For - 02/01/13
Commodity Contract Close Intra Day Pivot Resistance Support
Symbol Expiry 01/01/13 Trend Point R1 R2 R3 S1 S2 S3
STEELRPR 20-Mar-13 33400.00 UP 33363 33527 33653 33943 33237 33073 32783
STEELRPR 20-Feb-13 33040.00 UP 32927 33203 33367 33807 32763 32487 32047
STEELRPR 18-Jan-13 32390.00 UP 32307 32473 32557 32807 32223 32057 31807
ZINC 28-Mar-13 114.15 UP 114 114 114 115 114 114 114
ZINC 28-Feb-13 113.85 UP 114 114 114 115 114 113 113
ZINC 31-Jan-13 113.35 UP 113 114 114 114 113 113 112
ZINCMINI 30-Apr-13 114.35 UP 114 115 115 116 114 113 112
ZINCMINI 28-Mar-13 114.05 DOWN 114 114 114 115 114 114 113
ZINCMINI 28-Feb-13 113.80 UP 114 114 114 115 114 113 113
ZINCMINI 31-Jan-13 113.35 UP 113 114 114 114 113 113 112
Sanjay Bhatia (AVP – Technical Research),
Email Id sanjay@keynotecapitals.net
Pivot Point: Intra- Day Trading Tool. - The key to the use of this tool is the use of Stop Loss
Intra Day Trend: It is valid only till the point where Price trades above Pivot Point. For Eg. “UP” would be valid till Price
remains above Pivot Point. It would become “DOWN” in event Price trades below Pivot Point.
Pivot Point (PP): This is a trigger point for Intra Day Buy / Sell based on the price range of the previous day.
R1: Resistance 1: 1st Resistance level over Pivot Point, R2: Resistance 2: Next Resistance level after R1.
R3: Resistance 3: Next Resistance level after R2.
S1: Support 1: 1st Support level after Pivot Point, S2: Support 2: Next Support level after S1.
S3: Support 3: Next Support level after S2.
Note: As per this tool, the trader should take BUY position just above the Pivot Point and keep the Pivot Point level as stop
loss and the first target would be R1 level (Resistance 1). If R1 is crossed then R2 (Resistance 2) becomes the next target
with the stop loss placed at R1 level. If R2 is crossed then R3 (Resistance 3) becomes the next target with the stop loss
placed at R2 level.
Similarly if price goes below the Pivot Point the trader should take a SELL position and keep the Pivot Point level as the
stop loss and the first target would be S1 level (Support 1). If S1 level is breached then S2 level (Support 2) becomes the
next target with the stop loss placed at S1 level. If S2 level is breached then S3 level (Support 3) becomes the next target
with the stop loss placed at S2 level.
Disclaimer: This document is not for public distribution and has been furnished to you solely for your information and must not be reproduced or
redistributed to any other person. Persons into whose possession this document may come are required to observe these restrictions. This material is
for the personal information of the authorized recipient, and we are not soliciting any action based upon it. This report is not to be construed as an offer
to sell or the solicitation of an offer to buy any security in any jurisdiction where such an offer or solicitation would be illegal. It is for the general
information of clients of Keynote Capitals Ltd. It does not constitute a personal recommendation or take into account the particular investment
objectives, financial situations, or needs of individual clients. We have reviewed the report, and in so far as it includes current or historical information, it
is believed to be reliable though its accuracy or completeness cannot be guaranteed. Neither Keynote Capitals Ltd., nor any person connected with it,
accepts any liability arising from the use of this document. The recipients of this material should rely on their own investigations and take their own
professional advice. Price and value of the investments referred to in this material may go up or down. Past performance is not a guide for future
performance. Certain transactions -including those involving futures, options and other derivatives as well as non-investment grade securities - involve
substantial risk and are not suitable for all investors. Reports based on technical analysis centers on studying charts of a stock’s price movement and
trading volume, as opposed to focusing on a company’s fundamentals and as such, may not match with a report on a company’s fundamentals.
Opinions expressed are our current opinions as of the date appearing on this material only. While we endeavor to update on a reasonable basis the
information discussed in this material, there may be regulatory, compliance, or other reasons that prevent us from doing so. Prospective investors and
others are cautioned that any forward-looking statements are not predictions and may be subject to change without notice. Our proprietary trading and
investment businesses may make investment decisions that are inconsistent with the recommendations expressed herein. We and our affiliates,
officers, directors, and employees world wide may: (a) from time to time, have long or short positions in, and buy or sell the securities thereof, of
company (ies) mentioned herein or (b) be engaged in any other transaction involving such securities and earn brokerage or other compensation or act
as a market maker in the financial instruments of the company (ies) discussed herein or act as advisor or lender / borrower to such company (ies) or
have other potential conflict of interest with respect to any recommendation and related information and opinions. The analyst for this report certifies that
all of the views expressed in this report accurately reflect his or her personal views about the subject company or companies and its or their securities,
and no part of his or her compensation was, is or will be, directly or indirectly related to specific recommendations or views expressed in this report. No
part of this material may be duplicated in any form and/or redistributed without Keynote Capitals Ltd’s., prior written consent.
Keynote Capitals Ltd.
The Ruby,
9th Floor,
Senapati Bapat Marg,
Dadar (W), Mumbai, India – 400028
Tel: 30266000 / 22694322
www.keynotecapitals.com