HL science 239610 Algorithm Investment Report
•
0 likes•51 views

HL science 239610 Algorithm Investment Report
![[Price for scheduled purchasing]
Arbitrarily made
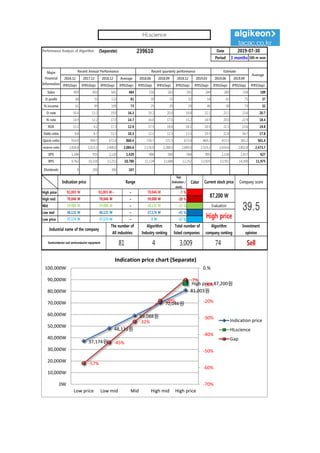
Algorithm stocks Trading Strategies (Separate) 239610 Date
Period
Gap
(Indication /
stock)
Color
2019-07-30
3 months
Current stock price Evaluation
Stock price rise
probability score
Investment opinion Prospective purchase amount
87,200 W High price 35.5 Sell 2,000,000 W
Suggested Purchase
Amount 502,183 W
Number of stocks
purchased 6
Indication price Range Buying / Selling Buying / Selling [Stocks]
High price 81,003 W 81,003 W~ ~ 70,046 W -7 % 35,690 W 0
High mid 70,046 W 70,046 W ~ 59,088 W -20 % 98,792 W 1
Mid 59,088 W 59,088 W ~ 48,131 W -32 % 161,895 W 3
Low mid 48,131 W 48,131 W ~ 37,174 W -45 % 224,997 W 5
low price 37,174 W 37,174 W ~ 0 W -57 % 288,100 W 8
2019.03.06 2019.04.03 2019.05.02 2019.05.31 2019.07.01 2019.07.29
31.7 43.0 37.5
Stock price rise
probability score
A Sector 51.0 51.6 48.8 49.2 45.2 47.1
35.5B Sector 43.8 28.8 49.2 49.2 40.8 27.9
Total average 47.4 40.2 38.8
26 % -15 %
2019.04.03 2019.05.02 2019.05.31 2019.07.01 2019.07.29
Total of
increase rate
Total score
A Sector 1 % -6 % 1 % -9 % 4 %
-6 % 41.0B Sector -52 % 0 % 42 % -21 % -46 %
Total average -18 % -4 % -22 %
1%
-6%
1%
-9%
4%
-52%
0%
42%
-21%
-46%
-18%
-4%
-22%
26%
-15%
-60%
-40%
-20%
0%
20%
40%
60%
2019.04.03 2019.05.02 2019.05.31 2019.07.01 2019.07.29
Increase rate of stock price rise
A sector
B sector
Total average
HLscience
51 52
49 49
45 47
44
29 29
49
41
28
47
40 39
32
43
38
0
10
20
30
40
50
60
2019.03.06 2019.04.03 2019.05.02 2019.05.31 2019.07.01 2019.07.29
Stock price rise probability score
A sector
B sector
Total average](data:image/gif;base64,R0lGODlhAQABAIAAAAAAAP///yH5BAEAAAAALAAAAAABAAEAAAIBRAA7)
Recommended
Recommended
More Related Content
What's hot
What's hot (20)
Similar to HL science 239610 Algorithm Investment Report
Similar to HL science 239610 Algorithm Investment Report (20)
More from 알고리즘 기업분석 컨설팅-알기컨,algikeon
More from 알고리즘 기업분석 컨설팅-알기컨,algikeon (20)
Recently uploaded
Recently uploaded (20)
HL science 239610 Algorithm Investment Report
- 1. Performance Analysis of Algorithm (Separate) 239610 Date Period 3 months 100-m won 2016.12 2017.12 2018.12 Average 2018.06 2018.09 2018.12 2019.03 2019.06 2019.09 IFRS(Sep) IFRS(Sep) IFRS(Sep) IFRS(Sep) IFRS(Sep) IFRS(Sep) IFRS(Sep) IFRS(Sep) IFRS(Sep) IFRS(Sep) IFRS(Sep) Sales 409 402 641 484 156 165 191 244 289 318 189 O-profit 68 53 122 81 30 33 32 54 65 75 37 N-income 61 49 109 73 25 29 29 46 58 73 32 O-rate 16.6 13.2 19.0 16.3 19.2 20.0 16.8 22.1 22.5 23.6 20.7 N-rate 14.9 12.2 17.0 14.7 16.0 17.6 15.2 18.9 20.0 22.9 18.4 ROE 12.2 9.2 17.3 12.9 17.5 18.4 18.1 20.5 21.5 22.6 19.8 Debt-ratio 8.8 8.7 13.3 10.3 12.1 12.3 13.3 19.5 22.8 26.7 17.8 Quick-ratio 914.0 994.7 672.4 860.4 726.7 721.5 672.4 469.2 413.3 365.2 561.4 reserve-ratio 1,830.8 2,023.1 2,400.0 2,084.6 2,176.9 2,288.5 2,400.0 2,519.2 2,654.6 2,802.8 2,473.7 EPS 1,186 953 2,120 1,420 486 564 564 895 1,126 1,417 627 BPS 9,762 10,326 12,252 10,780 11,124 11,688 12,252 12,835 13,591 14,390 11,975 Dividends 0 200 300 167 2019-07-30 Major Financial Information Recent Annual Performance Recent quarterly performance Estimate Average Gap (Indication / stock) Color High price ~ -7 % High mid ~ -20 % Mid ~ -32 % Low mid ~ -45 % Low price ~ -57 % Indication price Range Current stock price Company score 70,046 W 70,046 W 59,088 W 59,088 W 59,088 W 48,131 W Evaluation 81,003 W 81,003 W~ 70,046 W 87,200 W 39.548,131 W 48,131 W 37,174 W High price Sell 37,174 W 37,174 W 0 W Industrial name of the company The number of All industries Algorithm Industry ranking Total number of listed companies Algorithm company ranking Investment opinion Semiconductor and semiconductor equipment 81 4 3,009 74 37,174원 48,131원 59,088원 70,046원 81,003원 High price 87,200원 -57% -45% -32% -20% -7% -70% -60% -50% -40% -30% -20% -10% 0.% 0W 10,000W 20,000W 30,000W 40,000W 50,000W 60,000W 70,000W 80,000W 90,000W 100,000W Low price Low mid Mid High mid High price Indication price chart (Separate) Indication price HLscience Gap HLscience
- 2. [Price for scheduled purchasing] Arbitrarily made Algorithm stocks Trading Strategies (Separate) 239610 Date Period Gap (Indication / stock) Color 2019-07-30 3 months Current stock price Evaluation Stock price rise probability score Investment opinion Prospective purchase amount 87,200 W High price 35.5 Sell 2,000,000 W Suggested Purchase Amount 502,183 W Number of stocks purchased 6 Indication price Range Buying / Selling Buying / Selling [Stocks] High price 81,003 W 81,003 W~ ~ 70,046 W -7 % 35,690 W 0 High mid 70,046 W 70,046 W ~ 59,088 W -20 % 98,792 W 1 Mid 59,088 W 59,088 W ~ 48,131 W -32 % 161,895 W 3 Low mid 48,131 W 48,131 W ~ 37,174 W -45 % 224,997 W 5 low price 37,174 W 37,174 W ~ 0 W -57 % 288,100 W 8 2019.03.06 2019.04.03 2019.05.02 2019.05.31 2019.07.01 2019.07.29 31.7 43.0 37.5 Stock price rise probability score A Sector 51.0 51.6 48.8 49.2 45.2 47.1 35.5B Sector 43.8 28.8 49.2 49.2 40.8 27.9 Total average 47.4 40.2 38.8 26 % -15 % 2019.04.03 2019.05.02 2019.05.31 2019.07.01 2019.07.29 Total of increase rate Total score A Sector 1 % -6 % 1 % -9 % 4 % -6 % 41.0B Sector -52 % 0 % 42 % -21 % -46 % Total average -18 % -4 % -22 % 1% -6% 1% -9% 4% -52% 0% 42% -21% -46% -18% -4% -22% 26% -15% -60% -40% -20% 0% 20% 40% 60% 2019.04.03 2019.05.02 2019.05.31 2019.07.01 2019.07.29 Increase rate of stock price rise A sector B sector Total average HLscience 51 52 49 49 45 47 44 29 29 49 41 28 47 40 39 32 43 38 0 10 20 30 40 50 60 2019.03.06 2019.04.03 2019.05.02 2019.05.31 2019.07.01 2019.07.29 Stock price rise probability score A sector B sector Total average
- 3. may ded by Compliance notice ① The information provided by The Algorithm Company Analysis Consulting is obtained through reliable data and information and The Algorithm Company Analysis Program (TACAP), but its accuracy or completeness are not guaranteed. Furthermore, it may change over time.Therefore, we are not legally responsible for the results of the data provided by The Algorithm Company Analysis Consulting because of information errors or omissions. ② The Algorithm Company Analysis Consulting and all the information provided on it site are reference materials for investment decisions and the final responsibility of investment is up to users utilizing this information. ③ The Algorithm Company Analysis Consulting and its site do not do anything that violates the related laws such as discretionary transaction. ④ Users can not reallocate and recycle the information provided by The Algorithm Company Analysis Consulting firm let alone the information provided by its Site. ⑤ Be sure to know about application period of this algorithm analysis report in order to improve its accuracy. Tel : 070 - 4667 - 5009 Email : tacac@tacac.co.kr Homepage : tacac.co.kr Blog : tacac.blog.me SERVICES M&A, IPO, RECOVER, CORPORATE RESTRUCTURING, MANAGEMENT OF TECHNOLOGY, BUSINESS STRATEGY, FAMILY BUSINESS Request : http://tacac.co.kr/?page_id=1374