lg-003550-Algorithm Investment Report
•
0 likes•78 views

lg-003550-Algorithm Investment Report
![[Price for scheduled purchasing]
Arbitrarily made
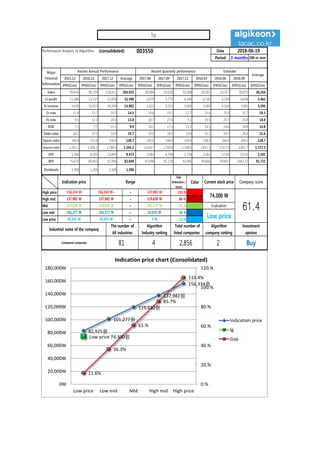
Algorithm stocks Trading Strategies (consolidated) 003550 Date
Period
Gap
(Indication /
stock)
Color
low price 82,925 W 82,925 W ~ 0 W 12 % -696,370 W -8
Low mid 101,277 W 101,277 W ~ 82,925 W 36 % -2,178,029 W -22
Mid 119,630 W 119,630 W ~ 101,277 W 61 % -3,659,688 W -31
High mid 137,982 W 137,982 W ~ 119,630 W 86 % -5,141,347 W -37
Suggested Purchase
Amount 5,998,619 W
Number of stocks
purchased 81
Indication price Range Buying / Selling Buying / Selling [Stocks]
High price 156,334 W 156,334 W~ ~ 137,982 W 110 % -6,623,006 W All selling
2018-06-19
3 months
Current stock price Evaluation
Stock price rise
probability score
Investment opinion Prospective purchase amount
74,300 W Low price 56.4 Buy 10,000,000 W
40.7 40.3 48.1 51.3 41.5 36.8
2018.01.17 2018.02.14 2018.03.19 2018.04.16 2018.05.16 2018.06.18
Stock price rise
probability score
A Sector 46.8 46.4 47.0 46.2 44.7 43.6
56.4B Sector 34.6 34.2 49.2 46.2 38.3 30.0
Total average
2018.03.19 2018.04.16 2018.05.16 2018.06.18
Total of
increase rate
Total score
A Sector -1 % 1 % -2 % -3 % -3 %
-3 % 44.3B Sector -1 % 31 % -6 % -21 % -28 %
Total average -1 % 16 % 6 % -23 % -13 %
2018.02.14
47 46 47 46 45 44
35 34
49
46
38
30
41 40
48
51
42
37
0
10
20
30
40
50
60
2018.01.17 2018.02.14 2018.03.19 2018.04.16 2018.05.16 2018.06.18
Stock price rise probability score
A sector
B sector
Total average
-1% 1% -2% -3% -3%-1%
31%
-6%
-21%
-28%
-1%
16%
6%
-23%
-13%
-40%
-30%
-20%
-10%
0%
10%
20%
30%
40%
2018.02.14 2018.03.19 2018.04.16 2018.05.16 2018.06.18
Increase rate of stock price rise
A sector
B sector
Total average
lg](data:image/gif;base64,R0lGODlhAQABAIAAAAAAAP///yH5BAEAAAAALAAAAAABAAEAAAIBRAA7)
Recommended
Recommended
More Related Content
What's hot
What's hot (20)
Similar to lg-003550-Algorithm Investment Report
Similar to lg-003550-Algorithm Investment Report (17)
More from 알고리즘 기업분석 컨설팅-알기컨,algikeon
More from 알고리즘 기업분석 컨설팅-알기컨,algikeon (20)
Recently uploaded
Recently uploaded (20)
lg-003550-Algorithm Investment Report
- 1. Performance Analysis of Algorithm (consolidated) 003550 Date Period 3 months 100-m won 2015.12 2016.12 2017.12 Average 2017.06 2017.09 2017.12 2018.03 2018.06 2018.09 IFRS(Con) IFRS(Con) IFRS(Con) IFRS(Con) IFRS(Con) IFRS(Con) IFRS(Con) IFRS(Con) IFRS(Con) IFRS(Con) IFRS(Con) Sales 99,654 96,739 118,411 104,935 28,986 30,030 33,508 28,501 29,767 30,675 30,256 O-profit 11,386 13,227 21,858 15,490 5,679 5,775 4,249 6,146 6,250 6,658 5,462 N-income 9,438 10,913 24,356 14,902 5,422 8,350 3,049 5,560 6,166 7,065 5,595 O-rate 11.4 13.7 18.5 14.5 19.6 19.2 12.7 21.6 21.0 21.7 18.3 N-rate 9.5 11.3 20.6 13.8 18.7 27.8 9.1 19.5 20.7 23.0 18.8 ROE 7.1 7.7 15.1 9.9 14.2 17.5 13.1 14.5 14.6 14.8 14.8 Debt-ratio 36.2 37.1 33.8 35.7 33.0 28.3 33.8 31.2 29.7 28.3 31.6 Quick-ratio 140.4 121.4 130.4 130.7 102.0 144.0 130.4 138.2 166.9 204.5 128.7 reserve-ratio 1,391.1 1,496.1 1,748.5 1,545.2 1,614.7 1,708.8 1,748.5 1,837.2 1,917.9 2,002.7 1,727.3 EPS 5,366 6,205 13,849 8,473 3,083 4,748 1,734 3,161 3,530 4,125 3,181 BPS 75,670 80,855 91,996 82,840 87,096 91,128 91,996 96,666 99,837 104,172 91,721 Dividends 1,300 1,300 1,300 1,300 Major Financial Information Recent Annual Performance Recent quarterly performance Estimate Average 2018-06-19 Gap (Indication / stock) Color High price ~ 110 % High mid ~ 86 % Mid ~ 61 % Low mid ~ 36 % Low price ~ 12 % Buy 82,925 W 82,925 W 0 W Industrial name of the company The number of All industries Algorithm Industry ranking Total number of listed companies Algorithm company ranking Investment opinion Compound companies 81 4 2,856 2 137,982 W 137,982 W 119,630 W 119,630 W 119,630 W 101,277 W Evaluation 156,334 W 156,334 W~ 137,982 W 74,300 W 61.4101,277 W 101,277 W 82,925 W Low price Indication price Range Current stock price Company score 82,925원 101,277원 119,630원 137,982원 156,334원 Low price 74,300원 11.6% 36.3% 61.% 85.7% 110.4% 0.% 20.% 40.% 60.% 80.% 100.% 120.% 0W 20,000W 40,000W 60,000W 80,000W 100,000W 120,000W 140,000W 160,000W 180,000W Low price Low mid Mid High mid High price Indication price chart (Consolidated) Indication price lg Gap lg
- 2. [Price for scheduled purchasing] Arbitrarily made Algorithm stocks Trading Strategies (consolidated) 003550 Date Period Gap (Indication / stock) Color low price 82,925 W 82,925 W ~ 0 W 12 % -696,370 W -8 Low mid 101,277 W 101,277 W ~ 82,925 W 36 % -2,178,029 W -22 Mid 119,630 W 119,630 W ~ 101,277 W 61 % -3,659,688 W -31 High mid 137,982 W 137,982 W ~ 119,630 W 86 % -5,141,347 W -37 Suggested Purchase Amount 5,998,619 W Number of stocks purchased 81 Indication price Range Buying / Selling Buying / Selling [Stocks] High price 156,334 W 156,334 W~ ~ 137,982 W 110 % -6,623,006 W All selling 2018-06-19 3 months Current stock price Evaluation Stock price rise probability score Investment opinion Prospective purchase amount 74,300 W Low price 56.4 Buy 10,000,000 W 40.7 40.3 48.1 51.3 41.5 36.8 2018.01.17 2018.02.14 2018.03.19 2018.04.16 2018.05.16 2018.06.18 Stock price rise probability score A Sector 46.8 46.4 47.0 46.2 44.7 43.6 56.4B Sector 34.6 34.2 49.2 46.2 38.3 30.0 Total average 2018.03.19 2018.04.16 2018.05.16 2018.06.18 Total of increase rate Total score A Sector -1 % 1 % -2 % -3 % -3 % -3 % 44.3B Sector -1 % 31 % -6 % -21 % -28 % Total average -1 % 16 % 6 % -23 % -13 % 2018.02.14 47 46 47 46 45 44 35 34 49 46 38 30 41 40 48 51 42 37 0 10 20 30 40 50 60 2018.01.17 2018.02.14 2018.03.19 2018.04.16 2018.05.16 2018.06.18 Stock price rise probability score A sector B sector Total average -1% 1% -2% -3% -3%-1% 31% -6% -21% -28% -1% 16% 6% -23% -13% -40% -30% -20% -10% 0% 10% 20% 30% 40% 2018.02.14 2018.03.19 2018.04.16 2018.05.16 2018.06.18 Increase rate of stock price rise A sector B sector Total average lg
- 3. 정보와 완전 정보 결 투자판단 있습니 위배 무단으 숙지하 Compliance notice ① The information provided by The Algorithm Company Analysis Consulting is obtained through reliable data and information and The Algorithm Company Analysis Program (TACAP), but its accuracy or completeness are not guaranteed. Furthermore, it may change over time.Therefore, we are not legally responsible for the results of the data provided by The Algorithm Company Analysis Consulting because of information errors or omissions. ② The Algorithm Company Analysis Consulting and all the information provided on it site are reference materials for investment decisions and the final responsibility of investment is up to users utilizing this information. ③ The Algorithm Company Analysis Consulting and its site do not do anything that violates the related laws such as discretionary transaction. ④ Users can not reallocate and recycle the information provided by The Algorithm Company Analysis Consulting firm let alone the information provided by its Site. ⑤ Be sure to know about application period of this algorithm analysis report in order to improve its accuracy. Tel : 070 - 4667 - 5009 Email : tacac@tacac.co.kr Homepage : tacac.co.kr Blog : tacac.blog.me SERVICES M&A, IPO, RECOVER, CORPORATE RESTRUCTURING, MANAGEMENT OF TECHNOLOGY, BUSINESS STRATEGY, FAMILY BUSINESS Request : http://tacac.co.kr/?page_id=1374 ① Consulting The Algori accuracy o change ove results of Consulting ② informatio investmen up ③ do anythin transaction ④ The Algori informatio ⑤ analysis re