samsung electronics-005930-Algorithm Investment Report
•
0 likes•113 views

samsung electronics-005930-Algorithm Investment Report
![[Price for scheduled purchasing]
Arbitrarily made
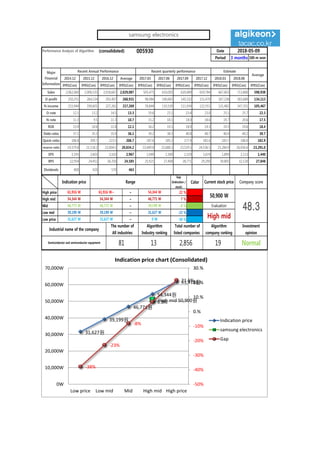
Algorithm stocks Trading Strategies (consolidated) 005930 Date
Period
Gap
(Indication /
stock)
Color
low price 31,627 W 31,627 W ~ 0 W -38 % 496,535 W 16
Low mid 39,199 W 39,199 W ~ 31,627 W -23 % 301,450 W 8
Mid 46,771 W 46,771 W ~ 39,199 W -8 % 106,366 W 2
High mid 54,344 W 54,344 W ~ 46,771 W 7 % -88,719 W -2
Suggested Purchase
Amount 1,311,363 W
Number of stocks
purchased 26
Indication price Range Buying / Selling Buying / Selling [Stocks]
High price 61,916 W 61,916 W~ ~ 54,344 W 22 % -283,803 W -5
2018-05-09
3 months
Current stock price Evaluation
Stock price rise
probability score
Investment opinion Prospective purchase amount
50,900 W High mid 36.0 Normal 3,500,000 W
46.3 42.4 48.2 32.1 39.2 44.5
2017.12.08 2018.01.10 2018.02.07 2018.03.12 2018.04.09 2018.05.09
Stock price rise
probability score
A Sector 49.2 44.5 44.8 47.7 45.0 46.5
36.0B Sector 43.3 40.4 51.7 47.7 33.3 42.5
Total average
2018.02.07 2018.03.12 2018.04.09 2018.05.09
Total of
increase rate
Total score
A Sector -11 % 1 % 6 % -6 % 3 %
-3 % 46.0B Sector -7 % 22 % -8 % -43 % 22 %
Total average -9 % 12 % -50 % 18 % 12 %
2018.01.10
49
44 45
48
45 46
43
40
52
48
33
43
46
42
48
32
39
44
0
10
20
30
40
50
60
2017.12.08 2018.01.10 2018.02.07 2018.03.12 2018.04.09 2018.05.09
Stock price rise probability score
A sector
B sector
Total average
-11%
1%
6%
-6%
3%
-7%
22%
-8%
-43%
22%
-9%
12%
-50%
18%
12%
-60%
-50%
-40%
-30%
-20%
-10%
0%
10%
20%
30%
2018.01.10 2018.02.07 2018.03.12 2018.04.09 2018.05.09
Increase rate of stock price rise
A sector
B sector
Total average
samsung electronics](data:image/gif;base64,R0lGODlhAQABAIAAAAAAAP///yH5BAEAAAAALAAAAAABAAEAAAIBRAA7)
Recommended
Recommended
More Related Content
What's hot
What's hot (20)
Similar to samsung electronics-005930-Algorithm Investment Report
Similar to samsung electronics-005930-Algorithm Investment Report (20)
More from 알고리즘 기업분석 컨설팅-알기컨,algikeon
More from 알고리즘 기업분석 컨설팅-알기컨,algikeon (20)
Recently uploaded
Recently uploaded (20)
samsung electronics-005930-Algorithm Investment Report
- 1. Performance Analysis of Algorithm (consolidated) 005930 Date Period 3 months 100-m won 2014.12 2015.12 2016.12 Average 2017.03 2017.06 2017.09 2017.12 2018.03 2018.06 IFRS(Con) IFRS(Con) IFRS(Con) IFRS(Con) IFRS(Con) IFRS(Con) IFRS(Con) IFRS(Con) IFRS(Con) IFRS(Con) IFRS(Con) Sales 2,062,060 2,006,535 2,018,667 2,029,087 505,475 610,005 620,489 659,784 667,603 713,860 598,938 O-profit 250,251 264,134 292,407 268,931 98,984 140,665 145,332 151,470 167,238 183,680 134,113 N-income 233,944 190,601 227,261 217,269 76,844 110,539 111,934 122,551 131,482 147,351 105,467 O-rate 12.1 13.2 14.5 13.3 19.6 23.1 23.4 23.0 25.1 25.7 22.3 N-rate 11.3 9.5 11.3 10.7 15.2 18.1 18.0 18.6 19.7 20.6 17.5 ROE 13.9 10.6 11.8 12.1 16.2 19.1 18.9 19.3 19.3 19.6 18.4 Debt-ratio 37.1 35.3 35.9 36.1 39.2 38.3 40.8 40.7 40.4 40.2 39.7 Quick-ratio 186.8 209.7 223.5 206.7 187.6 185.2 177.4 181.6 183.7 186.0 182.9 reserve-ratio 19,379.8 21,118.2 22,004.5 20,834.2 22,409.8 22,688.3 23,529.5 24,536.5 25,284.9 26,056.6 23,291.0 EPS 3,195 2,603 3,103 2,967 1,049 1,509 1,529 1,674 1,899 2,113 1,440 BPS 22,954 24,452 26,350 24,585 25,921 27,408 28,771 29,290 30,805 32,120 27,848 Dividends 400 420 570 463 Major Financial Information Recent Annual Performance Recent quarterly performance Estimate Average 2018-05-09 Gap (Indication / stock) Color High price ~ 22 % High mid ~ 7 % Mid ~ -8 % Low mid ~ -23 % Low price ~ -38 % Normal 31,627 W 31,627 W 0 W Industrial name of the company The number of All industries Algorithm Industry ranking Total number of listed companies Algorithm company ranking Investment opinion Semiconductor and semiconductor equipment 81 13 2,856 19 54,344 W 54,344 W 46,771 W 46,771 W 46,771 W 39,199 W Evaluation 61,916 W 61,916 W~ 54,344 W 50,900 W 48.339,199 W 39,199 W 31,627 W High mid Indication price Range Current stock price Company score 31,627원 39,199원 46,771원 54,344원 61,916원 High mid 50,900원 -38% -23% -8% 6.8% 21.6% -50% -40% -30% -20% -10% 0.% 10.% 20.% 30.% 0W 10,000W 20,000W 30,000W 40,000W 50,000W 60,000W 70,000W Low price Low mid Mid High mid High price Indication price chart (Consolidated) Indication price samsung electronics Gap samsung electronics
- 2. [Price for scheduled purchasing] Arbitrarily made Algorithm stocks Trading Strategies (consolidated) 005930 Date Period Gap (Indication / stock) Color low price 31,627 W 31,627 W ~ 0 W -38 % 496,535 W 16 Low mid 39,199 W 39,199 W ~ 31,627 W -23 % 301,450 W 8 Mid 46,771 W 46,771 W ~ 39,199 W -8 % 106,366 W 2 High mid 54,344 W 54,344 W ~ 46,771 W 7 % -88,719 W -2 Suggested Purchase Amount 1,311,363 W Number of stocks purchased 26 Indication price Range Buying / Selling Buying / Selling [Stocks] High price 61,916 W 61,916 W~ ~ 54,344 W 22 % -283,803 W -5 2018-05-09 3 months Current stock price Evaluation Stock price rise probability score Investment opinion Prospective purchase amount 50,900 W High mid 36.0 Normal 3,500,000 W 46.3 42.4 48.2 32.1 39.2 44.5 2017.12.08 2018.01.10 2018.02.07 2018.03.12 2018.04.09 2018.05.09 Stock price rise probability score A Sector 49.2 44.5 44.8 47.7 45.0 46.5 36.0B Sector 43.3 40.4 51.7 47.7 33.3 42.5 Total average 2018.02.07 2018.03.12 2018.04.09 2018.05.09 Total of increase rate Total score A Sector -11 % 1 % 6 % -6 % 3 % -3 % 46.0B Sector -7 % 22 % -8 % -43 % 22 % Total average -9 % 12 % -50 % 18 % 12 % 2018.01.10 49 44 45 48 45 46 43 40 52 48 33 43 46 42 48 32 39 44 0 10 20 30 40 50 60 2017.12.08 2018.01.10 2018.02.07 2018.03.12 2018.04.09 2018.05.09 Stock price rise probability score A sector B sector Total average -11% 1% 6% -6% 3% -7% 22% -8% -43% 22% -9% 12% -50% 18% 12% -60% -50% -40% -30% -20% -10% 0% 10% 20% 30% 2018.01.10 2018.02.07 2018.03.12 2018.04.09 2018.05.09 Increase rate of stock price rise A sector B sector Total average samsung electronics
- 3. 정보와 완전 정보 결 투자판단 있습니 위배 무단으 숙지하 Compliance notice ① The information provided by The Algorithm Company Analysis Consulting is obtained through reliable data and information and The Algorithm Company Analysis Program (TACAP), but its accuracy or completeness are not guaranteed. Furthermore, it may change over time.Therefore, we are not legally responsible for the results of the data provided by The Algorithm Company Analysis Consulting because of information errors or omissions. ② The Algorithm Company Analysis Consulting and all the information provided on it site are reference materials for investment decisions and the final responsibility of investment is up to users utilizing this information. ③ The Algorithm Company Analysis Consulting and its site do not do anything that violates the related laws such as discretionary transaction. ④ Users can not reallocate and recycle the information provided by The Algorithm Company Analysis Consulting firm let alone the information provided by its Site. ⑤ Be sure to know about application period of this algorithm analysis report in order to improve its accuracy. Tel : 070 - 4667 - 5009 Email : tacac@tacac.co.kr Homepage : tacac.co.kr Blog : tacac.blog.me SERVICES M&A, IPO, RECOVER, CORPORATE RESTRUCTURING, MANAGEMENT OF TECHNOLOGY, BUSINESS STRATEGY, FAMILY BUSINESS Request : http://tacac.co.kr/?page_id=1374 ① Consulting The Algori accuracy o change ove results of Consulting ② informatio investmen up ③ do anythin transaction ④ The Algori informatio ⑤ analysis re