CJ logistics-000120-Algorithm Investment Report
•
1 like•140 views

CJ logistics-000120-Algorithm Investment Report
![[Price for scheduled purchasing]
Arbitrarily made
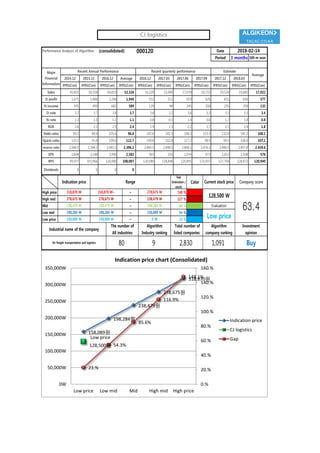
Algorithm stocks Trading Strategies (consolidated) 000120 Date
Period
Gap
(Indication /
stock)
Color
low price 158,089 W 158,089 W ~ 0 W 23 % -1,065,877 W -7
Low mid 198,284 W 198,284 W ~ 158,089 W 54 % -2,513,846 W -13
Mid 238,479 W 238,479 W ~ 198,284 W 86 % -3,961,816 W -17
High mid 278,675 W 278,675 W ~ 238,479 W 117 % -5,409,785 W All selling
Suggested Purchase
Amount 4,628,995 W
Number of stocks
purchased 36
Indication price Range Buying / Selling Buying / Selling [Stocks]
High price 318,870 W 318,870 W~ ~ 278,675 W 148 % -6,857,755 W All selling
2018-02-14
3 months
Current stock price Evaluation
Stock price rise
probability score
Investment opinion Prospective purchase amount
128,500 W Low price 44.7 Buy 10,000,000 W
38.5 36.8 44.5 26.3 46.1 33.9
2017.09.13 2017.10.19 2017.11.16 2017.12.14 2018.01.16 2018.02.13
Stock price rise
probability score
A Sector 44.9 41.8 46.6 43.9 50.1 45.7
44.7B Sector 32.1 31.7 42.5 43.9 42.1 22.1
Total average
2017.11.16 2017.12.14 2018.01.16 2018.02.13
Total of
increase rate
Total score
A Sector -7 % 10 % -6 % 12 % -10 %
-10 % 45.0B Sector -1 % 25 % 3 % -4 % -91 %
Total average -5 % 17 % -70 % 43 % -36 %
2017.10.19
45
42
47
44
50
46
32 32
43 44 42
22
38 37
45
26
46
34
0
10
20
30
40
50
60
2017.09.13 2017.10.19 2017.11.16 2017.12.14 2018.01.16 2018.02.13
Stock price rise probability score
A sector
B sector
Total average
-7%
10%
-6%
12%
-10%
-1%
25%
3%
-4%
-91%
-5%
17%
-70%
43%
-36%
-100%
-80%
-60%
-40%
-20%
0%
20%
40%
60%
2017.10.19 2017.11.16 2017.12.14 2018.01.16 2018.02.13
Increase rate of stock price rise
A sector
B sector
Total average
CJ logistics](data:image/gif;base64,R0lGODlhAQABAIAAAAAAAP///yH5BAEAAAAALAAAAAABAAEAAAIBRAA7)
Recommended
Recommended
More Related Content
What's hot
What's hot (20)
Similar to CJ logistics-000120-Algorithm Investment Report
Similar to CJ logistics-000120-Algorithm Investment Report (19)
More from 알고리즘 기업분석 컨설팅-알기컨,algikeon
More from 알고리즘 기업분석 컨설팅-알기컨,algikeon (20)
Recently uploaded
Recently uploaded (20)
CJ logistics-000120-Algorithm Investment Report
- 1. Performance Analysis of Algorithm (consolidated) 000120 Date Period 3 months 100-m won 2014.12 2015.12 2016.12 Average 2016.12 2017.03 2017.06 2017.09 2017.12 2018.03 IFRS(Con) IFRS(Con) IFRS(Con) IFRS(Con) IFRS(Con) IFRS(Con) IFRS(Con) IFRS(Con) IFRS(Con) IFRS(Con) IFRS(Con) Sales 45,601 50,558 60,819 52,326 16,329 15,949 17,078 18,732 19,524 19,685 17,022 O-profit 1,671 1,866 2,284 1,940 552 511 619 626 651 656 577 N-income 595 490 682 589 129 44 245 108 235 358 132 O-rate 3.7 3.7 3.8 3.7 3.4 3.2 3.6 3.3 3.3 3.3 3.4 N-rate 1.3 1.0 1.1 1.1 0.8 0.3 1.4 0.6 1.2 1.8 0.8 ROE 2.6 2.1 2.5 2.4 1.9 1.3 2.2 1.7 2.1 2.4 1.8 Debt-ratio 99.2 89.8 101.6 96.8 101.6 101.3 106.3 123.3 132.0 141.2 108.1 Quick-ratio 133.1 95.4 109.6 112.7 109.6 102.8 117.2 98.9 99.5 106.0 107.1 reserve-ratio 2,346.5 2,396.2 2,445.5 2,396.1 2,445.5 2,448.5 2,468.1 2,476.2 2,486.9 2,497.8 2,459.6 EPS 2,608 2,148 2,990 2,582 565 193 1,074 473 1,012 1,508 576 BPS 99,977 103,966 120,080 108,007 120,080 118,848 120,895 123,937 127,704 128,872 120,940 Dividends 0 0 0 0 Major Financial Information Recent Annual Performance Recent quarterly performance Estimate Average 2018-02-14 Gap (Indication / stock) Color High price ~ 148 % High mid ~ 117 % Mid ~ 86 % Low mid ~ 54 % Low price ~ 23 % Buy 158,089 W 158,089 W 0 W Industrial name of the company The number of All industries Algorithm Industry ranking Total number of listed companies Algorithm company ranking Investment opinion Air freight transportation and logistics 80 9 2,830 1,091 278,675 W 278,675 W 238,479 W 238,479 W 238,479 W 198,284 W Evaluation 318,870 W 318,870 W~ 278,675 W 128,500 W 63.4198,284 W 198,284 W 158,089 W Low price Indication price Range Current stock price Company score 158,089원 198,284원 238,479원 278,675원 318,870원 Low price 128,500원 23.% 54.3% 85.6% 116.9% 148.1% 0.% 20.% 40.% 60.% 80.% 100.% 120.% 140.% 160.% 0W 50,000W 100,000W 150,000W 200,000W 250,000W 300,000W 350,000W Low price Low mid Mid High mid High price Indication price chart (Consolidated) Indication price CJ logistics Gap CJ logistics
- 2. [Price for scheduled purchasing] Arbitrarily made Algorithm stocks Trading Strategies (consolidated) 000120 Date Period Gap (Indication / stock) Color low price 158,089 W 158,089 W ~ 0 W 23 % -1,065,877 W -7 Low mid 198,284 W 198,284 W ~ 158,089 W 54 % -2,513,846 W -13 Mid 238,479 W 238,479 W ~ 198,284 W 86 % -3,961,816 W -17 High mid 278,675 W 278,675 W ~ 238,479 W 117 % -5,409,785 W All selling Suggested Purchase Amount 4,628,995 W Number of stocks purchased 36 Indication price Range Buying / Selling Buying / Selling [Stocks] High price 318,870 W 318,870 W~ ~ 278,675 W 148 % -6,857,755 W All selling 2018-02-14 3 months Current stock price Evaluation Stock price rise probability score Investment opinion Prospective purchase amount 128,500 W Low price 44.7 Buy 10,000,000 W 38.5 36.8 44.5 26.3 46.1 33.9 2017.09.13 2017.10.19 2017.11.16 2017.12.14 2018.01.16 2018.02.13 Stock price rise probability score A Sector 44.9 41.8 46.6 43.9 50.1 45.7 44.7B Sector 32.1 31.7 42.5 43.9 42.1 22.1 Total average 2017.11.16 2017.12.14 2018.01.16 2018.02.13 Total of increase rate Total score A Sector -7 % 10 % -6 % 12 % -10 % -10 % 45.0B Sector -1 % 25 % 3 % -4 % -91 % Total average -5 % 17 % -70 % 43 % -36 % 2017.10.19 45 42 47 44 50 46 32 32 43 44 42 22 38 37 45 26 46 34 0 10 20 30 40 50 60 2017.09.13 2017.10.19 2017.11.16 2017.12.14 2018.01.16 2018.02.13 Stock price rise probability score A sector B sector Total average -7% 10% -6% 12% -10% -1% 25% 3% -4% -91% -5% 17% -70% 43% -36% -100% -80% -60% -40% -20% 0% 20% 40% 60% 2017.10.19 2017.11.16 2017.12.14 2018.01.16 2018.02.13 Increase rate of stock price rise A sector B sector Total average CJ logistics
- 3. 정보와 완전 정보 결 투자판단 있습니 위배 무단으 숙지하 Compliance notice ① The information provided by The Algorithm Company Analysis Consulting is obtained through reliable data and information and The Algorithm Company Analysis Program (TACAP), but its accuracy or completeness are not guaranteed. Furthermore, it may change over time.Therefore, we are not legally responsible for the results of the data provided by The Algorithm Company Analysis Consulting because of information errors or omissions. ② The Algorithm Company Analysis Consulting and all the information provided on it site are reference materials for investment decisions and the final responsibility of investment is up to users utilizing this information. ③ The Algorithm Company Analysis Consulting and its site do not do anything that violates the related laws such as discretionary transaction. ④ Users can not reallocate and recycle the information provided by The Algorithm Company Analysis Consulting firm let alone the information provided by its Site. ⑤ Be sure to know about application period of this algorithm analysis report in order to improve its accuracy. Tel : 070 - 4667 - 5009 Email : tacac@tacac.co.kr Homepage : tacac.co.kr Blog : tacac.blog.me SERVICES M&A, IPO, CORPORATE RESTRUCTURING, MANAGEMENT OF TECHNOLOGY, BUSINESS STRATEGY, FAMILY BUSINESS Request : http://tacac.co.kr/?page_id=1374 ① Consulting The Algori accuracy o change ove results of Consulting ② informatio investmen up ③ do anythin transaction ④ The Algori informatio ⑤ analysis re