cj cgv-079160-Algorithm Investment Report
•
0 likes•103 views

cj cgv-079160-Algorithm Investment Report
![[Price for scheduled purchasing]
Arbitrarily made
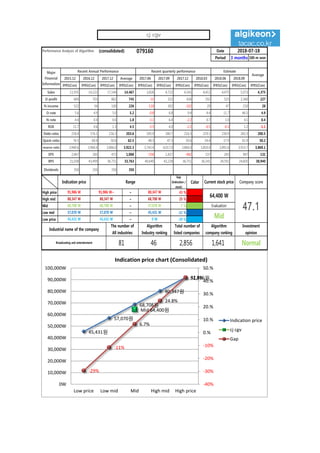
Algorithm stocks Trading Strategies (consolidated) 079160 Date
Period
Gap
(Indication /
stock)
Color
low price 45,431 W 45,431 W ~ 0 W -29 % 631,109 W 14
Low mid 57,070 W 57,070 W ~ 45,431 W -11 % 243,883 W 4
Mid 68,708 W 68,708 W ~ 57,070 W 7 % -143,342 W -2
High mid 80,347 W 80,347 W ~ 68,708 W 25 % -530,567 W -7
Suggested Purchase
Amount 2,142,591 W
Number of stocks
purchased 33
Indication price Range Buying / Selling Buying / Selling [Stocks]
High price 91,986 W 91,986 W~ ~ 80,347 W 43 % -917,792 W -10
2018-07-18
3 months
Current stock price Evaluation
Stock price rise
probability score
Investment opinion Prospective purchase amount
64,400 W Mid 44.8 Normal 6,800,000 W
32.4 34.5 45.3 36.7 43.7 40.3
2018.02.19 2018.03.20 2018.04.17 2018.05.17 2018.06.19 2018.07.17
Stock price rise
probability score
A Sector 48.6 44.8 52.7 46.0 46.1 47.2
44.8B Sector 16.3 24.2 37.9 46.0 41.3 33.3
Total average
2018.04.17 2018.05.17 2018.06.19 2018.07.17
Total of
increase rate
Total score
A Sector -8 % 15 % -15 % 0 % 2 %
3 % 51.7B Sector 33 % 36 % 18 % -11 % -24 %
Total average 6 % 24 % -24 % 16 % -9 %
2018.03.20
49
45
53
46 46 47
16
24
38
46
41
3332 34
45
37
44
40
0
10
20
30
40
50
60
2018.02.19 2018.03.20 2018.04.17 2018.05.17 2018.06.19 2018.07.17
Stock price rise probability score
A sector
B sector
Total average
-8%
15%
-15%
0% 2%
33%
36%
18%
-11%
-24%
6%
24%
-24%
16%
-9%
-30%
-20%
-10%
0%
10%
20%
30%
40%
2018.03.20 2018.04.17 2018.05.17 2018.06.19 2018.07.17
Increase rate of stock price rise
A sector
B sector
Total average
cj cgv](data:image/gif;base64,R0lGODlhAQABAIAAAAAAAP///yH5BAEAAAAALAAAAAABAAEAAAIBRAA7)
Recommended
Recommended
More Related Content
What's hot
What's hot (20)
Similar to cj cgv-079160-Algorithm Investment Report
Similar to cj cgv-079160-Algorithm Investment Report (20)
More from 알고리즘 기업분석 컨설팅-알기컨,algikeon
More from 알고리즘 기업분석 컨설팅-알기컨,algikeon (20)
Recently uploaded
Recently uploaded (20)
cj cgv-079160-Algorithm Investment Report
- 1. Performance Analysis of Algorithm (consolidated) 079160 Date Period 3 months 100-m won 2015.12 2016.12 2017.12 Average 2017.06 2017.09 2017.12 2018.03 2018.06 2018.09 IFRS(Con) IFRS(Con) IFRS(Con) IFRS(Con) IFRS(Con) IFRS(Con) IFRS(Con) IFRS(Con) IFRS(Con) IFRS(Con) IFRS(Con) Sales 11,935 14,322 17,144 14,467 3,826 4,722 4,541 4,412 4,475 5,073 4,375 O-profit 669 703 862 745 -31 322 426 192 525 2,360 227 N-income 522 56 100 226 -118 302 -102 29 47 210 28 O-rate 5.6 4.9 5.0 5.2 -0.8 6.8 9.4 4.4 11.7 46.5 4.9 N-rate 4.4 0.4 0.6 1.8 -3.1 6.4 -2.2 0.7 1.0 4.1 0.4 ROE 11.7 0.6 1.3 4.5 -5.5 4.0 -2.2 -0.5 -0.3 1.2 -1.1 Debt-ratio 218.4 176.1 216.3 203.6 185.9 180.7 216.3 219.1 230.9 243.3 200.5 Quick-ratio 76.5 60.4 50.6 62.5 48.3 47.3 50.6 54.4 57.9 61.9 50.2 reserve-ratio 3,940.6 3,960.4 3,866.0 3,922.3 3,743.4 4,017.0 3,866.0 3,850.0 3,891.6 3,933.7 3,869.1 EPS 2,467 265 473 1,068 -558 1,427 -482 137 243 967 131 BPS 21,038 43,499 36,751 33,763 40,640 42,228 36,751 36,141 24,591 24,605 38,940 Dividends 350 350 350 350 Major Financial Information Recent Annual Performance Recent quarterly performance Estimate Average 2018-07-18 Gap (Indication / stock) Color High price ~ 43 % High mid ~ 25 % Mid ~ 7 % Low mid ~ -11 % Low price ~ -29 % Normal 45,431 W 45,431 W 0 W Industrial name of the company The number of All industries Algorithm Industry ranking Total number of listed companies Algorithm company ranking Investment opinion Broadcasting and entertainment 81 46 2,856 1,641 80,347 W 80,347 W 68,708 W 68,708 W 68,708 W 57,070 W Evaluation 91,986 W 91,986 W~ 80,347 W 64,400 W 47.157,070 W 57,070 W 45,431 W Mid Indication price Range Current stock price Company score 45,431원 57,070원 68,708원 80,347원 91,986원 Mid 64,400원 -29% -11% 6.7% 24.8% 42.8% -40% -30% -20% -10% 0.% 10.% 20.% 30.% 40.% 50.% 0W 10,000W 20,000W 30,000W 40,000W 50,000W 60,000W 70,000W 80,000W 90,000W 100,000W Low price Low mid Mid High mid High price Indication price chart (Consolidated) Indication price cj cgv Gap cj cgv
- 2. [Price for scheduled purchasing] Arbitrarily made Algorithm stocks Trading Strategies (consolidated) 079160 Date Period Gap (Indication / stock) Color low price 45,431 W 45,431 W ~ 0 W -29 % 631,109 W 14 Low mid 57,070 W 57,070 W ~ 45,431 W -11 % 243,883 W 4 Mid 68,708 W 68,708 W ~ 57,070 W 7 % -143,342 W -2 High mid 80,347 W 80,347 W ~ 68,708 W 25 % -530,567 W -7 Suggested Purchase Amount 2,142,591 W Number of stocks purchased 33 Indication price Range Buying / Selling Buying / Selling [Stocks] High price 91,986 W 91,986 W~ ~ 80,347 W 43 % -917,792 W -10 2018-07-18 3 months Current stock price Evaluation Stock price rise probability score Investment opinion Prospective purchase amount 64,400 W Mid 44.8 Normal 6,800,000 W 32.4 34.5 45.3 36.7 43.7 40.3 2018.02.19 2018.03.20 2018.04.17 2018.05.17 2018.06.19 2018.07.17 Stock price rise probability score A Sector 48.6 44.8 52.7 46.0 46.1 47.2 44.8B Sector 16.3 24.2 37.9 46.0 41.3 33.3 Total average 2018.04.17 2018.05.17 2018.06.19 2018.07.17 Total of increase rate Total score A Sector -8 % 15 % -15 % 0 % 2 % 3 % 51.7B Sector 33 % 36 % 18 % -11 % -24 % Total average 6 % 24 % -24 % 16 % -9 % 2018.03.20 49 45 53 46 46 47 16 24 38 46 41 3332 34 45 37 44 40 0 10 20 30 40 50 60 2018.02.19 2018.03.20 2018.04.17 2018.05.17 2018.06.19 2018.07.17 Stock price rise probability score A sector B sector Total average -8% 15% -15% 0% 2% 33% 36% 18% -11% -24% 6% 24% -24% 16% -9% -30% -20% -10% 0% 10% 20% 30% 40% 2018.03.20 2018.04.17 2018.05.17 2018.06.19 2018.07.17 Increase rate of stock price rise A sector B sector Total average cj cgv
- 3. 정보와 완전 정보 결 투자판단 있습니 위배 무단으 숙지하 Compliance notice ① The information provided by The Algorithm Company Analysis Consulting is obtained through reliable data and information and The Algorithm Company Analysis Program (TACAP), but its accuracy or completeness are not guaranteed. Furthermore, it may change over time.Therefore, we are not legally responsible for the results of the data provided by The Algorithm Company Analysis Consulting because of information errors or omissions. ② The Algorithm Company Analysis Consulting and all the information provided on it site are reference materials for investment decisions and the final responsibility of investment is up to users utilizing this information. ③ The Algorithm Company Analysis Consulting and its site do not do anything that violates the related laws such as discretionary transaction. ④ Users can not reallocate and recycle the information provided by The Algorithm Company Analysis Consulting firm let alone the information provided by its Site. ⑤ Be sure to know about application period of this algorithm analysis report in order to improve its accuracy. Tel : 070 - 4667 - 5009 Email : tacac@tacac.co.kr Homepage : tacac.co.kr Blog : tacac.blog.me SERVICES M&A, IPO, RECOVER, CORPORATE RESTRUCTURING, MANAGEMENT OF TECHNOLOGY, BUSINESS STRATEGY, FAMILY BUSINESS Request : http://tacac.co.kr/?page_id=1374 ① Consulting The Algori accuracy o change ove results of Consulting ② informatio investmen up ③ do anythin transaction ④ The Algori informatio ⑤ analysis re