studiodragon-253450-Algorithm Investment Report
•
0 likes•80 views

This document provides a summary of financial performance and stock price analysis for a company over several quarters and years. It includes tables with metrics like sales, operating profit, net income, debt ratios, and stock prices. A chart shows the company's stock indication price range and current price. Another section analyzes the company's stock price rise probability score over time and compared to industry sectors. It concludes with a suggested purchase amount and number of stocks to buy based on the analysis.
![[Price for scheduled purchasing]
Arbitrarily made
Algorithm stocks Trading Strategies (consolidated) 253450 Date
Period
Gap
(Indication /
stock)
Color
2018-11-21
3 months
Current stock price Evaluation
Stock price rise
probability score
Investment opinion Prospective purchase amount
105,000 W High price 36.0 Normal 5,000,000 W
Suggested Purchase
Amount 1,472,877 W
Number of stocks
purchased 14
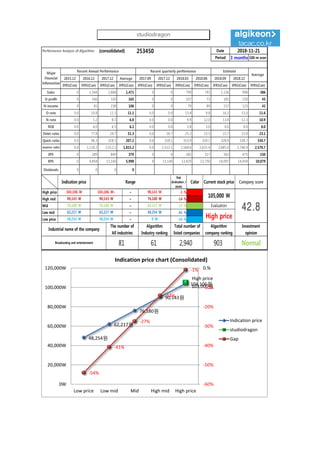
Indication price Range Buying / Selling Buying / Selling [Stocks]
High price 104,106 W 104,106 W~ ~ 90,143 W -1 % 12,538 W 0
High mid 90,143 W 90,143 W ~ 76,180 W -14 % 208,404 W 2
Mid 76,180 W 76,180 W ~ 62,217 W -27 % 404,271 W 5
Low mid 62,217 W 62,217 W ~ 48,254 W -41 % 600,138 W 10
low price 48,254 W 48,254 W ~ 0 W -54 % 796,005 W 16
Stock price rise
probability score
A Sector 46.3 46.8 48.2 44.2 45.0 45.9
36.0B Sector 20.4 35.8 37.5 44.2 15.0 22.1
Total average
2018.06.25 2018.07.23 2018.08.21 2018.09.18 2018.10.23 2018.11.20
33.4 41.3 42.9 38.8 30.0 34.0
-29 % 12 %
2018.07.23 2018.08.21 2018.09.18 2018.10.23 2018.11.20
Total of
increase rate
Total score
A Sector 1 % 3 % -9 % 2 % 2 %
-1 % 50.0B Sector 43 % 4 % 15 % -195 % 32 %
Total average 19 % 4 % -11 %
46 47 48
44 45 46
20
36 38
44
15
22
33
41 43
39
30
34
0
10
20
30
40
50
60
2018.06.25 2018.07.23 2018.08.21 2018.09.18 2018.10.23 2018.11.20
Stock price rise probability score
A sector
B sector
Total average
1% 3% -9% 2% 2%
43%
4% 15%
-195%
32%19%
4%
-11%
-29%
12%
-250%
-200%
-150%
-100%
-50%
0%
50%
100%
2018.07.23 2018.08.21 2018.09.18 2018.10.23 2018.11.20
Increase rate of stock price rise
A sector
B sector
Total average
studiodragon](data:image/gif;base64,R0lGODlhAQABAIAAAAAAAP///yH5BAEAAAAALAAAAAABAAEAAAIBRAA7)
Recommended
Recommended
More Related Content
What's hot
What's hot (20)
Similar to studiodragon-253450-Algorithm Investment Report
Similar to studiodragon-253450-Algorithm Investment Report (20)
More from 알고리즘 기업분석 컨설팅-알기컨,algikeon
More from 알고리즘 기업분석 컨설팅-알기컨,algikeon (20)
Recently uploaded
Recently uploaded (20)
studiodragon-253450-Algorithm Investment Report
- 1. Performance Analysis of Algorithm (consolidated) 253450 Date Period 3 months 100-m won 2015.12 2016.12 2017.12 Average 2017.09 2017.12 2018.03 2018.06 2018.09 2018.12 IFRS(Con) IFRS(Con) IFRS(Con) IFRS(Con) IFRS(Con) IFRS(Con) IFRS(Con) IFRS(Con) IFRS(Con) IFRS(Con) IFRS(Con) Sales 0 1,544 2,868 1,471 0 0 799 743 1,136 996 386 O-profit 0 166 330 165 0 0 107 73 185 150 45 N-income 0 81 238 106 0 0 79 89 157 123 42 O-rate 0.0 10.8 11.5 11.1 0.0 0.0 13.4 9.8 16.3 15.0 11.6 N-rate 0.0 5.2 8.3 6.8 0.0 0.0 9.9 12.0 13.8 12.3 10.9 ROE 0.0 6.0 6.5 6.2 0.0 0.0 2.8 3.0 0.0 0.0 0.0 Debt-ratio 0.0 77.8 24.7 51.3 0.0 24.7 21.2 23.5 22.7 22.0 23.1 Quick-ratio 0.0 96.3 318.1 207.2 0.0 318.1 353.9 320.1 328.9 338.7 330.7 reserve-ratio 0.0 1,118.2 2,512.1 1,815.2 0.0 2,512.1 2,568.6 2,631.4 2,685.0 2,746.9 2,570.7 EPS 0 289 849 379 0 0 282 317 562 475 150 BPS 0 4,854 13,140 5,998 0 13,140 13,429 13,750 14,097 14,454 10,079 Dividends 0 0 0 0 2018-11-21 Major Financial Information Recent Annual Performance Recent quarterly performance Estimate Average Gap (Indication / stock) Color High price ~ -1 % High mid ~ -14 % Mid ~ -27 % Low mid ~ -41 % Low price ~ -54 % Indication price Range Current stock price Company score 90,143 W 90,143 W 76,180 W 76,180 W 76,180 W 62,217 W Evaluation 104,106 W 104,106 W~ 90,143 W 105,000 W 42.862,217 W 62,217 W 48,254 W High price Normal 48,254 W 48,254 W 0 W Industrial name of the company The number of All industries Algorithm Industry ranking Total number of listed companies Algorithm company ranking Investment opinion Broadcasting and entertainment 81 61 2,940 903 48,254원 62,217원 76,180원 90,143원 104,106원 High price 105,000원 -54% -41% -27% -14% -1% -60% -50% -40% -30% -20% -10% 0.% 0W 20,000W 40,000W 60,000W 80,000W 100,000W 120,000W Low price Low mid Mid High mid High price Indication price chart (Consolidated) Indication price studiodragon Gap studiodragon
- 2. [Price for scheduled purchasing] Arbitrarily made Algorithm stocks Trading Strategies (consolidated) 253450 Date Period Gap (Indication / stock) Color 2018-11-21 3 months Current stock price Evaluation Stock price rise probability score Investment opinion Prospective purchase amount 105,000 W High price 36.0 Normal 5,000,000 W Suggested Purchase Amount 1,472,877 W Number of stocks purchased 14 Indication price Range Buying / Selling Buying / Selling [Stocks] High price 104,106 W 104,106 W~ ~ 90,143 W -1 % 12,538 W 0 High mid 90,143 W 90,143 W ~ 76,180 W -14 % 208,404 W 2 Mid 76,180 W 76,180 W ~ 62,217 W -27 % 404,271 W 5 Low mid 62,217 W 62,217 W ~ 48,254 W -41 % 600,138 W 10 low price 48,254 W 48,254 W ~ 0 W -54 % 796,005 W 16 Stock price rise probability score A Sector 46.3 46.8 48.2 44.2 45.0 45.9 36.0B Sector 20.4 35.8 37.5 44.2 15.0 22.1 Total average 2018.06.25 2018.07.23 2018.08.21 2018.09.18 2018.10.23 2018.11.20 33.4 41.3 42.9 38.8 30.0 34.0 -29 % 12 % 2018.07.23 2018.08.21 2018.09.18 2018.10.23 2018.11.20 Total of increase rate Total score A Sector 1 % 3 % -9 % 2 % 2 % -1 % 50.0B Sector 43 % 4 % 15 % -195 % 32 % Total average 19 % 4 % -11 % 46 47 48 44 45 46 20 36 38 44 15 22 33 41 43 39 30 34 0 10 20 30 40 50 60 2018.06.25 2018.07.23 2018.08.21 2018.09.18 2018.10.23 2018.11.20 Stock price rise probability score A sector B sector Total average 1% 3% -9% 2% 2% 43% 4% 15% -195% 32%19% 4% -11% -29% 12% -250% -200% -150% -100% -50% 0% 50% 100% 2018.07.23 2018.08.21 2018.09.18 2018.10.23 2018.11.20 Increase rate of stock price rise A sector B sector Total average studiodragon
- 3. 정보와 완전 정보 결 투자판단 있습니 위배 무단으 숙지하 Compliance notice ① The information provided by The Algorithm Company Analysis Consulting is obtained through reliable data and information and The Algorithm Company Analysis Program (TACAP), but its accuracy or completeness are not guaranteed. Furthermore, it may change over time.Therefore, we are not legally responsible for the results of the data provided by The Algorithm Company Analysis Consulting because of information errors or omissions. ② The Algorithm Company Analysis Consulting and all the information provided on it site are reference materials for investment decisions and the final responsibility of investment is up to users utilizing this information. ③ The Algorithm Company Analysis Consulting and its site do not do anything that violates the related laws such as discretionary transaction. ④ Users can not reallocate and recycle the information provided by The Algorithm Company Analysis Consulting firm let alone the information provided by its Site. ⑤ Be sure to know about application period of this algorithm analysis report in order to improve its accuracy. Tel : 070 - 4667 - 5009 Email : tacac@tacac.co.kr Homepage : tacac.co.kr Blog : tacac.blog.me SERVICES EDUCATION, M&A, IPO, RECOVER, CORPORATE RESTRUCTURING, MANAGEMENT OF TECHNOLOGY, BUSINESS STRATEGY, FAMILY BUSINESS Request : http://tacac.co.kr/?page_id=1374 ① Consulting The Algori accuracy o change ove results of Consulting ② informatio investmen up ③ do anythin transaction ④ The Algori informatio ⑤ analysis re