Analysis of Algorithm Performance and Financial Indicators
•
0 likes•91 views

This document provides performance data and analysis for the Algorithm company over several time periods. It includes financial metrics such as sales, operating profit, net income, debt ratio, and earnings per share from 2015-2019. It also evaluates the company's current stock price compared to different price ranges and provides a stock purchasing strategy based on the analysis.
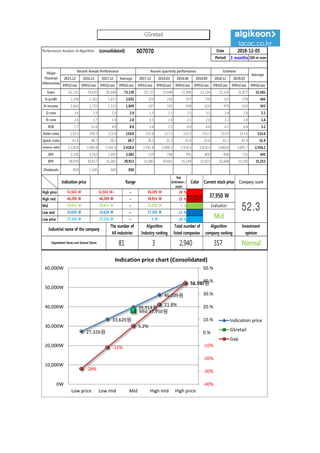
![[Price for scheduled purchasing]
Arbitrarily made
Algorithm stocks Trading Strategies (consolidated) 007070 Date
Period
Gap
(Indication /
stock)
Color
2018-12-05
3 months
Current stock price Evaluation
Stock price rise
probability score
Investment opinion Prospective purchase amount
37,950 W Mid 40.0 Normal 6,500,000 W
Suggested Purchase
Amount 2,611,163 W
Number of stocks
purchased 69
Indication price Range Buying / Selling Buying / Selling [Stocks]
High price 52,503 W 52,503 W~ ~ 46,209 W 38 % -1,001,323 W -19
High mid 46,209 W 46,209 W ~ 39,914 W 22 % -568,245 W -12
Mid 39,914 W 39,914 W ~ 33,620 W 5 % -135,167 W -3
Low mid 33,620 W 33,620 W ~ 27,326 W -11 % 297,911 W 9
low price 27,326 W 27,326 W ~ 0 W -28 % 730,990 W 27
Stock price rise
probability score
A Sector 48.3 46.2 48.8 44.8 48.2 43.9
40.0B Sector 36.7 28.8 38.3 44.8 36.3 22.1
Total average
2018.07.09 2018.08.06 2018.09.04 2018.10.08 2018.11.06 2018.12.04
42.5 37.5 43.6 52.1 42.2 33.0
-23 % -28 %
2018.08.06 2018.09.04 2018.10.08 2018.11.06 2018.12.04
Total of
increase rate
Total score
A Sector -5 % 5 % -9 % 7 % -10 %
-7 % 41.7B Sector -28 % 25 % 14 % -24 % -64 %
Total average -13 % 14 % 16 %
48 46 49
45
48
44
37
29
38
45
36
22
43
37
44
52
42
33
0
10
20
30
40
50
60
2018.07.09 2018.08.06 2018.09.04 2018.10.08 2018.11.06 2018.12.04
Stock price rise probability score
A sector
B sector
Total average
-5%
5%
-9%
7%
-10%
-28%
25%
14%
-24%
-64%
-13%
14% 16%
-23%
-28%
-80%
-60%
-40%
-20%
0%
20%
40%
2018.08.06 2018.09.04 2018.10.08 2018.11.06 2018.12.04
Increase rate of stock price rise
A sector
B sector
Total average
GSretail](data:image/gif;base64,R0lGODlhAQABAIAAAAAAAP///yH5BAEAAAAALAAAAAABAAEAAAIBRAA7)
Recommended
Recommended
More Related Content
What's hot
What's hot (20)
Similar to Analysis of Algorithm Performance and Financial Indicators
Similar to Analysis of Algorithm Performance and Financial Indicators (20)
More from 알고리즘 기업분석 컨설팅-알기컨,algikeon
More from 알고리즘 기업분석 컨설팅-알기컨,algikeon (20)
Recently uploaded
Recently uploaded (20)
Analysis of Algorithm Performance and Financial Indicators
- 1. Performance Analysis of Algorithm (consolidated) 007070 Date Period 3 months 100-m won 2015.12 2016.12 2017.12 Average 2017.12 2018.03 2018.06 2018.09 2018.12 2019.03 IFRS(Con) IFRS(Con) IFRS(Con) IFRS(Con) IFRS(Con) IFRS(Con) IFRS(Con) IFRS(Con) IFRS(Con) IFRS(Con) IFRS(Con) Sales 62,731 74,020 82,666 73,139 20,731 19,948 21,989 23,254 22,154 21,877 21,481 O-profit 2,258 2,181 1,657 2,032 310 216 557 776 523 578 465 N-income 1,662 2,735 1,151 1,849 107 191 458 616 478 619 343 O-rate 3.6 2.9 2.0 2.9 1.5 1.1 2.5 3.3 2.4 2.6 2.1 N-rate 2.6 3.7 1.4 2.6 0.5 1.0 2.1 2.6 2.2 2.8 1.6 ROE 7.7 11.6 4.8 8.0 1.8 2.5 4.0 4.6 4.1 4.4 3.2 Debt-ratio 119.3 100.3 112.8 110.8 112.8 117.2 113.2 115.3 113.9 112.6 114.6 Quick-ratio 41.8 48.7 28.5 39.7 28.5 31.3 32.0 35.6 41.2 47.9 31.9 reserve-ratio 2,228.8 2,484.4 2,541.8 2,418.4 2,541.8 2,498.2 2,554.3 2,630.3 2,660.8 2,691.7 2,556.1 EPS 2,158 3,552 1,495 2,402 139 248 595 800 656 731 445 BPS 28,039 30,617 31,082 29,913 31,082 30,661 31,244 32,023 32,668 33,326 31,253 Dividends 850 1,100 600 850 2018-12-05 Major Financial Information Recent Annual Performance Recent quarterly performance Estimate Average Gap (Indication / stock) Color High price ~ 38 % High mid ~ 22 % Mid ~ 5 % Low mid ~ -11 % Low price ~ -28 % Indication price Range Current stock price Company score 46,209 W 46,209 W 39,914 W 39,914 W 39,914 W 33,620 W Evaluation 52,503 W 52,503 W~ 46,209 W 37,950 W 52.333,620 W 33,620 W 27,326 W Mid Normal 27,326 W 27,326 W 0 W Industrial name of the company The number of All industries Algorithm Industry ranking Total number of listed companies Algorithm company ranking Investment opinion Department Stores and General Stores 81 3 2,940 357 27,326원 33,620원 39,914원 46,209원 52,503원 Mid 37,950원 -28% -11% 5.2% 21.8% 38.3% -40% -30% -20% -10% 0.% 10.% 20.% 30.% 40.% 50.% 0W 10,000W 20,000W 30,000W 40,000W 50,000W 60,000W Low price Low mid Mid High mid High price Indication price chart (Consolidated) Indication price GSretail Gap GSretail
- 2. [Price for scheduled purchasing] Arbitrarily made Algorithm stocks Trading Strategies (consolidated) 007070 Date Period Gap (Indication / stock) Color 2018-12-05 3 months Current stock price Evaluation Stock price rise probability score Investment opinion Prospective purchase amount 37,950 W Mid 40.0 Normal 6,500,000 W Suggested Purchase Amount 2,611,163 W Number of stocks purchased 69 Indication price Range Buying / Selling Buying / Selling [Stocks] High price 52,503 W 52,503 W~ ~ 46,209 W 38 % -1,001,323 W -19 High mid 46,209 W 46,209 W ~ 39,914 W 22 % -568,245 W -12 Mid 39,914 W 39,914 W ~ 33,620 W 5 % -135,167 W -3 Low mid 33,620 W 33,620 W ~ 27,326 W -11 % 297,911 W 9 low price 27,326 W 27,326 W ~ 0 W -28 % 730,990 W 27 Stock price rise probability score A Sector 48.3 46.2 48.8 44.8 48.2 43.9 40.0B Sector 36.7 28.8 38.3 44.8 36.3 22.1 Total average 2018.07.09 2018.08.06 2018.09.04 2018.10.08 2018.11.06 2018.12.04 42.5 37.5 43.6 52.1 42.2 33.0 -23 % -28 % 2018.08.06 2018.09.04 2018.10.08 2018.11.06 2018.12.04 Total of increase rate Total score A Sector -5 % 5 % -9 % 7 % -10 % -7 % 41.7B Sector -28 % 25 % 14 % -24 % -64 % Total average -13 % 14 % 16 % 48 46 49 45 48 44 37 29 38 45 36 22 43 37 44 52 42 33 0 10 20 30 40 50 60 2018.07.09 2018.08.06 2018.09.04 2018.10.08 2018.11.06 2018.12.04 Stock price rise probability score A sector B sector Total average -5% 5% -9% 7% -10% -28% 25% 14% -24% -64% -13% 14% 16% -23% -28% -80% -60% -40% -20% 0% 20% 40% 2018.08.06 2018.09.04 2018.10.08 2018.11.06 2018.12.04 Increase rate of stock price rise A sector B sector Total average GSretail
- 3. 정보와 완전 정보 결 투자판단 있습니 위배 무단으 숙지하 Compliance notice ① The information provided by The Algorithm Company Analysis Consulting is obtained through reliable data and information and The Algorithm Company Analysis Program (TACAP), but its accuracy or completeness are not guaranteed. Furthermore, it may change over time.Therefore, we are not legally responsible for the results of the data provided by The Algorithm Company Analysis Consulting because of information errors or omissions. ② The Algorithm Company Analysis Consulting and all the information provided on it site are reference materials for investment decisions and the final responsibility of investment is up to users utilizing this information. ③ The Algorithm Company Analysis Consulting and its site do not do anything that violates the related laws such as discretionary transaction. ④ Users can not reallocate and recycle the information provided by The Algorithm Company Analysis Consulting firm let alone the information provided by its Site. ⑤ Be sure to know about application period of this algorithm analysis report in order to improve its accuracy. Tel : 070 - 4667 - 5009 Email : tacac@tacac.co.kr Homepage : tacac.co.kr Blog : tacac.blog.me SERVICES EDUCATION, M&A, IPO, RECOVER, CORPORATE RESTRUCTURING, MANAGEMENT OF TECHNOLOGY, BUSINESS STRATEGY, FAMILY BUSINESS Request : http://tacac.co.kr/?page_id=1374 ① Consulting The Algori accuracy o change ove results of Consulting ② informatio investmen up ③ do anythin transaction ④ The Algori informatio ⑤ analysis re