hotelshilla-008770-Algorithm Investment Report
•
0 likes•47 views

This document provides a summary of financial performance and stock price analysis for a company called Algorithm over several periods. It includes tables with metrics like sales, profits, debt ratios, and stock prices quarterly from 2015-2018. A second section analyzes the company's stock price against an "indication price" and assigns it a probability score. It also calculates a suggested purchase amount and number of shares if investing at the current price of 73,000 won.
![[Price for scheduled purchasing]
Arbitrarily made
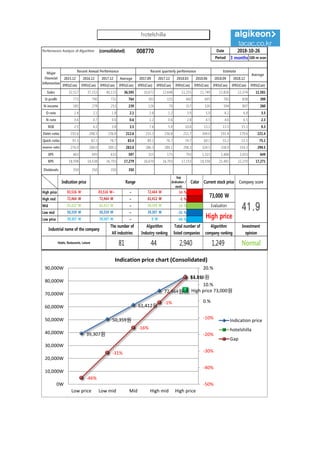
Algorithm stocks Trading Strategies (consolidated) 008770 Date
Period
Gap
(Indication /
stock)
Color
2018-10-26
3 months
Current stock price Evaluation
Stock price rise
probability score
Investment opinion Prospective purchase amount
73,000 W High price 35.4 Normal 5,000,000 W
Suggested Purchase
Amount 1,355,190 W
Number of stocks
purchased 19
Indication price Range Buying / Selling Buying / Selling [Stocks]
High price 83,516 W 83,516 W~ ~ 72,464 W 14 % -195,222 W -2
High mid 72,464 W 72,464 W ~ 61,412 W -1 % 9,954 W 0
Mid 61,412 W 61,412 W ~ 50,359 W -16 % 215,131 W 4
Low mid 50,359 W 50,359 W ~ 39,307 W -31 % 420,308 W 8
low price 39,307 W 39,307 W ~ 0 W -46 % 625,485 W 16
Stock price rise
probability score
A Sector 46.2 46.4 52.5 50.1 43.0 43.5
35.4B Sector 41.3 33.8 27.9 50.1 27.9 47.9
Total average
2018.05.28 2018.06.27 2018.07.25 2018.08.23 2018.09.20 2018.10.25
43.7 40.1 40.2 30.0 35.4 45.7
15 % 22 %
2018.06.27 2018.07.25 2018.08.23 2018.09.20 2018.10.25
Total of
increase rate
Total score
A Sector 0 % 12 % -5 % -17 % 1 %
-1 % 46.7B Sector -22 % -21 % 44 % -79 % 42 %
Total average -9 % 0 % -34 %
46 46
53 50
43 4441
34
28
50
28
48
44
40 40
30
35
46
0
10
20
30
40
50
60
2018.05.28 2018.06.27 2018.07.25 2018.08.23 2018.09.20 2018.10.25
Stock price rise probability score
A sector
B sector
Total average
0%
12%
-5%
-17%
1%
-22% -21%
44%
-79%
42%
-9%
0%
-34%
15%
22%
-100%
-80%
-60%
-40%
-20%
0%
20%
40%
60%
2018.06.27 2018.07.25 2018.08.23 2018.09.20 2018.10.25
Increase rate of stock price rise
A sector
B sector
Total average
hotelshilla](data:image/gif;base64,R0lGODlhAQABAIAAAAAAAP///yH5BAEAAAAALAAAAAABAAEAAAIBRAA7)
Recommended
Recommended
More Related Content
What's hot
What's hot (20)
Similar to hotelshilla-008770-Algorithm Investment Report
Similar to hotelshilla-008770-Algorithm Investment Report (17)
More from 알고리즘 기업분석 컨설팅-알기컨,algikeon
More from 알고리즘 기업분석 컨설팅-알기컨,algikeon (20)
Recently uploaded
Recently uploaded (20)
hotelshilla-008770-Algorithm Investment Report
- 1. Performance Analysis of Algorithm (consolidated) 008770 Date Period 3 months 100-m won 2015.12 2016.12 2017.12 Average 2017.09 2017.12 2018.03 2018.06 2018.09 2018.12 IFRS(Con) IFRS(Con) IFRS(Con) IFRS(Con) IFRS(Con) IFRS(Con) IFRS(Con) IFRS(Con) IFRS(Con) IFRS(Con) IFRS(Con) Sales 32,517 37,153 40,115 36,595 10,672 12,648 11,255 11,749 12,826 12,374 11,581 O-profit 772 790 731 764 303 155 442 695 783 838 399 N-income 185 278 253 239 126 70 317 526 594 807 260 O-rate 2.4 2.1 1.8 2.1 2.8 1.2 3.9 5.9 6.1 6.8 3.5 N-rate 0.6 0.7 0.6 0.6 1.2 0.6 2.8 4.5 4.6 6.5 2.3 ROE 2.5 4.2 3.8 3.5 7.6 5.9 10.6 13.1 13.5 15.1 9.3 Debt-ratio 192.6 208.5 236.8 212.6 233.3 236.8 211.7 204.0 191.4 179.6 221.4 Quick-ratio 91.3 82.1 76.7 83.4 89.1 76.7 74.7 60.1 55.2 53.1 75.1 reserve-ratio 276.0 284.0 289.1 283.0 286.3 289.1 298.3 324.5 338.9 354.3 299.5 EPS 463 695 633 597 315 175 793 1,315 1,466 2,053 649 BPS 18,598 16,538 16,703 17,279 16,670 16,703 17,153 18,558 21,481 22,270 17,271 Dividends 350 350 350 350 2018-10-26 Major Financial Information Recent Annual Performance Recent quarterly performance Estimate Average Gap (Indication / stock) Color High price ~ 14 % High mid ~ -1 % Mid ~ -16 % Low mid ~ -31 % Low price ~ -46 % Indication price Range Current stock price Company score 72,464 W 72,464 W 61,412 W 61,412 W 61,412 W 50,359 W Evaluation 83,516 W 83,516 W~ 72,464 W 73,000 W 41.950,359 W 50,359 W 39,307 W High price Normal 39,307 W 39,307 W 0 W Industrial name of the company The number of All industries Algorithm Industry ranking Total number of listed companies Algorithm company ranking Investment opinion Hotels, Restaurants, Leisure 81 44 2,940 1,249 39,307원 50,359원 61,412원 72,464원 83,516원 High price 73,000원 -46% -31% -16% -1% 14.4% -50% -40% -30% -20% -10% 0.% 10.% 20.% 0W 10,000W 20,000W 30,000W 40,000W 50,000W 60,000W 70,000W 80,000W 90,000W Low price Low mid Mid High mid High price Indication price chart (Consolidated) Indication price hotelshilla Gap hotelshilla
- 2. [Price for scheduled purchasing] Arbitrarily made Algorithm stocks Trading Strategies (consolidated) 008770 Date Period Gap (Indication / stock) Color 2018-10-26 3 months Current stock price Evaluation Stock price rise probability score Investment opinion Prospective purchase amount 73,000 W High price 35.4 Normal 5,000,000 W Suggested Purchase Amount 1,355,190 W Number of stocks purchased 19 Indication price Range Buying / Selling Buying / Selling [Stocks] High price 83,516 W 83,516 W~ ~ 72,464 W 14 % -195,222 W -2 High mid 72,464 W 72,464 W ~ 61,412 W -1 % 9,954 W 0 Mid 61,412 W 61,412 W ~ 50,359 W -16 % 215,131 W 4 Low mid 50,359 W 50,359 W ~ 39,307 W -31 % 420,308 W 8 low price 39,307 W 39,307 W ~ 0 W -46 % 625,485 W 16 Stock price rise probability score A Sector 46.2 46.4 52.5 50.1 43.0 43.5 35.4B Sector 41.3 33.8 27.9 50.1 27.9 47.9 Total average 2018.05.28 2018.06.27 2018.07.25 2018.08.23 2018.09.20 2018.10.25 43.7 40.1 40.2 30.0 35.4 45.7 15 % 22 % 2018.06.27 2018.07.25 2018.08.23 2018.09.20 2018.10.25 Total of increase rate Total score A Sector 0 % 12 % -5 % -17 % 1 % -1 % 46.7B Sector -22 % -21 % 44 % -79 % 42 % Total average -9 % 0 % -34 % 46 46 53 50 43 4441 34 28 50 28 48 44 40 40 30 35 46 0 10 20 30 40 50 60 2018.05.28 2018.06.27 2018.07.25 2018.08.23 2018.09.20 2018.10.25 Stock price rise probability score A sector B sector Total average 0% 12% -5% -17% 1% -22% -21% 44% -79% 42% -9% 0% -34% 15% 22% -100% -80% -60% -40% -20% 0% 20% 40% 60% 2018.06.27 2018.07.25 2018.08.23 2018.09.20 2018.10.25 Increase rate of stock price rise A sector B sector Total average hotelshilla
- 3. 정보와 완전 정보 결 투자판단 있습니 위배 무단으 숙지하 Compliance notice ① The information provided by The Algorithm Company Analysis Consulting is obtained through reliable data and information and The Algorithm Company Analysis Program (TACAP), but its accuracy or completeness are not guaranteed. Furthermore, it may change over time.Therefore, we are not legally responsible for the results of the data provided by The Algorithm Company Analysis Consulting because of information errors or omissions. ② The Algorithm Company Analysis Consulting and all the information provided on it site are reference materials for investment decisions and the final responsibility of investment is up to users utilizing this information. ③ The Algorithm Company Analysis Consulting and its site do not do anything that violates the related laws such as discretionary transaction. ④ Users can not reallocate and recycle the information provided by The Algorithm Company Analysis Consulting firm let alone the information provided by its Site. ⑤ Be sure to know about application period of this algorithm analysis report in order to improve its accuracy. Tel : 070 - 4667 - 5009 Email : tacac@tacac.co.kr Homepage : tacac.co.kr Blog : tacac.blog.me SERVICES EDUCATION, M&A, IPO, RECOVER, CORPORATE RESTRUCTURING, MANAGEMENT OF TECHNOLOGY, BUSINESS STRATEGY, FAMILY BUSINESS Request : http://tacac.co.kr/?page_id=1374 ① Consulting The Algori accuracy o change ove results of Consulting ② informatio investmen up ③ do anythin transaction ④ The Algori informatio ⑤ analysis re