hyundai motor company-005380-Algorithm Investment Report
•
0 likes•58 views

This document provides a summary of a company's performance and stock analysis over several periods. It includes tables with financial metrics like sales, operating profit, net income, debt ratios, and stock prices. Charts show the company's stock price probability and increase rates over time. The analysis provides an indication price range and recommends purchasing some shares below a certain price. In the last section, it notes the analysis is for reference and users are responsible for investment decisions based on this information.
![[Price for scheduled purchasing]
Arbitrarily made
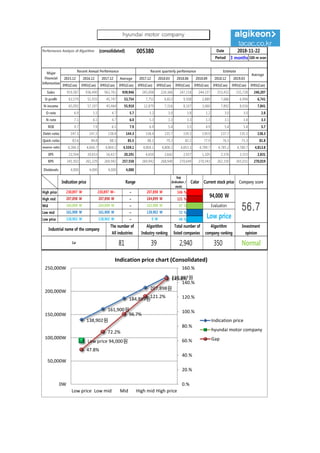
Algorithm stocks Trading Strategies (consolidated) 005380 Date
Period
Gap
(Indication /
stock)
Color
2018-11-22
3 months
Current stock price Evaluation
Stock price rise
probability score
Investment opinion Prospective purchase amount
94,000 W Low price 51.2 Normal 5,000,000 W
Suggested Purchase
Amount 2,480,972 W
Number of stocks
purchased 26
Indication price Range Buying / Selling Buying / Selling [Stocks]
High price 230,897 W 230,897 W~ ~ 207,898 W 146 % -3,613,160 W All selling
High mid 207,898 W 207,898 W ~ 184,899 W 121 % -3,006,146 W All selling
Mid 184,899 W 184,899 W ~ 161,900 W 97 % -2,399,131 W -13
Low mid 161,900 W 161,900 W ~ 138,902 W 72 % -1,792,116 W -11
low price 138,902 W 138,902 W ~ 0 W 48 % -1,185,101 W -9
Stock price rise
probability score
A Sector 45.2 48.6 44.7 50.8 46.8 42.8
51.2B Sector 29.2 24.6 11.7 50.8 42.1 44.2
Total average
2018.06.26 2018.07.24 2018.08.22 2018.09.19 2018.10.24 2018.11.21
37.2 36.6 28.2 23.8 44.5 43.5
47 % -2 %
2018.07.24 2018.08.22 2018.09.19 2018.10.24 2018.11.21
Total of
increase rate
Total score
A Sector 7 % -9 % 12 % -8 % -9 %
-1 % 43.7B Sector -19 % -111 % 77 % -21 % 5 %
Total average -2 % -30 % -19 %
45
49
45
51
47
43
29
25
12
51
42 44
37 37
28
24
44 43
0
10
20
30
40
50
60
2018.06.26 2018.07.24 2018.08.22 2018.09.19 2018.10.24 2018.11.21
Stock price rise probability score
A sector
B sector
Total average
7%
-9%
12%
-8% -9%-19%
-111%
77%
-21%
5%-2%
-30%
-19%
47%
-2%
-150%
-100%
-50%
0%
50%
100%
2018.07.24 2018.08.22 2018.09.19 2018.10.24 2018.11.21
Increase rate of stock price rise
A sector
B sector
Total average
hyundai motor company](data:image/gif;base64,R0lGODlhAQABAIAAAAAAAP///yH5BAEAAAAALAAAAAABAAEAAAIBRAA7)
Recommended
Recommended
More Related Content
What's hot
What's hot (20)
Similar to hyundai motor company-005380-Algorithm Investment Report
Similar to hyundai motor company-005380-Algorithm Investment Report (20)
More from 알고리즘 기업분석 컨설팅-알기컨,algikeon
More from 알고리즘 기업분석 컨설팅-알기컨,algikeon (20)
Recently uploaded
Recently uploaded (20)
hyundai motor company-005380-Algorithm Investment Report
- 1. Performance Analysis of Algorithm (consolidated) 005380 Date Period 3 months 100-m won 2015.12 2016.12 2017.12 Average 2017.12 2018.03 2018.06 2018.09 2018.12 2019.03 IFRS(Con) IFRS(Con) IFRS(Con) IFRS(Con) IFRS(Con) IFRS(Con) IFRS(Con) IFRS(Con) IFRS(Con) IFRS(Con) IFRS(Con) Sales 919,587 936,490 963,761 939,946 245,008 224,366 247,118 244,337 253,452 235,728 240,207 O-profit 63,579 51,935 45,747 53,754 7,752 6,813 9,508 2,889 7,686 6,994 6,741 N-income 65,092 57,197 45,464 55,918 12,879 7,316 8,107 3,060 7,892 8,016 7,841 O-rate 6.9 5.5 4.7 5.7 3.2 3.0 3.8 1.2 3.0 3.0 2.8 N-rate 7.1 6.1 4.7 6.0 5.3 3.3 3.3 1.3 3.1 3.4 3.3 ROE 9.7 7.9 6.1 7.9 6.9 5.4 5.5 4.9 5.4 5.4 5.7 Debt-ratio 147.3 147.2 138.4 144.3 138.4 135.7 139.3 139.9 137.7 135.5 138.3 Quick-ratio 83.6 84.8 88.1 85.5 88.1 79.2 82.2 77.9 76.5 75.3 81.8 reserve-ratio 4,268.3 4,604.7 4,804.1 4,559.1 4,804.1 4,808.2 4,853.3 4,789.7 4,785.2 4,780.7 4,813.8 EPS 23,504 20,653 16,417 20,191 4,650 2,642 2,927 1,105 2,576 2,315 2,831 BPS 241,502 261,229 269,942 257,558 269,942 268,940 270,649 270,543 262,330 265,031 270,019 Dividends 4,000 4,000 4,000 4,000 2018-11-22 Major Financial Information Recent Annual Performance Recent quarterly performance Estimate Average Gap (Indication / stock) Color High price ~ 146 % High mid ~ 121 % Mid ~ 97 % Low mid ~ 72 % Low price ~ 48 % Indication price Range Current stock price Company score 207,898 W 207,898 W 184,899 W 184,899 W 184,899 W 161,900 W Evaluation 230,897 W 230,897 W~ 207,898 W 94,000 W 56.7161,900 W 161,900 W 138,902 W Low price Normal 138,902 W 138,902 W 0 W Industrial name of the company The number of All industries Algorithm Industry ranking Total number of listed companies Algorithm company ranking Investment opinion Car 81 39 2,940 350 138,902원 161,900원 184,899원 207,898원 230,897원 Low price 94,000원 47.8% 72.2% 96.7% 121.2% 145.6% 0.% 20.% 40.% 60.% 80.% 100.% 120.% 140.% 160.% 0W 50,000W 100,000W 150,000W 200,000W 250,000W Low price Low mid Mid High mid High price Indication price chart (Consolidated) Indication price hyundai motor company Gap hyundai motor company
- 2. [Price for scheduled purchasing] Arbitrarily made Algorithm stocks Trading Strategies (consolidated) 005380 Date Period Gap (Indication / stock) Color 2018-11-22 3 months Current stock price Evaluation Stock price rise probability score Investment opinion Prospective purchase amount 94,000 W Low price 51.2 Normal 5,000,000 W Suggested Purchase Amount 2,480,972 W Number of stocks purchased 26 Indication price Range Buying / Selling Buying / Selling [Stocks] High price 230,897 W 230,897 W~ ~ 207,898 W 146 % -3,613,160 W All selling High mid 207,898 W 207,898 W ~ 184,899 W 121 % -3,006,146 W All selling Mid 184,899 W 184,899 W ~ 161,900 W 97 % -2,399,131 W -13 Low mid 161,900 W 161,900 W ~ 138,902 W 72 % -1,792,116 W -11 low price 138,902 W 138,902 W ~ 0 W 48 % -1,185,101 W -9 Stock price rise probability score A Sector 45.2 48.6 44.7 50.8 46.8 42.8 51.2B Sector 29.2 24.6 11.7 50.8 42.1 44.2 Total average 2018.06.26 2018.07.24 2018.08.22 2018.09.19 2018.10.24 2018.11.21 37.2 36.6 28.2 23.8 44.5 43.5 47 % -2 % 2018.07.24 2018.08.22 2018.09.19 2018.10.24 2018.11.21 Total of increase rate Total score A Sector 7 % -9 % 12 % -8 % -9 % -1 % 43.7B Sector -19 % -111 % 77 % -21 % 5 % Total average -2 % -30 % -19 % 45 49 45 51 47 43 29 25 12 51 42 44 37 37 28 24 44 43 0 10 20 30 40 50 60 2018.06.26 2018.07.24 2018.08.22 2018.09.19 2018.10.24 2018.11.21 Stock price rise probability score A sector B sector Total average 7% -9% 12% -8% -9%-19% -111% 77% -21% 5%-2% -30% -19% 47% -2% -150% -100% -50% 0% 50% 100% 2018.07.24 2018.08.22 2018.09.19 2018.10.24 2018.11.21 Increase rate of stock price rise A sector B sector Total average hyundai motor company
- 3. 정보와 완전 정보 결 투자판단 있습니 위배 무단으 숙지하 Compliance notice ① The information provided by The Algorithm Company Analysis Consulting is obtained through reliable data and information and The Algorithm Company Analysis Program (TACAP), but its accuracy or completeness are not guaranteed. Furthermore, it may change over time.Therefore, we are not legally responsible for the results of the data provided by The Algorithm Company Analysis Consulting because of information errors or omissions. ② The Algorithm Company Analysis Consulting and all the information provided on it site are reference materials for investment decisions and the final responsibility of investment is up to users utilizing this information. ③ The Algorithm Company Analysis Consulting and its site do not do anything that violates the related laws such as discretionary transaction. ④ Users can not reallocate and recycle the information provided by The Algorithm Company Analysis Consulting firm let alone the information provided by its Site. ⑤ Be sure to know about application period of this algorithm analysis report in order to improve its accuracy. Tel : 070 - 4667 - 5009 Email : tacac@tacac.co.kr Homepage : tacac.co.kr Blog : tacac.blog.me SERVICES EDUCATION, M&A, IPO, RECOVER, CORPORATE RESTRUCTURING, MANAGEMENT OF TECHNOLOGY, BUSINESS STRATEGY, FAMILY BUSINESS Request : http://tacac.co.kr/?page_id=1374 ① Consulting The Algori accuracy o change ove results of Consulting ② informatio investmen up ③ do anythin transaction ④ The Algori informatio ⑤ analysis re