gs-078930-Algorithm Investment Report
•
0 likes•56 views

gs-078930-Algorithm Investment Report
![[Price for scheduled purchasing]
Arbitrarily made
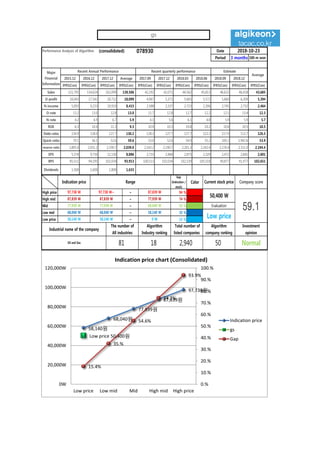
Algorithm stocks Trading Strategies (consolidated) 078930 Date
Period
Gap
(Indication /
stock)
Color
2018-10-23
3 months
Current stock price Evaluation
Stock price rise
probability score
Investment opinion Prospective purchase amount
50,400 W Low price 53.1 Normal 10,000,000 W
Suggested Purchase
Amount 5,166,006 W
Number of stocks
purchased 103
Indication price Range Buying / Selling Buying / Selling [Stocks]
High price 97,738 W 97,738 W~ ~ 87,839 W 94 % -4,852,199 W -50
High mid 87,839 W 87,839 W ~ 77,939 W 74 % -3,837,483 W -44
Mid 77,939 W 77,939 W ~ 68,040 W 55 % -2,822,768 W -36
Low mid 68,040 W 68,040 W ~ 58,140 W 35 % -1,808,052 W -27
low price 58,140 W 58,140 W ~ 0 W 15 % -793,337 W -14
Stock price rise
probability score
A Sector 48.9 50.3 44.9 46.8 46.8 43.9
53.1B Sector 15.0 24.4 43.3 46.8 44.2 42.5
Total average
2018.05.23 2018.06.22 2018.07.20 2018.08.20 2018.09.17 2018.10.22
32.0 37.3 44.1 42.9 45.5 43.2
6 % -5 %
2018.06.22 2018.07.20 2018.08.20 2018.09.17 2018.10.22
Total of
increase rate
Total score
A Sector 3 % -12 % 4 % -0 % -6 %
5 % 52.7B Sector 38 % 44 % 7 % -6 % -4 %
Total average 14 % 15 % -3 %
49 50
45 47 47
44
15
24
43
47
44 43
32
37
44 43 45 43
0
10
20
30
40
50
60
2018.05.23 2018.06.22 2018.07.20 2018.08.20 2018.09.17 2018.10.22
Stock price rise probability score
A sector
B sector
Total average
3%
-12%
4%
-0%
-6%
38%
44%
7%
-6% -4%
14% 15%
-3%
6%
-5%
-20%
-10%
0%
10%
20%
30%
40%
50%
2018.06.22 2018.07.20 2018.08.20 2018.09.17 2018.10.22
Increase rate of stock price rise
A sector
B sector
Total average
gs](data:image/gif;base64,R0lGODlhAQABAIAAAAAAAP///yH5BAEAAAAALAAAAAABAAEAAAIBRAA7)
Recommended
Recommended
More Related Content
What's hot
What's hot (20)
Similar to gs-078930-Algorithm Investment Report
Similar to gs-078930-Algorithm Investment Report (18)
More from 알고리즘 기업분석 컨설팅-알기컨,algikeon
More from 알고리즘 기업분석 컨설팅-알기컨,algikeon (20)
Recently uploaded
Recently uploaded (20)
gs-078930-Algorithm Investment Report
- 1. Performance Analysis of Algorithm (consolidated) 078930 Date Period 3 months 100-m won 2015.12 2016.12 2017.12 Average 2017.09 2017.12 2018.03 2018.06 2018.09 2018.12 IFRS(Con) IFRS(Con) IFRS(Con) IFRS(Con) IFRS(Con) IFRS(Con) IFRS(Con) IFRS(Con) IFRS(Con) IFRS(Con) IFRS(Con) Sales 121,795 134,624 162,099 139,506 42,292 42,071 44,562 45,813 46,632 46,418 43,685 O-profit 16,043 17,542 20,712 18,099 4,967 5,371 5,665 5,572 5,660 6,209 5,394 N-income 5,093 9,233 10,919 8,415 2,588 2,337 2,723 2,206 2,745 2,752 2,464 O-rate 13.2 13.0 12.8 13.0 11.7 12.8 12.7 12.2 12.1 13.4 12.3 N-rate 4.2 6.9 6.7 5.9 6.1 5.6 6.1 4.8 5.9 5.9 5.7 ROE 6.3 10.4 11.3 9.3 10.9 10.3 10.8 10.2 10.6 10.5 10.5 Debt-ratio 134.9 128.0 127.7 130.2 128.3 127.7 127.7 122.2 117.9 113.7 126.5 Quick-ratio 70.1 56.1 52.6 59.6 53.0 52.6 54.9 55.2 169.2 1,942.6 53.9 reserve-ratio 1,895.0 2,031.2 2,190.7 2,039.0 2,143.2 2,190.7 2,201.3 2,242.4 2,276.4 2,311.0 2,194.4 EPS 5,378 9,750 11,530 8,886 2,733 2,468 2,875 2,329 2,472 2,641 2,601 BPS 85,511 94,195 102,034 93,913 100,513 102,034 102,539 105,518 90,877 91,977 102,651 Dividends 1,500 1,600 1,800 1,633 2018-10-23 Major Financial Information Recent Annual Performance Recent quarterly performance Estimate Average Gap (Indication / stock) Color High price ~ 94 % High mid ~ 74 % Mid ~ 55 % Low mid ~ 35 % Low price ~ 15 % Indication price Range Current stock price Company score 87,839 W 87,839 W 77,939 W 77,939 W 77,939 W 68,040 W Evaluation 97,738 W 97,738 W~ 87,839 W 50,400 W 59.168,040 W 68,040 W 58,140 W Low price Normal 58,140 W 58,140 W 0 W Industrial name of the company The number of All industries Algorithm Industry ranking Total number of listed companies Algorithm company ranking Investment opinion Oil and Gas 81 18 2,940 50 58,140원 68,040원 77,939원 87,839원 97,738원 Low price 50,400원 15.4% 35.% 54.6% 74.3% 93.9% 0.% 10.% 20.% 30.% 40.% 50.% 60.% 70.% 80.% 90.% 100.% 0W 20,000W 40,000W 60,000W 80,000W 100,000W 120,000W Low price Low mid Mid High mid High price Indication price chart (Consolidated) Indication price gs Gap gs
- 2. [Price for scheduled purchasing] Arbitrarily made Algorithm stocks Trading Strategies (consolidated) 078930 Date Period Gap (Indication / stock) Color 2018-10-23 3 months Current stock price Evaluation Stock price rise probability score Investment opinion Prospective purchase amount 50,400 W Low price 53.1 Normal 10,000,000 W Suggested Purchase Amount 5,166,006 W Number of stocks purchased 103 Indication price Range Buying / Selling Buying / Selling [Stocks] High price 97,738 W 97,738 W~ ~ 87,839 W 94 % -4,852,199 W -50 High mid 87,839 W 87,839 W ~ 77,939 W 74 % -3,837,483 W -44 Mid 77,939 W 77,939 W ~ 68,040 W 55 % -2,822,768 W -36 Low mid 68,040 W 68,040 W ~ 58,140 W 35 % -1,808,052 W -27 low price 58,140 W 58,140 W ~ 0 W 15 % -793,337 W -14 Stock price rise probability score A Sector 48.9 50.3 44.9 46.8 46.8 43.9 53.1B Sector 15.0 24.4 43.3 46.8 44.2 42.5 Total average 2018.05.23 2018.06.22 2018.07.20 2018.08.20 2018.09.17 2018.10.22 32.0 37.3 44.1 42.9 45.5 43.2 6 % -5 % 2018.06.22 2018.07.20 2018.08.20 2018.09.17 2018.10.22 Total of increase rate Total score A Sector 3 % -12 % 4 % -0 % -6 % 5 % 52.7B Sector 38 % 44 % 7 % -6 % -4 % Total average 14 % 15 % -3 % 49 50 45 47 47 44 15 24 43 47 44 43 32 37 44 43 45 43 0 10 20 30 40 50 60 2018.05.23 2018.06.22 2018.07.20 2018.08.20 2018.09.17 2018.10.22 Stock price rise probability score A sector B sector Total average 3% -12% 4% -0% -6% 38% 44% 7% -6% -4% 14% 15% -3% 6% -5% -20% -10% 0% 10% 20% 30% 40% 50% 2018.06.22 2018.07.20 2018.08.20 2018.09.17 2018.10.22 Increase rate of stock price rise A sector B sector Total average gs
- 3. 정보와 완전 정보 결 투자판단 있습니 위배 무단으 숙지하 Compliance notice ① The information provided by The Algorithm Company Analysis Consulting is obtained through reliable data and information and The Algorithm Company Analysis Program (TACAP), but its accuracy or completeness are not guaranteed. Furthermore, it may change over time.Therefore, we are not legally responsible for the results of the data provided by The Algorithm Company Analysis Consulting because of information errors or omissions. ② The Algorithm Company Analysis Consulting and all the information provided on it site are reference materials for investment decisions and the final responsibility of investment is up to users utilizing this information. ③ The Algorithm Company Analysis Consulting and its site do not do anything that violates the related laws such as discretionary transaction. ④ Users can not reallocate and recycle the information provided by The Algorithm Company Analysis Consulting firm let alone the information provided by its Site. ⑤ Be sure to know about application period of this algorithm analysis report in order to improve its accuracy. Tel : 070 - 4667 - 5009 Email : tacac@tacac.co.kr Homepage : tacac.co.kr Blog : tacac.blog.me SERVICES EDUCATION, M&A, IPO, RECOVER, CORPORATE RESTRUCTURING, MANAGEMENT OF TECHNOLOGY, BUSINESS STRATEGY, FAMILY BUSINESS Request : http://tacac.co.kr/?page_id=1374 ① Consulting The Algori accuracy o change ove results of Consulting ② informatio investmen up ③ do anythin transaction ④ The Algori informatio ⑤ analysis re