poscochemtech-003670-Algorithm Investment Report
•
0 likes•69 views

poscochemtech-003670-Algorithm Investment Report
![[Price for scheduled purchasing]
Arbitrarily made
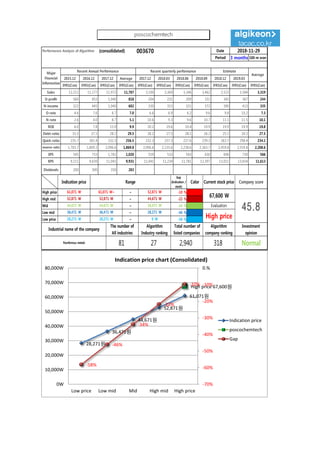
Algorithm stocks Trading Strategies (consolidated) 003670 Date
Period
Gap
(Indication /
stock)
Color
2018-11-29
3 months
Current stock price Evaluation
Stock price rise
probability score
Investment opinion Prospective purchase amount
67,600 W High price 45.8 Normal 4,000,000 W
Suggested Purchase
Amount 1,433,489 W
Number of stocks
purchased 21
Indication price Range Buying / Selling Buying / Selling [Stocks]
High price 61,071 W 61,071 W~ ~ 52,871 W -10 % 138,449 W 2
High mid 52,871 W 52,871 W ~ 44,671 W -22 % 312,333 W 6
Mid 44,671 W 44,671 W ~ 36,471 W -34 % 486,217 W 11
Low mid 36,471 W 36,471 W ~ 28,271 W -46 % 660,102 W 18
low price 28,271 W 28,271 W ~ 0 W -58 % 833,986 W 29
Stock price rise
probability score
A Sector 51.0 46.1 47.8 50.1 47.5 43.0
45.8B Sector 28.8 36.7 37.9 50.1 30.4 42.9
Total average
2018.07.03 2018.07.31 2018.08.29 2018.10.01 2018.10.31 2018.11.28
39.9 41.4 42.9 34.6 38.9 42.9
11 % 9 %
2018.07.31 2018.08.29 2018.10.01 2018.10.31 2018.11.28
Total of
increase rate
Total score
A Sector -10 % 3 % 5 % -6 % -10 %
1 % 48.0B Sector 22 % 3 % 24 % -65 % 29 %
Total average 4 % 3 % -24 %
51
46 48 50 47
43
29
37 38
50
30
43
40 41 43
35
39
43
0
10
20
30
40
50
60
2018.07.03 2018.07.31 2018.08.29 2018.10.01 2018.10.31 2018.11.28
Stock price rise probability score
A sector
B sector
Total average
-10%
3% 5%
-6%
-10%
22%
3%
24%
-65%
29%
4% 3%
-24%
11% 9%
-80%
-60%
-40%
-20%
0%
20%
40%
2018.07.31 2018.08.29 2018.10.01 2018.10.31 2018.11.28
Increase rate of stock price rise
A sector
B sector
Total average
poscochemtech](data:image/gif;base64,R0lGODlhAQABAIAAAAAAAP///yH5BAEAAAAALAAAAAABAAEAAAIBRAA7)
Recommended
Recommended
More Related Content
What's hot
What's hot (20)
Similar to poscochemtech-003670-Algorithm Investment Report
Similar to poscochemtech-003670-Algorithm Investment Report (20)
More from 알고리즘 기업분석 컨설팅-알기컨,algikeon
More from 알고리즘 기업분석 컨설팅-알기컨,algikeon (20)
Recently uploaded
Recently uploaded (20)
poscochemtech-003670-Algorithm Investment Report
- 1. Performance Analysis of Algorithm (consolidated) 003670 Date Period 3 months 100-m won 2015.12 2016.12 2017.12 Average 2017.12 2018.03 2018.06 2018.09 2018.12 2019.03 IFRS(Con) IFRS(Con) IFRS(Con) IFRS(Con) IFRS(Con) IFRS(Con) IFRS(Con) IFRS(Con) IFRS(Con) IFRS(Con) IFRS(Con) Sales 12,212 11,177 11,972 11,787 3,100 3,369 3,346 3,462 3,523 3,584 3,319 O-profit 560 853 1,040 818 204 231 209 331 345 367 244 N-income 322 445 1,040 602 330 315 321 372 390 413 335 O-rate 4.6 7.6 8.7 7.0 6.6 6.9 6.2 9.6 9.8 10.2 7.3 N-rate 2.6 4.0 8.7 5.1 10.6 9.3 9.6 10.7 11.1 11.5 10.1 ROE 6.0 7.8 15.9 9.9 20.2 19.6 19.4 19.9 19.9 19.9 19.8 Debt-ratio 33.3 27.1 28.2 29.5 28.2 27.5 28.1 26.2 25.1 24.1 27.5 Quick-ratio 235.7 301.4 232.3 256.5 232.3 237.3 227.6 239.3 263.7 298.4 234.1 reserve-ratio 1,703.7 1,809.2 2,096.6 1,869.8 2,096.6 2,135.6 2,238.6 2,363.7 2,459.8 2,559.8 2,208.6 EPS 545 753 1,761 1,020 559 533 543 630 696 730 566 BPS 9,111 9,639 11,041 9,931 11,041 11,234 11,781 12,397 13,011 13,654 11,613 Dividends 200 300 350 283 2018-11-29 Major Financial Information Recent Annual Performance Recent quarterly performance Estimate Average Gap (Indication / stock) Color High price ~ -10 % High mid ~ -22 % Mid ~ -34 % Low mid ~ -46 % Low price ~ -58 % Indication price Range Current stock price Company score 52,871 W 52,871 W 44,671 W 44,671 W 44,671 W 36,471 W Evaluation 61,071 W 61,071 W~ 52,871 W 67,600 W 45.836,471 W 36,471 W 28,271 W High price Normal 28,271 W 28,271 W 0 W Industrial name of the company The number of All industries Algorithm Industry ranking Total number of listed companies Algorithm company ranking Investment opinion Nonferrous metals 81 27 2,940 318 28,271원 36,471원 44,671원 52,871원 61,071원 High price 67,600원 -58% -46% -34% -22% -10% -70% -60% -50% -40% -30% -20% -10% 0.% 0W 10,000W 20,000W 30,000W 40,000W 50,000W 60,000W 70,000W 80,000W Low price Low mid Mid High mid High price Indication price chart (Consolidated) Indication price poscochemtech Gap poscochemtech
- 2. [Price for scheduled purchasing] Arbitrarily made Algorithm stocks Trading Strategies (consolidated) 003670 Date Period Gap (Indication / stock) Color 2018-11-29 3 months Current stock price Evaluation Stock price rise probability score Investment opinion Prospective purchase amount 67,600 W High price 45.8 Normal 4,000,000 W Suggested Purchase Amount 1,433,489 W Number of stocks purchased 21 Indication price Range Buying / Selling Buying / Selling [Stocks] High price 61,071 W 61,071 W~ ~ 52,871 W -10 % 138,449 W 2 High mid 52,871 W 52,871 W ~ 44,671 W -22 % 312,333 W 6 Mid 44,671 W 44,671 W ~ 36,471 W -34 % 486,217 W 11 Low mid 36,471 W 36,471 W ~ 28,271 W -46 % 660,102 W 18 low price 28,271 W 28,271 W ~ 0 W -58 % 833,986 W 29 Stock price rise probability score A Sector 51.0 46.1 47.8 50.1 47.5 43.0 45.8B Sector 28.8 36.7 37.9 50.1 30.4 42.9 Total average 2018.07.03 2018.07.31 2018.08.29 2018.10.01 2018.10.31 2018.11.28 39.9 41.4 42.9 34.6 38.9 42.9 11 % 9 % 2018.07.31 2018.08.29 2018.10.01 2018.10.31 2018.11.28 Total of increase rate Total score A Sector -10 % 3 % 5 % -6 % -10 % 1 % 48.0B Sector 22 % 3 % 24 % -65 % 29 % Total average 4 % 3 % -24 % 51 46 48 50 47 43 29 37 38 50 30 43 40 41 43 35 39 43 0 10 20 30 40 50 60 2018.07.03 2018.07.31 2018.08.29 2018.10.01 2018.10.31 2018.11.28 Stock price rise probability score A sector B sector Total average -10% 3% 5% -6% -10% 22% 3% 24% -65% 29% 4% 3% -24% 11% 9% -80% -60% -40% -20% 0% 20% 40% 2018.07.31 2018.08.29 2018.10.01 2018.10.31 2018.11.28 Increase rate of stock price rise A sector B sector Total average poscochemtech
- 3. 정보와 완전 정보 결 투자판단 있습니 위배 무단으 숙지하 Compliance notice ① The information provided by The Algorithm Company Analysis Consulting is obtained through reliable data and information and The Algorithm Company Analysis Program (TACAP), but its accuracy or completeness are not guaranteed. Furthermore, it may change over time.Therefore, we are not legally responsible for the results of the data provided by The Algorithm Company Analysis Consulting because of information errors or omissions. ② The Algorithm Company Analysis Consulting and all the information provided on it site are reference materials for investment decisions and the final responsibility of investment is up to users utilizing this information. ③ The Algorithm Company Analysis Consulting and its site do not do anything that violates the related laws such as discretionary transaction. ④ Users can not reallocate and recycle the information provided by The Algorithm Company Analysis Consulting firm let alone the information provided by its Site. ⑤ Be sure to know about application period of this algorithm analysis report in order to improve its accuracy. Tel : 070 - 4667 - 5009 Email : tacac@tacac.co.kr Homepage : tacac.co.kr Blog : tacac.blog.me SERVICES EDUCATION, M&A, IPO, RECOVER, CORPORATE RESTRUCTURING, MANAGEMENT OF TECHNOLOGY, BUSINESS STRATEGY, FAMILY BUSINESS Request : http://tacac.co.kr/?page_id=1374 ① Consulting The Algori accuracy o change ove results of Consulting ② informatio investmen up ③ do anythin transaction ④ The Algori informatio ⑤ analysis re