korea airport service-005430-Algorithm Investment Report
•
0 likes•45 views

This document provides a performance analysis of an algorithm company over several time periods. It includes key financial metrics such as sales, operating profit, net income, debt ratio, and earnings per share on a quarterly and annual basis. It also includes stock price information, an indication price range analysis, and recommendations to buy shares of the company based on the current and projected stock price.
![[Price for scheduled purchasing]
Arbitrarily made
Algorithm stocks Trading Strategies (consolidated) 39400 Date
Period
Gap
(Indication /
stock)
Color
2018-11-06
3 months
Current stock price Evaluation
Stock price rise
probability score
Investment opinion Prospective purchase amount
39,400 W Low price 54.8 Buy 10,000,000 W
Suggested Purchase
Amount 5,716,347 W
Number of stocks
purchased 145
Indication price Range Buying / Selling Buying / Selling [Stocks]
High price 80,873 W 80,873 W~ ~ 73,338 W 105 % -6,017,048 W All selling
High mid 73,338 W 73,338 W ~ 65,804 W 86 % -4,923,949 W -67
Mid 65,804 W 65,804 W ~ 58,270 W 67 % -3,830,850 W -58
Low mid 58,270 W 58,270 W ~ 50,736 W 48 % -2,737,751 W -47
low price 50,736 W 50,736 W ~ 0 W 29 % -1,644,652 W -32
Stock price rise
probability score
A Sector 44.4 46.9 45.9 45.2 47.1 47.2
54.8B Sector 19.2 45.8 22.1 45.2 15.4 38.8
Total average
2018.06.07 2018.07.06 2018.08.03 2018.09.03 2018.10.05 2018.11.05
31.8 46.4 34.0 28.3 31.3 43.0
9 % 27 %
2018.07.06 2018.08.03 2018.09.03 2018.10.05 2018.11.05
Total of
increase rate
Total score
A Sector 5 % -2 % -2 % 4 % 0 %
2 % 51.3B Sector 58 % -108 % 51 % -193 % 60 %
Total average 31 % -36 % -20 %
44
47 46 45 47 47
19
46
22
45
15
39
32
46
34
28
31
43
0
10
20
30
40
50
2018.06.07 2018.07.06 2018.08.03 2018.09.03 2018.10.05 2018.11.05
Stock price rise probability score
A sector
B sector
Total average
5% -2% -2% 4% 0%
58%
-108%
51%
-193%
60%
31%
-36%
-20%
9%
27%
-250%
-200%
-150%
-100%
-50%
0%
50%
100%
2018.07.06 2018.08.03 2018.09.03 2018.10.05 2018.11.05
Increase rate of stock price rise
A sector
B sector
Total average
korea airport service](data:image/gif;base64,R0lGODlhAQABAIAAAAAAAP///yH5BAEAAAAALAAAAAABAAEAAAIBRAA7)
Recommended
Recommended
More Related Content
What's hot
What's hot (20)
Similar to korea airport service-005430-Algorithm Investment Report
Similar to korea airport service-005430-Algorithm Investment Report (20)
More from 알고리즘 기업분석 컨설팅-알기컨,algikeon
More from 알고리즘 기업분석 컨설팅-알기컨,algikeon (20)
Recently uploaded
Recently uploaded (20)
korea airport service-005430-Algorithm Investment Report
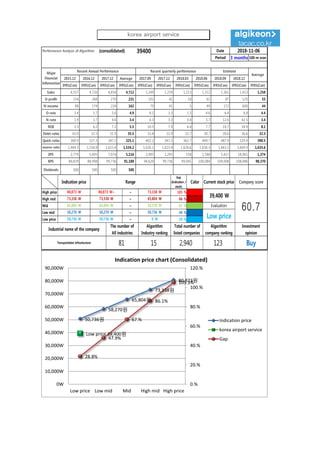
- 1. Performance Analysis of Algorithm (consolidated) 39400 Date Period 3 months 100-m won 2015.12 2016.12 2017.12 Average 2017.09 2017.12 2018.03 2018.06 2018.09 2018.12 IFRS(Con) IFRS(Con) IFRS(Con) IFRS(Con) IFRS(Con) IFRS(Con) IFRS(Con) IFRS(Con) IFRS(Con) IFRS(Con) IFRS(Con) Sales 4,557 4,726 4,854 4,712 1,249 1,259 1,213 1,312 1,361 1,413 1,258 O-profit 154 268 270 231 101 41 18 61 87 125 55 N-income 88 174 224 162 79 41 5 49 172 600 44 O-rate 3.4 5.7 5.6 4.9 8.1 3.3 1.5 4.6 6.4 8.8 4.4 N-rate 1.9 3.7 4.6 3.4 6.3 3.3 0.4 3.7 12.6 42.5 3.4 ROE 3.3 6.2 7.1 5.5 10.5 7.9 6.4 7.7 10.7 18.9 8.1 Debt-ratio 42.0 32.5 31.9 35.5 33.8 31.9 32.7 30.7 28.6 26.6 32.3 Quick-ratio 300.9 327.3 347.2 325.1 402.2 347.2 362.7 449.7 487.9 529.9 390.5 reserve-ratio 1,444.3 1,534.8 1,623.4 1,534.2 1,636.1 1,623.4 1,626.6 1,656.3 1,663.1 1,669.9 1,635.6 EPS 2,779 5,495 7,074 5,116 2,495 1,295 158 1,548 5,417 18,961 1,374 BPS 84,829 88,998 99,736 91,188 94,620 99,736 99,041 100,084 104,008 108,086 98,370 Dividends 500 500 500 500 2018-11-06 Major Financial Information Recent Annual Performance Recent quarterly performance Estimate Average Gap (Indication / stock) Color High price ~ 105 % High mid ~ 86 % Mid ~ 67 % Low mid ~ 48 % Low price ~ 29 % Indication price Range Current stock price Company score 73,338 W 73,338 W 65,804 W 65,804 W 65,804 W 58,270 W Evaluation 80,873 W 80,873 W~ 73,338 W 39,400 W 60.758,270 W 58,270 W 50,736 W Low price Buy 50,736 W 50,736 W 0 W Industrial name of the company The number of All industries Algorithm Industry ranking Total number of listed companies Algorithm company ranking Investment opinion Transportation Infrastructure 81 15 2,940 123 50,736원 58,270원 65,804원 73,338원 80,873원 Low price 39,400원 28.8% 47.9% 67.% 86.1% 105.3% 0.% 20.% 40.% 60.% 80.% 100.% 120.% 0W 10,000W 20,000W 30,000W 40,000W 50,000W 60,000W 70,000W 80,000W 90,000W Low price Low mid Mid High mid High price Indication price chart (Consolidated) Indication price korea airport service Gap korea airport service
- 2. [Price for scheduled purchasing] Arbitrarily made Algorithm stocks Trading Strategies (consolidated) 39400 Date Period Gap (Indication / stock) Color 2018-11-06 3 months Current stock price Evaluation Stock price rise probability score Investment opinion Prospective purchase amount 39,400 W Low price 54.8 Buy 10,000,000 W Suggested Purchase Amount 5,716,347 W Number of stocks purchased 145 Indication price Range Buying / Selling Buying / Selling [Stocks] High price 80,873 W 80,873 W~ ~ 73,338 W 105 % -6,017,048 W All selling High mid 73,338 W 73,338 W ~ 65,804 W 86 % -4,923,949 W -67 Mid 65,804 W 65,804 W ~ 58,270 W 67 % -3,830,850 W -58 Low mid 58,270 W 58,270 W ~ 50,736 W 48 % -2,737,751 W -47 low price 50,736 W 50,736 W ~ 0 W 29 % -1,644,652 W -32 Stock price rise probability score A Sector 44.4 46.9 45.9 45.2 47.1 47.2 54.8B Sector 19.2 45.8 22.1 45.2 15.4 38.8 Total average 2018.06.07 2018.07.06 2018.08.03 2018.09.03 2018.10.05 2018.11.05 31.8 46.4 34.0 28.3 31.3 43.0 9 % 27 % 2018.07.06 2018.08.03 2018.09.03 2018.10.05 2018.11.05 Total of increase rate Total score A Sector 5 % -2 % -2 % 4 % 0 % 2 % 51.3B Sector 58 % -108 % 51 % -193 % 60 % Total average 31 % -36 % -20 % 44 47 46 45 47 47 19 46 22 45 15 39 32 46 34 28 31 43 0 10 20 30 40 50 2018.06.07 2018.07.06 2018.08.03 2018.09.03 2018.10.05 2018.11.05 Stock price rise probability score A sector B sector Total average 5% -2% -2% 4% 0% 58% -108% 51% -193% 60% 31% -36% -20% 9% 27% -250% -200% -150% -100% -50% 0% 50% 100% 2018.07.06 2018.08.03 2018.09.03 2018.10.05 2018.11.05 Increase rate of stock price rise A sector B sector Total average korea airport service
- 3. 정보와 완전 정보 결 투자판단 있습니 위배 무단으 숙지하 Compliance notice ① The information provided by The Algorithm Company Analysis Consulting is obtained through reliable data and information and The Algorithm Company Analysis Program (TACAP), but its accuracy or completeness are not guaranteed. Furthermore, it may change over time.Therefore, we are not legally responsible for the results of the data provided by The Algorithm Company Analysis Consulting because of information errors or omissions. ② The Algorithm Company Analysis Consulting and all the information provided on it site are reference materials for investment decisions and the final responsibility of investment is up to users utilizing this information. ③ The Algorithm Company Analysis Consulting and its site do not do anything that violates the related laws such as discretionary transaction. ④ Users can not reallocate and recycle the information provided by The Algorithm Company Analysis Consulting firm let alone the information provided by its Site. ⑤ Be sure to know about application period of this algorithm analysis report in order to improve its accuracy. Tel : 070 - 4667 - 5009 Email : tacac@tacac.co.kr Homepage : tacac.co.kr Blog : tacac.blog.me SERVICES EDUCATION, M&A, IPO, RECOVER, CORPORATE RESTRUCTURING, MANAGEMENT OF TECHNOLOGY, BUSINESS STRATEGY, FAMILY BUSINESS Request : http://tacac.co.kr/?page_id=1374 ① Consulting The Algori accuracy o change ove results of Consulting ② informatio investmen up ③ do anythin transaction ④ The Algori informatio ⑤ analysis re