kakao-035720-Algorithm Investment Report
•
0 likes•135 views

kakao-035720-Algorithm Investment Report
![[Price for scheduled purchasing]
Arbitrarily made
Algorithm stocks Trading Strategies (consolidated) 035720 Date
Period
Gap
(Indication /
stock)
Color
2018-03-19
3 months
Current stock price Evaluation
Stock price rise
probability score
Investment opinion Prospective purchase amount
137,000 W High price 50.3 Normal 5,000,000 W
Suggested Purchase
Amount 1,701,787 W
Number of stocks
purchased 12
Indication price Range Buying / Selling Buying / Selling [Stocks]
High price 151,050 W 151,050 W~ ~ 131,796 W 10 % -174,527 W -1
High mid 131,796 W 131,796 W ~ 112,541 W -4 % 64,646 W 0
Mid 112,541 W 112,541 W ~ 93,287 W -18 % 303,819 W 3
Low mid 93,287 W 93,287 W ~ 74,033 W -32 % 542,993 W 6
low price 74,033 W 74,033 W ~ 0 W -46 % 782,166 W 11
Stock price rise
probability score
A Sector 47.4 47.5 47.0 44.4 46.0 52.3
50.3B Sector 35.0 49.2 40.4 44.4 36.7 53.8
Total average
2017.10.19 2017.11.16 2017.12.14 2018.01.16 2018.02.13 2018.03.16
41.2 48.3 43.7 44.2 41.3 53.0
-7 % 22 %
2017.11.16 2017.12.14 2018.01.16 2018.02.13 2018.03.16
Total of
increase rate
Total score
A Sector 0 % -1 % -6 % 3 % 12 %
4 % 50.7B Sector 29 % -22 % 9 % -21 % 32 %
Total average 15 % -11 % 1 %
47 47 47 44 46
52
35
49
40
44
37
54
41
48
44 44
41
53
0
10
20
30
40
50
60
2017.10.19 2017.11.16 2017.12.14 2018.01.16 2018.02.13 2018.03.16
Stock price rise probability score
A sector
B sector
Total average
0% -1%
-6%
3%
12%
29%
-22%
9%
-21%
32%
15%
-11%
1%
-7%
22%
-30%
-20%
-10%
0%
10%
20%
30%
40%
2017.11.16 2017.12.14 2018.01.16 2018.02.13 2018.03.16
Increase rate of stock price rise
A sector
B sector
Total average
kakao](data:image/gif;base64,R0lGODlhAQABAIAAAAAAAP///yH5BAEAAAAALAAAAAABAAEAAAIBRAA7)
Recommended
Recommended
More Related Content
What's hot
What's hot (20)
Similar to kakao-035720-Algorithm Investment Report
Similar to kakao-035720-Algorithm Investment Report (20)
More from 알고리즘 기업분석 컨설팅-알기컨,algikeon
More from 알고리즘 기업분석 컨설팅-알기컨,algikeon (20)
Recently uploaded
Recently uploaded (20)
kakao-035720-Algorithm Investment Report
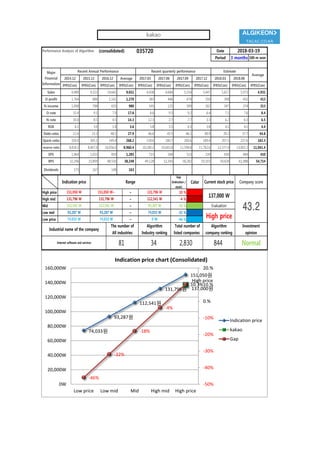
- 1. Performance Analysis of Algorithm (consolidated) 035720 Date Period 3 months 100-m won 2014.12 2015.12 2016.12 Average 2017.03 2017.06 2017.09 2017.12 2018.03 2018.06 IFRS(Con) IFRS(Con) IFRS(Con) IFRS(Con) IFRS(Con) IFRS(Con) IFRS(Con) IFRS(Con) IFRS(Con) IFRS(Con) IFRS(Con) Sales 4,989 9,322 14,642 9,651 4,438 4,684 5,154 5,447 5,617 5,973 4,931 O-profit 1,764 886 1,161 1,270 383 446 474 350 398 452 413 N-income 1,498 788 655 980 545 125 399 182 347 374 313 O-rate 35.4 9.5 7.9 17.6 8.6 9.5 9.2 6.4 7.1 7.6 8.4 N-rate 30.0 8.5 4.5 14.3 12.3 2.7 7.7 3.3 6.2 6.3 6.5 ROE 6.1 3.0 1.8 3.6 5.8 3.5 4.3 3.8 4.1 4.1 4.4 Debt-ratio 12.4 23.3 48.1 27.9 46.6 45.5 46.1 40.9 39.2 37.7 44.8 Quick-ratio 350.0 305.1 149.4 268.2 158.6 180.7 200.6 189.4 207.5 227.6 182.3 reserve-ratio 8,418.2 8,407.0 10,056.0 8,960.4 10,180.2 10,603.8 11,598.8 11,782.6 12,377.4 13,002.2 11,041.4 EPS 1,964 1,033 859 1,285 715 164 523 239 439 484 410 BPS 32,296 33,899 48,550 38,248 49,128 52,343 58,282 59,103 59,428 61,988 54,714 Dividends 173 167 148 163 2018-03-19 Major Financial Information Recent Annual Performance Recent quarterly performance Estimate Average Gap (Indication / stock) Color High price ~ 10 % High mid ~ -4 % Mid ~ -18 % Low mid ~ -32 % Low price ~ -46 % Indication price Range Current stock price Company score 131,796 W 131,796 W 112,541 W 112,541 W 112,541 W 93,287 W Evaluation 151,050 W 151,050 W~ 131,796 W 137,000 W 43.293,287 W 93,287 W 74,033 W High price Normal 74,033 W 74,033 W 0 W Industrial name of the company The number of All industries Algorithm Industry ranking Total number of listed companies Algorithm company ranking Investment opinion Internet software and services 81 34 2,830 844 74,033원 93,287원 112,541원 131,796원 151,050원 High price 137,000원 -46% -32% -18% -4% 10.3% -50% -40% -30% -20% -10% 0.% 10.% 20.% 0W 20,000W 40,000W 60,000W 80,000W 100,000W 120,000W 140,000W 160,000W Low price Low mid Mid High mid High price Indication price chart (Consolidated) Indication price kakao Gap kakao
- 2. [Price for scheduled purchasing] Arbitrarily made Algorithm stocks Trading Strategies (consolidated) 035720 Date Period Gap (Indication / stock) Color 2018-03-19 3 months Current stock price Evaluation Stock price rise probability score Investment opinion Prospective purchase amount 137,000 W High price 50.3 Normal 5,000,000 W Suggested Purchase Amount 1,701,787 W Number of stocks purchased 12 Indication price Range Buying / Selling Buying / Selling [Stocks] High price 151,050 W 151,050 W~ ~ 131,796 W 10 % -174,527 W -1 High mid 131,796 W 131,796 W ~ 112,541 W -4 % 64,646 W 0 Mid 112,541 W 112,541 W ~ 93,287 W -18 % 303,819 W 3 Low mid 93,287 W 93,287 W ~ 74,033 W -32 % 542,993 W 6 low price 74,033 W 74,033 W ~ 0 W -46 % 782,166 W 11 Stock price rise probability score A Sector 47.4 47.5 47.0 44.4 46.0 52.3 50.3B Sector 35.0 49.2 40.4 44.4 36.7 53.8 Total average 2017.10.19 2017.11.16 2017.12.14 2018.01.16 2018.02.13 2018.03.16 41.2 48.3 43.7 44.2 41.3 53.0 -7 % 22 % 2017.11.16 2017.12.14 2018.01.16 2018.02.13 2018.03.16 Total of increase rate Total score A Sector 0 % -1 % -6 % 3 % 12 % 4 % 50.7B Sector 29 % -22 % 9 % -21 % 32 % Total average 15 % -11 % 1 % 47 47 47 44 46 52 35 49 40 44 37 54 41 48 44 44 41 53 0 10 20 30 40 50 60 2017.10.19 2017.11.16 2017.12.14 2018.01.16 2018.02.13 2018.03.16 Stock price rise probability score A sector B sector Total average 0% -1% -6% 3% 12% 29% -22% 9% -21% 32% 15% -11% 1% -7% 22% -30% -20% -10% 0% 10% 20% 30% 40% 2017.11.16 2017.12.14 2018.01.16 2018.02.13 2018.03.16 Increase rate of stock price rise A sector B sector Total average kakao
- 3. 정보와 완전 정보 결 투자판단 있습니 위배 무단으 숙지하 Compliance notice ① The information provided by The Algorithm Company Analysis Consulting is obtained through reliable data and information and The Algorithm Company Analysis Program (TACAP), but its accuracy or completeness are not guaranteed. Furthermore, it may change over time.Therefore, we are not legally responsible for the results of the data provided by The Algorithm Company Analysis Consulting because of information errors or omissions. ② The Algorithm Company Analysis Consulting and all the information provided on it site are reference materials for investment decisions and the final responsibility of investment is up to users utilizing this information. ③ The Algorithm Company Analysis Consulting and its site do not do anything that violates the related laws such as discretionary transaction. ④ Users can not reallocate and recycle the information provided by The Algorithm Company Analysis Consulting firm let alone the information provided by its Site. ⑤ Be sure to know about application period of this algorithm analysis report in order to improve its accuracy. Tel : 070 - 4667 - 5009 Email : tacac@tacac.co.kr Homepage : tacac.co.kr Blog : tacac.blog.me SERVICES M&A, IPO, CORPORATE RESTRUCTURING, MANAGEMENT OF TECHNOLOGY, BUSINESS STRATEGY, FAMILY BUSINESS Request : http://tacac.co.kr/?page_id=1374 ① Consulting The Algori accuracy o change ove results of Consulting ② informatio investmen up ③ do anythin transaction ④ The Algori informatio ⑤ analysis re