sk bioland 052260 Algorithm Investment Report
•
0 likes•111 views

This document provides financial and stock performance data for a company over several periods from 2016 to 2020. It includes metrics like sales, operating profit, net income, operating rate, net rate, ROE, debt ratio, quick ratio, and reserve ratio on a quarterly and annual basis. It also lists the company's current stock price, indication price ranges, and analysis of the stock's probability to rise in price over the next 3 months. The document evaluates the company's stock as a normal investment and provides a suggested purchase amount and number of shares to buy within different price ranges.
![[Price for scheduled purchasing]
Arbitrarily made
Algorithm stocks Trading Strategies (consolidated) 052260 Date
Period
Gap
(Indication /
stock)
Color
2020-05-22
3 months
Current stock price Evaluation
Stock price rise
probability score
Investment opinion Prospective purchase amount
42,900 W High price 50.8 Normal 3,000,000 W
Suggested Purchase
Amount 1,080,366 W
Number of stocks
purchased 25
Indication price Range Buying / Selling Buying / Selling [Stocks]
High price 32,348 W 32,348 W~ ~ 28,187 W -25 % 265,732 W 8
High mid 28,187 W 28,187 W ~ 24,025 W -34 % 370,532 W 13
Mid 24,025 W 24,025 W ~ 19,864 W -44 % 475,333 W 20
Low mid 19,864 W 19,864 W ~ 15,702 W -54 % 580,133 W 29
low price 15,702 W 15,702 W ~ 0 W -63 % 684,934 W 44
Stock price rise
probability score
A Sector 45.6 48.6 48.5 51.6 50.1 51.4
50.8B Sector 24.2 28.8 38.8 51.6 45.8 28.8
Total average
2019.12.20 2020.01.22 2020.02.21 2020.03.20 2020.04.20 2020.05.21
34.9 38.7 43.6 21.7 48.0 40.1
55 % -20 %
2020.01.22 2020.02.21 2020.03.20 2020.04.20 2020.05.21
Total of
increase rate
Total score
A Sector 6 % -0 % 6 % -3 % 3 %
-9 % 49.0B Sector 16 % 26 % 25 % -13 % -59 %
Total average 10 % 11 % -101 %
46
49 49
52 50 51
24
29
39
52
46
29
35
39
44
22
48
40
0
10
20
30
40
50
60
2019.12.20 2020.01.22 2020.02.21 2020.03.20 2020.04.20 2020.05.21
Stock price rise probability score
A sector
B sector
Total average
6% -0% 6% -3% 3%
16%
26% 25%
-13%
-59%
10% 11%
-101%
55%
-20%
-150%
-100%
-50%
0%
50%
100%
2020.01.22 2020.02.21 2020.03.20 2020.04.20 2020.05.21
Increase rate of stock price rise
A sector
B sector
Total average
sk bioland](data:image/gif;base64,R0lGODlhAQABAIAAAAAAAP///yH5BAEAAAAALAAAAAABAAEAAAIBRAA7)
Recommended
Recommended
More Related Content
What's hot
What's hot (20)
Similar to sk bioland 052260 Algorithm Investment Report
Similar to sk bioland 052260 Algorithm Investment Report (20)
More from 알고리즘 기업분석 컨설팅-알기컨,algikeon
More from 알고리즘 기업분석 컨설팅-알기컨,algikeon (20)
Recently uploaded
Recently uploaded (20)
sk bioland 052260 Algorithm Investment Report
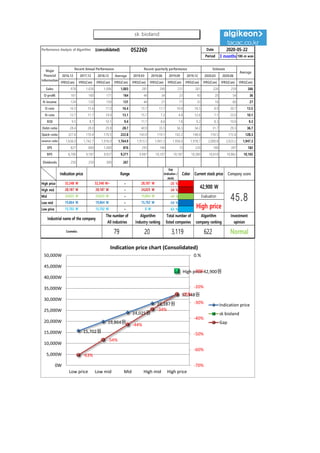
- 1. Performance Analysis of Algorithm (consolidated) 052260 Date Period 3 months 100-m won 2016.12 2017.12 2018.12 Average 2019.03 2019.06 2019.09 2019.12 2020.03 2020.06 IFRS(Con) IFRS(Con) IFRS(Con) IFRS(Con) IFRS(Con) IFRS(Con) IFRS(Con) IFRS(Con) IFRS(Con) IFRS(Con) IFRS(Con) Sales 978 1,026 1,006 1,003 281 290 231 261 226 259 266 O-profit 161 160 171 164 44 34 23 43 20 54 36 N-income 124 120 150 131 44 21 11 33 16 60 27 O-rate 16.5 15.6 17.0 16.4 15.7 11.7 10.0 16.5 8.9 20.7 13.5 N-rate 12.7 11.7 14.9 13.1 15.7 7.2 4.8 12.6 7.1 23.0 10.1 ROE 9.5 8.7 10.1 9.4 11.7 8.6 7.8 9.2 8.3 10.0 9.3 Debt-ratio 28.4 28.0 29.8 28.7 40.9 35.5 36.3 34.2 31.7 29.3 36.7 Quick-ratio 327.6 170.4 170.5 222.8 143.9 119.1 102.2 148.0 159.5 172.6 128.3 reserve-ratio 1,636.0 1,742.7 1,916.0 1,764.9 1,913.3 1,941.3 1,956.0 1,978.7 2,000.8 2,023.2 1,947.3 EPS 827 800 1,000 876 293 140 73 220 108 397 182 BPS 8,700 9,187 9,927 9,271 9,987 10,107 10,187 10,380 10,618 10,862 10,165 Dividends 250 250 300 267 2020-05-22 Major Financial Information Recent Annual Performance Recent quarterly performance Estimate Average Gap (Indication / stock) Color High price ~ -25 % High mid ~ -34 % Mid ~ -44 % Low mid ~ -54 % Low price ~ -63 % Indication price Range Current stock price Company score 28,187 W 28,187 W 24,025 W 24,025 W 24,025 W 19,864 W Evaluation 32,348 W 32,348 W~ 28,187 W 42,900 W 45.819,864 W 19,864 W 15,702 W High price Normal 15,702 W 15,702 W 0 W Industrial name of the company The number of All industries Algorithm Industry ranking Total number of listed companies Algorithm company ranking Investment opinion Cosmetics 79 20 3,119 622 15,702원 19,864원 24,025원 28,187원 32,348원 High price 42,900원 -63% -54% -44% -34% -25% -70% -60% -50% -40% -30% -20% -10% 0.% 0W 5,000W 10,000W 15,000W 20,000W 25,000W 30,000W 35,000W 40,000W 45,000W 50,000W Low price Low mid Mid High mid High price Indication price chart (Consolidated) Indication price sk bioland Gap sk bioland
- 2. [Price for scheduled purchasing] Arbitrarily made Algorithm stocks Trading Strategies (consolidated) 052260 Date Period Gap (Indication / stock) Color 2020-05-22 3 months Current stock price Evaluation Stock price rise probability score Investment opinion Prospective purchase amount 42,900 W High price 50.8 Normal 3,000,000 W Suggested Purchase Amount 1,080,366 W Number of stocks purchased 25 Indication price Range Buying / Selling Buying / Selling [Stocks] High price 32,348 W 32,348 W~ ~ 28,187 W -25 % 265,732 W 8 High mid 28,187 W 28,187 W ~ 24,025 W -34 % 370,532 W 13 Mid 24,025 W 24,025 W ~ 19,864 W -44 % 475,333 W 20 Low mid 19,864 W 19,864 W ~ 15,702 W -54 % 580,133 W 29 low price 15,702 W 15,702 W ~ 0 W -63 % 684,934 W 44 Stock price rise probability score A Sector 45.6 48.6 48.5 51.6 50.1 51.4 50.8B Sector 24.2 28.8 38.8 51.6 45.8 28.8 Total average 2019.12.20 2020.01.22 2020.02.21 2020.03.20 2020.04.20 2020.05.21 34.9 38.7 43.6 21.7 48.0 40.1 55 % -20 % 2020.01.22 2020.02.21 2020.03.20 2020.04.20 2020.05.21 Total of increase rate Total score A Sector 6 % -0 % 6 % -3 % 3 % -9 % 49.0B Sector 16 % 26 % 25 % -13 % -59 % Total average 10 % 11 % -101 % 46 49 49 52 50 51 24 29 39 52 46 29 35 39 44 22 48 40 0 10 20 30 40 50 60 2019.12.20 2020.01.22 2020.02.21 2020.03.20 2020.04.20 2020.05.21 Stock price rise probability score A sector B sector Total average 6% -0% 6% -3% 3% 16% 26% 25% -13% -59% 10% 11% -101% 55% -20% -150% -100% -50% 0% 50% 100% 2020.01.22 2020.02.21 2020.03.20 2020.04.20 2020.05.21 Increase rate of stock price rise A sector B sector Total average sk bioland
- 3. 정보와 완전 정보 결 투자판단 있습니 위배 무단으 숙지하 Compliance notice ① The information provided by The Algorithm Company Analysis Consulting is obtained through reliable data and information and The Algorithm Company Analysis Program (TACAP), but its accuracy or completeness are not guaranteed. Furthermore, it may change over time.Therefore, we are not legally responsible for the results of the data provided by The Algorithm Company Analysis Consulting because of information errors or omissions. ② The Algorithm Company Analysis Consulting and all the information provided on it site are reference materials for investment decisions and the final responsibility of investment is up to users utilizing this information. ③ The Algorithm Company Analysis Consulting and its site do not do anything that violates the related laws such as discretionary transaction. ④ Users can not reallocate and recycle the information provided by The Algorithm Company Analysis Consulting firm let alone the information provided by its Site. ⑤ Be sure to know about application period of this algorithm analysis report in order to improve its accuracy. Tel : 070 - 4667 - 5009 Email : tacac@tacac.co.kr Homepage : tacac.co.kr Blog : tacac.blog.me SERVICES M&A, IPO, RECOVER, CORPORATE RESTRUCTURING, MANAGEMENT OF TECHNOLOGY, BUSINESS STRATEGY, FAMILY BUSINESS Request : http://tacac.co.kr/?page_id=1374 ① Consulting is o The Algorithm accuracy or com change over tim results of the d Consulting bec ② information pr investment dec up ③ do anything th transaction. ④ The Algorithm information pr ⑤ analysis report