lotte shopping 023530 Algorithm Investment Report
•
0 likes•92 views

lotte shopping 023530 Algorithm Investment Report
![[Price for scheduled purchasing]
Arbitrarily made
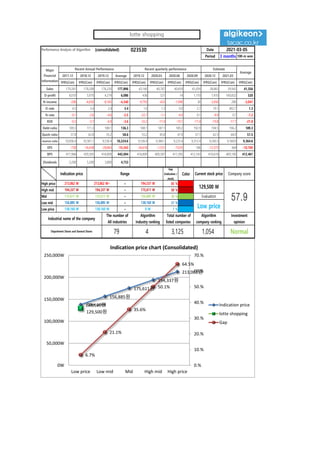
Algorithm stocks Trading Strategies (consolidated) 023530 Date
Period
Gap
(Indication /
stock)
Color
2021-03-05
3 months
Current stock price Evaluation
Stock price rise
probability score
Investment opinion Prospective purchase amount
129,500 W Low price 53.9 Normal 10,000,000 W
Suggested Purchase
Amount 4,525,460 W
Number of stocks
purchased 35
Indication price Range Buying / Selling Buying / Selling [Stocks]
High price 213,062 W 213,062 W~ ~ 194,337 W 65 % -2,920,131 W -14
High mid 194,337 W 194,337 W ~ 175,611 W 50 % -2,265,753 W -12
Mid 175,611 W 175,611 W ~ 156,885 W 36 % -1,611,375 W -9
Low mid 156,885 W 156,885 W ~ 138,160 W 21 % -956,996 W -6
low price 138,160 W 138,160 W ~ 0 W 7 % -302,618 W -2
Stock price rise
probability score
A Sector 49.9 52.3 51.9 49.7 45.3 52.8
53.9
B Sector 12.9 34.6 29.2 49.7 30.8 60.4
Total average
2020.10.06 2020.11.04 2020.12.02 2021.01.04 2021.02.01 2021.03.04
31.4 43.4 40.5 35.8 38.0 56.6
6 % 33 %
2020.11.04 2020.12.02 2021.01.04 2021.02.01 2021.03.04
Total of
increase rate
Total score
A Sector 5 % -1 % -4 % -10 % 14 %
9 % 54.7
B Sector 63 % -19 % 41 % -61 % 49 %
Total average 28 % -7 % -13 %
50 52 52 50
45
53
13
35
29
50
31
60
31
43 41
36 38
57
0
10
20
30
40
50
60
70
2020.10.06 2020.11.04 2020.12.02 2021.01.04 2021.02.01 2021.03.04
Stock price rise probability score
A sector
B sector
Total average
5% -1% -4% -10%
14%
63%
-19%
41%
-61%
49%
28%
-7% -13%
6%
33%
-80%
-60%
-40%
-20%
0%
20%
40%
60%
80%
2020.11.04 2020.12.02 2021.01.04 2021.02.01 2021.03.04
Increase rate of stock price rise
A sector
B sector
Total average
lotte shopping](data:image/gif;base64,R0lGODlhAQABAIAAAAAAAP///yH5BAEAAAAALAAAAAABAAEAAAIBRAA7)
Recommended
Recommended
More Related Content
What's hot
What's hot (20)
Similar to lotte shopping 023530 Algorithm Investment Report
Similar to lotte shopping 023530 Algorithm Investment Report (20)
More from 알고리즘 기업분석 컨설팅-알기컨,algikeon
More from 알고리즘 기업분석 컨설팅-알기컨,algikeon (20)
Recently uploaded
Recently uploaded (20)
lotte shopping 023530 Algorithm Investment Report
- 1. Performance Analysis of Algorithm (consolidated) 023530 Date Period 3 months 100-m won 2017.12 2018.12 2019.12 Average 2019.12 2020.03 2020.06 2020.09 2020.12 2021.03 IFRS(Con) IFRS(Con) IFRS(Con) IFRS(Con) IFRS(Con) IFRS(Con) IFRS(Con) IFRS(Con) IFRS(Con) IFRS(Con) IFRS(Con) Sales 179,261 178,208 176,220 177,896 43,140 40,767 40,459 41,059 38,863 39,942 41,356 O-profit 8,010 5,970 4,279 6,086 436 521 14 1,110 7,410 160,832 520 N-income -206 -4,650 -8,165 -4,340 -9,793 -433 -1,990 30 -3,450 280 -3,047 O-rate 4.5 3.4 2.4 3.4 1.0 1.3 0.0 2.7 19.1 402.7 1.3 N-rate -0.1 -2.6 -4.6 -2.5 -22.7 -1.1 -4.9 0.1 -8.9 0.7 -7.2 ROE -0.2 -3.7 -6.9 -3.6 -33.2 -17.4 -19.1 -17.4 -19.8 -17.7 -21.8 Debt-ratio 109.3 111.3 188.1 136.3 188.1 187.1 189.2 192.9 194.5 196.2 189.3 Quick-ratio 57.8 62.8 55.2 58.6 55.2 45.8 47.9 57.1 62.5 68.9 51.5 reserve-ratio 10,836.4 10,301.1 9,536.4 10,224.6 9,536.4 9,384.1 9,225.4 9,312.4 9,240.3 9,168.9 9,364.6 EPS -728 -16,438 -28,863 -15,343 -34,618 -1,531 -7,035 106 -12,373 364 -10,769 BPS 471,968 439,305 416,809 442,694 416,809 409,587 411,305 412,143 410,618 409,100 412,461 Dividends 5,200 5,200 3,800 4,733 2021-03-05 Major Financial Information Recent Annual Performance Recent quarterly performance Estimate Average Gap (Indication / stock) Color High price ~ 65 % High mid ~ 50 % Mid ~ 36 % Low mid ~ 21 % Low price ~ 7 % Indication price Range Current stock price Company score 194,337 W 194,337 W 175,611 W 175,611 W 175,611 W 156,885 W Evaluation 213,062 W 213,062 W~ 194,337 W 129,500 W 57.9 156,885 W 156,885 W 138,160 W Low price Normal 138,160 W 138,160 W 0 W Industrial name of the company The number of All industries Algorithm Industry ranking Total number of listed companies Algorithm company ranking Investment opinion Department Stores and General Stores 79 4 3,125 1,054 138,160원 156,885원 175,611원 194,337원 213,062원 Low price 129,500원 6.7% 21.1% 35.6% 50.1% 64.5% 0.% 10.% 20.% 30.% 40.% 50.% 60.% 70.% 0W 50,000W 100,000W 150,000W 200,000W 250,000W Low price Low mid Mid High mid High price Indication price chart (Consolidated) Indication price lotte shopping Gap lotte shopping
- 2. [Price for scheduled purchasing] Arbitrarily made Algorithm stocks Trading Strategies (consolidated) 023530 Date Period Gap (Indication / stock) Color 2021-03-05 3 months Current stock price Evaluation Stock price rise probability score Investment opinion Prospective purchase amount 129,500 W Low price 53.9 Normal 10,000,000 W Suggested Purchase Amount 4,525,460 W Number of stocks purchased 35 Indication price Range Buying / Selling Buying / Selling [Stocks] High price 213,062 W 213,062 W~ ~ 194,337 W 65 % -2,920,131 W -14 High mid 194,337 W 194,337 W ~ 175,611 W 50 % -2,265,753 W -12 Mid 175,611 W 175,611 W ~ 156,885 W 36 % -1,611,375 W -9 Low mid 156,885 W 156,885 W ~ 138,160 W 21 % -956,996 W -6 low price 138,160 W 138,160 W ~ 0 W 7 % -302,618 W -2 Stock price rise probability score A Sector 49.9 52.3 51.9 49.7 45.3 52.8 53.9 B Sector 12.9 34.6 29.2 49.7 30.8 60.4 Total average 2020.10.06 2020.11.04 2020.12.02 2021.01.04 2021.02.01 2021.03.04 31.4 43.4 40.5 35.8 38.0 56.6 6 % 33 % 2020.11.04 2020.12.02 2021.01.04 2021.02.01 2021.03.04 Total of increase rate Total score A Sector 5 % -1 % -4 % -10 % 14 % 9 % 54.7 B Sector 63 % -19 % 41 % -61 % 49 % Total average 28 % -7 % -13 % 50 52 52 50 45 53 13 35 29 50 31 60 31 43 41 36 38 57 0 10 20 30 40 50 60 70 2020.10.06 2020.11.04 2020.12.02 2021.01.04 2021.02.01 2021.03.04 Stock price rise probability score A sector B sector Total average 5% -1% -4% -10% 14% 63% -19% 41% -61% 49% 28% -7% -13% 6% 33% -80% -60% -40% -20% 0% 20% 40% 60% 80% 2020.11.04 2020.12.02 2021.01.04 2021.02.01 2021.03.04 Increase rate of stock price rise A sector B sector Total average lotte shopping
- 3. 정보와 완전 정보 결 투자판단 있습니 위배 무단으 숙지하 Compliance notice ① The information provided by The Algorithm Company Analysis Consulting is obtained through reliable data and information and The Algorithm Company Analysis Program (TACAP), but its accuracy or completeness are not guaranteed. Furthermore, it may change over time.Therefore, we are not legally responsible for the results of the data provided by The Algorithm Company Analysis Consulting because of information errors or omissions. ② The Algorithm Company Analysis Consulting and all the information provided on it site are reference materials for investment decisions and the final responsibility of investment is up to users utilizing this information. ③ The Algorithm Company Analysis Consulting and its site do not do anything that violates the related laws such as discretionary transaction. ④ Users can not reallocate and recycle the information provided by The Algorithm Company Analysis Consulting firm let alone the information provided by its Site. ⑤ Be sure to know about application period of this algorithm analysis report in order to improve its accuracy. Tel : 070 - 4667 - 5009 Email : tacac@tacac.co.kr Homepage : tacac.co.kr Blog : tacac.blog.me SERVICES M&A, IPO, RECOVER, CORPORATE RESTRUCTURING, MANAGEMENT OF TECHNOLOGY, BUSINESS STRATEGY, FAMILY BUSINESS Request : http://tacac.co.kr/?page_id=1374 ① Consulting is o The Algorithm accuracy or com change over tim results of the d Consulting bec ② information pr investment dec up ③ do anything th transaction. ④ The Algorithm information pr ⑤ analysis report