Analysis of Algorithm Performance and Financial Indicators
•
0 likes•80 views

This document contains performance data and financial metrics for an algorithm company over several quarters and years. It also includes stock price projections and purchase recommendations based on the company's indication price compared to its current stock price. The analysis assigns the company a normal investment rating and recommends gradually purchasing its stock over the next 3 months if the price drops to certain levels below the indication price.
![[Price for scheduled purchasing]
Arbitrarily made
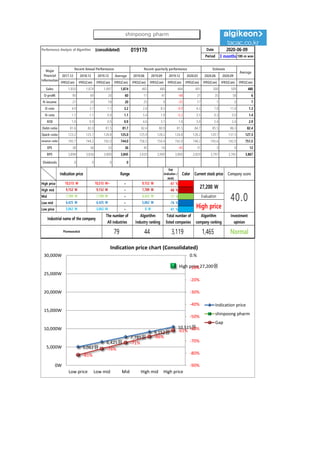
Algorithm stocks Trading Strategies (consolidated) 019170 Date
Period
Gap
(Indication /
stock)
Color
2020-06-09
3 months
Current stock price Evaluation
Stock price rise
probability score
Investment opinion Prospective purchase amount
27,200 W High price 57.4 Normal 2,000,000 W
Suggested Purchase
Amount 652,139 W
Number of stocks
purchased 24
Indication price Range Buying / Selling Buying / Selling [Stocks]
High price 10,515 W 10,515 W~ ~ 9,152 W -61 % 400,032 W 38
High mid 9,152 W 9,152 W ~ 7,789 W -66 % 432,717 W 47
Mid 7,789 W 7,789 W ~ 6,425 W -71 % 465,401 W 60
Low mid 6,425 W 6,425 W ~ 5,062 W -76 % 498,086 W 78
low price 5,062 W 5,062 W ~ 0 W -81 % 530,771 W 105
Stock price rise
probability score
A Sector 49.5 43.0 52.2 46.8 48.2 50.0
57.4B Sector 47.9 44.2 27.1 46.8 17.9 30.0
Total average
2020.01.10 2020.02.11 2020.03.10 2020.04.07 2020.05.11 2020.06.08
48.7 43.6 39.6 22.9 33.1 40.0
31 % 17 %
2020.02.11 2020.03.10 2020.04.07 2020.05.11 2020.06.08
Total of
increase rate
Total score
A Sector -15 % 18 % -11 % 3 % 4 %
-9 % 44.7B Sector -8 % -63 % 42 % -161 % 40 %
Total average -12 % -10 % -73 %
49
43
52
47 48 5048
44
27
47
18
30
49
44
40
23
33
40
0
10
20
30
40
50
60
2020.01.10 2020.02.11 2020.03.10 2020.04.07 2020.05.11 2020.06.08
Stock price rise probability score
A sector
B sector
Total average
-15%
18%
-11%
3% 4%
-8%
-63%
42%
-161%
40%
-12% -10%
-73%
31%
17%
-200%
-150%
-100%
-50%
0%
50%
100%
2020.02.11 2020.03.10 2020.04.07 2020.05.11 2020.06.08
Increase rate of stock price rise
A sector
B sector
Total average
shinpoong pharm](data:image/gif;base64,R0lGODlhAQABAIAAAAAAAP///yH5BAEAAAAALAAAAAABAAEAAAIBRAA7)
Recommended
Recommended
More Related Content
What's hot
What's hot (20)
Similar to Analysis of Algorithm Performance and Financial Indicators
Similar to Analysis of Algorithm Performance and Financial Indicators (19)
More from 알고리즘 기업분석 컨설팅-알기컨,algikeon
More from 알고리즘 기업분석 컨설팅-알기컨,algikeon (20)
Recently uploaded
Recently uploaded (20)
Analysis of Algorithm Performance and Financial Indicators
- 1. Performance Analysis of Algorithm (consolidated) 019170 Date Period 3 months 100-m won 2017.12 2018.12 2019.12 Average 2019.06 2019.09 2019.12 2020.03 2020.06 2020.09 IFRS(Con) IFRS(Con) IFRS(Con) IFRS(Con) IFRS(Con) IFRS(Con) IFRS(Con) IFRS(Con) IFRS(Con) IFRS(Con) IFRS(Con) Sales 1,850 1,874 1,897 1,874 465 480 484 491 500 509 480 O-profit 90 69 20 60 11 41 -48 21 35 58 6 N-income 21 20 18 20 25 9 -25 17 1 0 7 O-rate 4.9 3.7 1.1 3.2 2.4 8.5 -9.9 4.3 7.0 11.4 1.3 N-rate 1.1 1.1 0.9 1.1 5.4 1.9 -5.2 3.5 0.3 0.0 1.4 ROE 1.0 0.9 0.9 0.9 4.6 3.1 1.0 3.0 2.4 2.4 2.9 Debt-ratio 81.6 82.0 81.5 81.7 82.4 80.9 81.5 84.7 85.5 86.3 82.4 Quick-ratio 123.2 125.1 126.8 125.0 125.9 128.2 126.8 128.2 129.7 131.5 127.3 reserve-ratio 745.7 744.2 742.0 744.0 756.5 759.4 742.0 748.2 745.6 742.9 751.5 EPS 38 36 33 36 45 16 -45 31 3 0 12 BPS 3,898 3,836 3,800 3,845 3,929 3,909 3,800 3,829 3,797 3,765 3,867 Dividends 0 0 0 0 2020-06-09 Major Financial Information Recent Annual Performance Recent quarterly performance Estimate Average Gap (Indication / stock) Color High price ~ -61 % High mid ~ -66 % Mid ~ -71 % Low mid ~ -76 % Low price ~ -81 % Indication price Range Current stock price Company score 9,152 W 9,152 W 7,789 W 7,789 W 7,789 W 6,425 W Evaluation 10,515 W 10,515 W~ 9,152 W 27,200 W 40.06,425 W 6,425 W 5,062 W High price Normal 5,062 W 5,062 W 0 W Industrial name of the company The number of All industries Algorithm Industry ranking Total number of listed companies Algorithm company ranking Investment opinion Pharmaceutical 79 44 3,119 1,465 5,062원 6,425원 7,789원 9,152원 10,515원 High price 27,200원 -81% -76% -71% -66% -61% -90% -80% -70% -60% -50% -40% -30% -20% -10% 0.% 0W 5,000W 10,000W 15,000W 20,000W 25,000W 30,000W Low price Low mid Mid High mid High price Indication price chart (Consolidated) Indication price shinpoong pharm Gap shinpoong pharm
- 2. [Price for scheduled purchasing] Arbitrarily made Algorithm stocks Trading Strategies (consolidated) 019170 Date Period Gap (Indication / stock) Color 2020-06-09 3 months Current stock price Evaluation Stock price rise probability score Investment opinion Prospective purchase amount 27,200 W High price 57.4 Normal 2,000,000 W Suggested Purchase Amount 652,139 W Number of stocks purchased 24 Indication price Range Buying / Selling Buying / Selling [Stocks] High price 10,515 W 10,515 W~ ~ 9,152 W -61 % 400,032 W 38 High mid 9,152 W 9,152 W ~ 7,789 W -66 % 432,717 W 47 Mid 7,789 W 7,789 W ~ 6,425 W -71 % 465,401 W 60 Low mid 6,425 W 6,425 W ~ 5,062 W -76 % 498,086 W 78 low price 5,062 W 5,062 W ~ 0 W -81 % 530,771 W 105 Stock price rise probability score A Sector 49.5 43.0 52.2 46.8 48.2 50.0 57.4B Sector 47.9 44.2 27.1 46.8 17.9 30.0 Total average 2020.01.10 2020.02.11 2020.03.10 2020.04.07 2020.05.11 2020.06.08 48.7 43.6 39.6 22.9 33.1 40.0 31 % 17 % 2020.02.11 2020.03.10 2020.04.07 2020.05.11 2020.06.08 Total of increase rate Total score A Sector -15 % 18 % -11 % 3 % 4 % -9 % 44.7B Sector -8 % -63 % 42 % -161 % 40 % Total average -12 % -10 % -73 % 49 43 52 47 48 5048 44 27 47 18 30 49 44 40 23 33 40 0 10 20 30 40 50 60 2020.01.10 2020.02.11 2020.03.10 2020.04.07 2020.05.11 2020.06.08 Stock price rise probability score A sector B sector Total average -15% 18% -11% 3% 4% -8% -63% 42% -161% 40% -12% -10% -73% 31% 17% -200% -150% -100% -50% 0% 50% 100% 2020.02.11 2020.03.10 2020.04.07 2020.05.11 2020.06.08 Increase rate of stock price rise A sector B sector Total average shinpoong pharm
- 3. 정보와 완전 정보 결 투자판단 있습니 위배 무단으 숙지하 Compliance notice ① The information provided by The Algorithm Company Analysis Consulting is obtained through reliable data and information and The Algorithm Company Analysis Program (TACAP), but its accuracy or completeness are not guaranteed. Furthermore, it may change over time.Therefore, we are not legally responsible for the results of the data provided by The Algorithm Company Analysis Consulting because of information errors or omissions. ② The Algorithm Company Analysis Consulting and all the information provided on it site are reference materials for investment decisions and the final responsibility of investment is up to users utilizing this information. ③ The Algorithm Company Analysis Consulting and its site do not do anything that violates the related laws such as discretionary transaction. ④ Users can not reallocate and recycle the information provided by The Algorithm Company Analysis Consulting firm let alone the information provided by its Site. ⑤ Be sure to know about application period of this algorithm analysis report in order to improve its accuracy. Tel : 070 - 4667 - 5009 Email : tacac@tacac.co.kr Homepage : tacac.co.kr Blog : tacac.blog.me SERVICES M&A, IPO, RECOVER, CORPORATE RESTRUCTURING, MANAGEMENT OF TECHNOLOGY, BUSINESS STRATEGY, FAMILY BUSINESS Request : http://tacac.co.kr/?page_id=1374 ① Consulting is o The Algorithm accuracy or com change over tim results of the d Consulting bec ② information pr investment dec up ③ do anything th transaction. ④ The Algorithm information pr ⑤ analysis report