kolon TissueGene 950160 Algorithm Investment Report
•
0 likes•108 views

kolon TissueGene 950160 Algorithm Investment Report
![[Price for scheduled purchasing]
Arbitrarily made
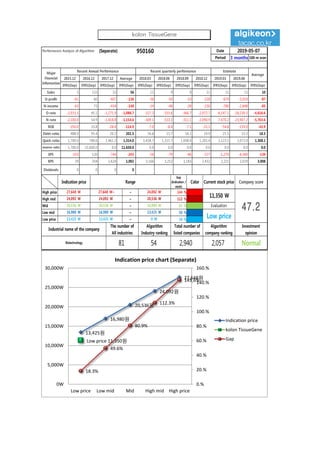
Algorithm stocks Trading Strategies (Separate) 950160 Date
Period
Gap
(Indication /
stock)
Color
2019-05-07
3 months
Current stock price Evaluation
Stock price rise
probability score
Investment opinion Prospective purchase amount
11,350 W Low price 37.6 Normal 3,500,000 W
Suggested Purchase
Amount 1,176,258 W
Number of stocks
purchased 104
Indication price Range Buying / Selling Buying / Selling [Stocks]
High price 27,648 W 27,648 W~ ~ 24,092 W 144 % -1,688,998 W All selling
High mid 24,092 W 24,092 W ~ 20,536 W 112 % -1,320,498 W All selling
Mid 20,536 W 20,536 W ~ 16,980 W 81 % -951,997 W -46
Low mid 16,980 W 16,980 W ~ 13,425 W 50 % -583,497 W -34
low price 13,425 W 13,425 W ~ 0 W 18 % -214,997 W -16
2018.12.04 2019.01.04 2019.02.01 2019.03.07 2019.04.04 2019.05.03
22.5 51.8 48.8
Stock price rise
probability score
A Sector 47.0 45.8 46.6 46.4 51.8 47.9
37.6B Sector 20.8 43.8 46.4 46.4 51.7 49.6
Total average 33.9 44.8 36.2
57 % -6 %
2019.01.04 2019.02.01 2019.03.07 2019.04.04 2019.05.03
Total of
increase rate
Total score
A Sector -3 % 2 % -0 % 10 % -8 %
-2 % 50.3B Sector 52 % -69 % 44 % 10 % -4 %
Total average 24 % -24 % -61 %
-3% 2% -0%
10%
-8%
52%
-69%
44%
10%
-4%
24%
-24%
-61%
57%
-6%
-80%
-60%
-40%
-20%
0%
20%
40%
60%
80%
2019.01.04 2019.02.01 2019.03.07 2019.04.04 2019.05.03
Increase rate of stock price rise
A sector
B sector
Total average
kolon TissueGene
47 46 47 46
52
48
21
44
26
46
52 50
34
45
36
23
52
49
0
10
20
30
40
50
60
2018.12.04 2019.01.04 2019.02.01 2019.03.07 2019.04.04 2019.05.03
Stock price rise probability score
A sector
B sector
Total average](data:image/gif;base64,R0lGODlhAQABAIAAAAAAAP///yH5BAEAAAAALAAAAAABAAEAAAIBRAA7)
Recommended
Recommended
More Related Content
What's hot
What's hot (20)
Similar to kolon TissueGene 950160 Algorithm Investment Report
Similar to kolon TissueGene 950160 Algorithm Investment Report (20)
More from 알고리즘 기업분석 컨설팅-알기컨,algikeon
More from 알고리즘 기업분석 컨설팅-알기컨,algikeon (20)
Recently uploaded
Recently uploaded (20)
kolon TissueGene 950160 Algorithm Investment Report
- 1. Performance Analysis of Algorithm (Separate) 950160 Date Period 3 months 100-m won 2015.12 2016.12 2017.12 Average 2018.03 2018.06 2018.09 2018.12 2019.03 2019.06 IFRS(Sep) IFRS(Sep) IFRS(Sep) IFRS(Sep) IFRS(Sep) IFRS(Sep) IFRS(Sep) IFRS(Sep) IFRS(Sep) IFRS(Sep) IFRS(Sep) Sales 3 133 32 56 11 9 9 11 11 11 10 O-profit -61 60 -407 -136 -36 -50 -33 -228 -679 -2,019 -87 N-income -63 73 -454 -148 -34 -48 -28 -230 -780 -2,648 -85 O-rate -2,033.3 45.1 -1,271.9 -1,086.7 -327.3 -555.6 -366.7 -2,072.7 -6,147.1 -18,230.5 -4,616.6 N-rate -2,100.0 54.9 -1,418.8 -1,154.6 -309.1 -533.3 -311.1 -2,090.9 -7,070.2 -23,907.2 -5,703.6 ROE -350.0 33.8 -28.4 -114.9 -7.0 -8.4 -7.1 -21.1 -54.8 -159.0 -42.9 Debt-ratio 488.9 95.4 20.2 201.5 16.6 15.7 14.1 19.9 21.5 23.2 18.5 Quick-ratio 1,700.0 780.6 1,461.2 1,314.0 1,438.7 1,315.7 1,698.0 1,201.4 1,123.1 1,072.0 1,308.1 reserve-ratio 1,700.0 21,600.0 0.0 11,650.0 0.0 0.0 0.0 0.0 0.0 0.0 0.0 EPS -103 120 -744 -243 -56 -79 -46 -377 -1,279 -4,340 -139 BPS 29 354 2,624 1,002 3,166 3,252 3,183 2,432 2,221 2,029 3,008 Dividends 0 0 0 0 2019-05-07 Major Financial Information Recent Annual Performance Recent quarterly performance Estimate Average Gap (Indication / stock) Color High price ~ 144 % High mid ~ 112 % Mid ~ 81 % Low mid ~ 50 % Low price ~ 18 % Indication price Range Current stock price Company score 24,092 W 24,092 W 20,536 W 20,536 W 20,536 W 16,980 W Evaluation 27,648 W 27,648 W~ 24,092 W 11,350 W 47.216,980 W 16,980 W 13,425 W Low price Normal 13,425 W 13,425 W 0 W Industrial name of the company The number of All industries Algorithm Industry ranking Total number of listed companies Algorithm company ranking Investment opinion Biotechnology 81 54 2,940 2,057 13,425원 16,980원 20,536원 24,092원 27,648원 Low price 11,350원 18.3% 49.6% 80.9% 112.3% 143.6% 0.% 20.% 40.% 60.% 80.% 100.% 120.% 140.% 160.% 0W 5,000W 10,000W 15,000W 20,000W 25,000W 30,000W Low price Low mid Mid High mid High price Indication price chart (Separate) Indication price kolon TissueGene Gap kolon TissueGene
- 2. [Price for scheduled purchasing] Arbitrarily made Algorithm stocks Trading Strategies (Separate) 950160 Date Period Gap (Indication / stock) Color 2019-05-07 3 months Current stock price Evaluation Stock price rise probability score Investment opinion Prospective purchase amount 11,350 W Low price 37.6 Normal 3,500,000 W Suggested Purchase Amount 1,176,258 W Number of stocks purchased 104 Indication price Range Buying / Selling Buying / Selling [Stocks] High price 27,648 W 27,648 W~ ~ 24,092 W 144 % -1,688,998 W All selling High mid 24,092 W 24,092 W ~ 20,536 W 112 % -1,320,498 W All selling Mid 20,536 W 20,536 W ~ 16,980 W 81 % -951,997 W -46 Low mid 16,980 W 16,980 W ~ 13,425 W 50 % -583,497 W -34 low price 13,425 W 13,425 W ~ 0 W 18 % -214,997 W -16 2018.12.04 2019.01.04 2019.02.01 2019.03.07 2019.04.04 2019.05.03 22.5 51.8 48.8 Stock price rise probability score A Sector 47.0 45.8 46.6 46.4 51.8 47.9 37.6B Sector 20.8 43.8 46.4 46.4 51.7 49.6 Total average 33.9 44.8 36.2 57 % -6 % 2019.01.04 2019.02.01 2019.03.07 2019.04.04 2019.05.03 Total of increase rate Total score A Sector -3 % 2 % -0 % 10 % -8 % -2 % 50.3B Sector 52 % -69 % 44 % 10 % -4 % Total average 24 % -24 % -61 % -3% 2% -0% 10% -8% 52% -69% 44% 10% -4% 24% -24% -61% 57% -6% -80% -60% -40% -20% 0% 20% 40% 60% 80% 2019.01.04 2019.02.01 2019.03.07 2019.04.04 2019.05.03 Increase rate of stock price rise A sector B sector Total average kolon TissueGene 47 46 47 46 52 48 21 44 26 46 52 50 34 45 36 23 52 49 0 10 20 30 40 50 60 2018.12.04 2019.01.04 2019.02.01 2019.03.07 2019.04.04 2019.05.03 Stock price rise probability score A sector B sector Total average
- 3. may ded by Compliance notice ① The information provided by The Algorithm Company Analysis Consulting is obtained through reliable data and information and The Algorithm Company Analysis Program (TACAP), but its accuracy or completeness are not guaranteed. Furthermore, it may change over time.Therefore, we are not legally responsible for the results of the data provided by The Algorithm Company Analysis Consulting because of information errors or omissions. ② The Algorithm Company Analysis Consulting and all the information provided on it site are reference materials for investment decisions and the final responsibility of investment is up to users utilizing this information. ③ The Algorithm Company Analysis Consulting and its site do not do anything that violates the related laws such as discretionary transaction. ④ Users can not reallocate and recycle the information provided by The Algorithm Company Analysis Consulting firm let alone the information provided by its Site. ⑤ Be sure to know about application period of this algorithm analysis report in order to improve its accuracy. Tel : 070 - 4667 - 5009 Email : tacac@tacac.co.kr Homepage : tacac.co.kr Blog : tacac.blog.me SERVICES EDUCATION, M&A, IPO, RECOVER, CORPORATE RESTRUCTURING, MANAGEMENT OF TECHNOLOGY, BUSINESS STRATEGY, FAMILY BUSINESS Request : http://tacac.co.kr/?page_id=1374