hitejinroholdings 000140 Algorithm Investment Report
•
0 likes•61 views

This document provides analysis of the Algorithm company's performance over time and recommendations for purchasing its stocks. It includes tables with the company's financial metrics from 2016-2020, charts showing the indication price range and probability of price increases. Based on a current stock price of 12,300 won and a normal evaluation, it recommends purchasing 3,758,821 won worth of shares, around 306 stocks. It also provides analysis of the company's A and B sectors stock price increase probabilities over time.
![[Price for scheduled purchasing]
Arbitrarily made
Algorithm stocks Trading Strategies (consolidated) 000140 Date
Period
Gap
(Indication /
stock)
Color
2020-04-09
3 months
Current stock price Evaluation
Stock price rise
probability score
Investment opinion Prospective purchase amount
12,300 W Low price 62.3 Normal 8,000,000 W
Suggested Purchase
Amount 3,758,821 W
Number of stocks
purchased 306
Indication price Range Buying / Selling Buying / Selling [Stocks]
High price 21,561 W 21,561 W~ ~ 20,006 W 75 % -2,830,041 W -131
High mid 20,006 W 20,006 W ~ 18,451 W 63 % -2,354,825 W -118
Mid 18,451 W 18,451 W ~ 16,896 W 50 % -1,879,609 W -102
Low mid 16,896 W 16,896 W ~ 15,341 W 37 % -1,404,393 W -83
low price 15,341 W 15,341 W ~ 0 W 25 % -929,177 W -61
Stock price rise
probability score
A Sector 45.6 47.0 46.8 47.0 44.3 42.8
62.3B Sector 29.6 52.1 45.0 47.0 34.6 45.4
Total average
2019.11.13 2019.12.11 2020.01.13 2020.02.12 2020.03.11 2020.04.08
37.6 49.6 45.9 44.6 39.4 44.1
-13 % 11 %
2019.12.11 2020.01.13 2020.02.12 2020.03.11 2020.04.08
Total of
increase rate
Total score
A Sector 3 % -0 % 0 % -6 % -3 %
2 % 48.7B Sector 43 % -16 % 4 % -36 % 24 %
Total average 24 % -8 % -3 %
46 47 47 47
44 43
30
52
45 47
35
45
38
50
46 45
39
44
0
10
20
30
40
50
60
2019.11.13 2019.12.11 2020.01.13 2020.02.12 2020.03.11 2020.04.08
Stock price rise probability score
A sector
B sector
Total average
3% -0% 0%
-6% -3%
43%
-16%
4%
-36%
24%24%
-8%
-3%
-13%
11%
-40%
-20%
0%
20%
40%
60%
2019.12.11 2020.01.13 2020.02.12 2020.03.11 2020.04.08
Increase rate of stock price rise
A sector
B sector
Total average
hitejinroholdings](data:image/gif;base64,R0lGODlhAQABAIAAAAAAAP///yH5BAEAAAAALAAAAAABAAEAAAIBRAA7)
Recommended
Recommended
More Related Content
What's hot
What's hot (20)
Similar to hitejinroholdings 000140 Algorithm Investment Report
Similar to hitejinroholdings 000140 Algorithm Investment Report (16)
More from 알고리즘 기업분석 컨설팅-알기컨,algikeon
More from 알고리즘 기업분석 컨설팅-알기컨,algikeon (20)
Recently uploaded
Recently uploaded (20)
hitejinroholdings 000140 Algorithm Investment Report
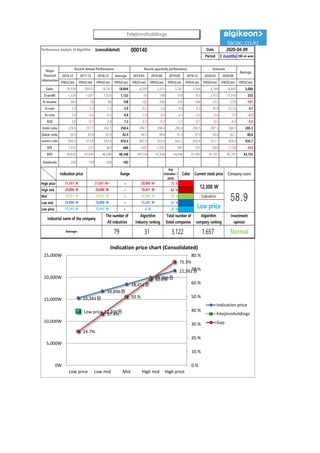
- 1. Performance Analysis of Algorithm (consolidated) 000140 Date Period 3 months 100-m won 2016.12 2017.12 2018.12 Average 2019.03 2019.06 2019.09 2019.12 2020.03 2020.06 IFRS(Con) IFRS(Con) IFRS(Con) IFRS(Con) IFRS(Con) IFRS(Con) IFRS(Con) IFRS(Con) IFRS(Con) IFRS(Con) IFRS(Con) Sales 18,954 18,812 18,767 18,844 4,209 5,221 5,267 5,566 6,189 6,883 5,066 O-profit 1,329 1,001 1,035 1,122 -10 148 518 353 2,472 17,316 252 N-income 463 -76 86 158 -165 -306 235 -166 -212 -270 -101 O-rate 7.0 5.3 5.5 5.9 -0.2 2.8 9.8 6.3 39.9 251.6 4.7 N-rate 2.4 -0.4 0.5 0.8 -3.9 -5.9 4.5 -3.0 -3.4 -3.9 -2.1 ROE 3.8 -0.7 0.8 1.3 -6.3 -9.2 -2.2 -6.1 -6.5 -6.9 -5.9 Debt-ratio 229.6 257.7 264.1 250.4 282.1 288.4 280.4 290.5 287.3 284.1 285.3 Quick-ratio 39.5 45.8 42.0 42.4 44.5 38.8 41.3 37.9 39.8 42.1 40.6 reserve-ratio 996.0 973.8 959.4 976.4 947.0 933.0 942.2 920.4 912.1 904.0 935.7 EPS 1,955 -321 363 666 -697 -1,292 993 -701 -893 -1,138 -424 BPS 50,829 47,936 46,280 48,348 44,118 42,956 44,046 41,499 41,101 40,707 43,155 Dividends 200 150 200 183 2020-04-09 Major Financial Information Recent Annual Performance Recent quarterly performance Estimate Average Gap (Indication / stock) Color High price ~ 75 % High mid ~ 63 % Mid ~ 50 % Low mid ~ 37 % Low price ~ 25 % Indication price Range Current stock price Company score 20,006 W 20,006 W 18,451 W 18,451 W 18,451 W 16,896 W Evaluation 21,561 W 21,561 W~ 20,006 W 12,300 W 58.916,896 W 16,896 W 15,341 W Low price Normal 15,341 W 15,341 W 0 W Industrial name of the company The number of All industries Algorithm Industry ranking Total number of listed companies Algorithm company ranking Investment opinion Beverages 79 31 3,122 1,657 15,341원 16,896원 18,451원 20,006원 21,561원 Low price 12,300원 24.7% 37.4% 50.% 62.6% 75.3% 0.% 10.% 20.% 30.% 40.% 50.% 60.% 70.% 80.% 0W 5,000W 10,000W 15,000W 20,000W 25,000W Low price Low mid Mid High mid High price Indication price chart (Consolidated) Indication price hitejinroholdings Gap hitejinroholdings
- 2. [Price for scheduled purchasing] Arbitrarily made Algorithm stocks Trading Strategies (consolidated) 000140 Date Period Gap (Indication / stock) Color 2020-04-09 3 months Current stock price Evaluation Stock price rise probability score Investment opinion Prospective purchase amount 12,300 W Low price 62.3 Normal 8,000,000 W Suggested Purchase Amount 3,758,821 W Number of stocks purchased 306 Indication price Range Buying / Selling Buying / Selling [Stocks] High price 21,561 W 21,561 W~ ~ 20,006 W 75 % -2,830,041 W -131 High mid 20,006 W 20,006 W ~ 18,451 W 63 % -2,354,825 W -118 Mid 18,451 W 18,451 W ~ 16,896 W 50 % -1,879,609 W -102 Low mid 16,896 W 16,896 W ~ 15,341 W 37 % -1,404,393 W -83 low price 15,341 W 15,341 W ~ 0 W 25 % -929,177 W -61 Stock price rise probability score A Sector 45.6 47.0 46.8 47.0 44.3 42.8 62.3B Sector 29.6 52.1 45.0 47.0 34.6 45.4 Total average 2019.11.13 2019.12.11 2020.01.13 2020.02.12 2020.03.11 2020.04.08 37.6 49.6 45.9 44.6 39.4 44.1 -13 % 11 % 2019.12.11 2020.01.13 2020.02.12 2020.03.11 2020.04.08 Total of increase rate Total score A Sector 3 % -0 % 0 % -6 % -3 % 2 % 48.7B Sector 43 % -16 % 4 % -36 % 24 % Total average 24 % -8 % -3 % 46 47 47 47 44 43 30 52 45 47 35 45 38 50 46 45 39 44 0 10 20 30 40 50 60 2019.11.13 2019.12.11 2020.01.13 2020.02.12 2020.03.11 2020.04.08 Stock price rise probability score A sector B sector Total average 3% -0% 0% -6% -3% 43% -16% 4% -36% 24%24% -8% -3% -13% 11% -40% -20% 0% 20% 40% 60% 2019.12.11 2020.01.13 2020.02.12 2020.03.11 2020.04.08 Increase rate of stock price rise A sector B sector Total average hitejinroholdings
- 3. 정보와 완전 정보 결 투자판단 있습니 위배 무단으 숙지하 Compliance notice ① The information provided by The Algorithm Company Analysis Consulting is obtained through reliable data and information and The Algorithm Company Analysis Program (TACAP), but its accuracy or completeness are not guaranteed. Furthermore, it may change over time.Therefore, we are not legally responsible for the results of the data provided by The Algorithm Company Analysis Consulting because of information errors or omissions. ② The Algorithm Company Analysis Consulting and all the information provided on it site are reference materials for investment decisions and the final responsibility of investment is up to users utilizing this information. ③ The Algorithm Company Analysis Consulting and its site do not do anything that violates the related laws such as discretionary transaction. ④ Users can not reallocate and recycle the information provided by The Algorithm Company Analysis Consulting firm let alone the information provided by its Site. ⑤ Be sure to know about application period of this algorithm analysis report in order to improve its accuracy. Tel : 070 - 4667 - 5009 Email : tacac@tacac.co.kr Homepage : tacac.co.kr Blog : tacac.blog.me SERVICES M&A, IPO, RECOVER, CORPORATE RESTRUCTURING, MANAGEMENT OF TECHNOLOGY, BUSINESS STRATEGY, FAMILY BUSINESS Request : http://tacac.co.kr/?page_id=1374 ① Consulting is o The Algorithm accuracy or com change over tim results of the d Consulting bec ② information pr investment dec up ③ do anything th transaction. ④ The Algorithm information pr ⑤ analysis report