Algorithm Performance and Financial Analysis
•
0 likes•97 views

This document analyzes the performance and financial metrics of Algorithm company over several periods from 2017-2020. It shows sales, operating profit, net income, operating rate, net rate, ROE, debt ratio, quick ratio and other metrics on a quarterly and annual basis. It also provides the company's current stock price, indication price range, and evaluation. A chart shows the indication price range. Tables also show the company's industry, ranking, a suggested purchase amount and number of stocks to purchase at different price levels. Graphs show the stock price rise probability score and increase rates over time for the company versus industry averages.
![[Price for scheduled purchasing]
Arbitrarily made
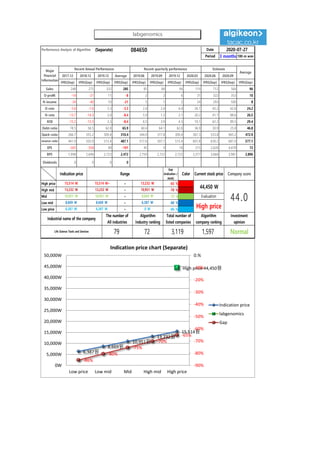
Algorithm stocks Trading Strategies (Separate) 084650 Date
Period
Gap
(Indication /
stock)
Color
2020-07-27
3 months
Current stock price Evaluation
Stock price rise
probability score
Investment opinion Prospective purchase amount
44,450 W High price 47.6 Normal 3,000,000 W
Suggested Purchase
Amount 832,806 W
Number of stocks
purchased 19
Indication price Range Buying / Selling Buying / Selling [Stocks]
High price 15,514 W 15,514 W~ ~ 13,232 W -65 % 542,137 W 35
High mid 13,232 W 13,232 W ~ 10,951 W -70 % 584,887 W 44
Mid 10,951 W 10,951 W ~ 8,669 W -75 % 627,636 W 57
Low mid 8,669 W 8,669 W ~ 6,387 W -80 % 670,386 W 77
low price 6,387 W 6,387 W ~ 0 W -86 % 713,136 W 112
2020.03.02 2020.03.30 2020.04.28 2020.05.29 2020.06.26 2020.07.24
37.5 44.5 40.2
Stock price rise
probability score
A Sector 51.6 44.3 55.4 51.9 43.6 50.4
47.6B Sector 20.4 30.8 51.9 51.9 45.4 30.0
Total average 36.0 37.5 46.5
16 % -11 %
2020.03.30 2020.04.28 2020.05.29 2020.06.26 2020.07.24
Total of
increase rate
Total score
A Sector -17 % 20 % -7 % -19 % 13 %
1 % 48.7B Sector 34 % 18 % 28 % -14 % -51 %
Total average 4 % 19 % -24 %
-17%
20%
-7%
-19%
13%
34%
18%
28%
-14%
-51%
4%
19%
-24%
16%
-11%
-60%
-40%
-20%
0%
20%
40%
2020.03.30 2020.04.28 2020.05.29 2020.06.26 2020.07.24
Increase rate of stock price rise
A sector
B sector
Total average
labgenomics
52
44
55
52
44
50
20
31
38
52
45
30
36 38
46
38
45
40
0
10
20
30
40
50
60
2020.03.02 2020.03.30 2020.04.28 2020.05.29 2020.06.26 2020.07.24
Stock price rise probability score
A sector
B sector
Total average](data:image/gif;base64,R0lGODlhAQABAIAAAAAAAP///yH5BAEAAAAALAAAAAABAAEAAAIBRAA7)
Recommended
Recommended
More Related Content
What's hot
What's hot (20)
Similar to Algorithm Performance and Financial Analysis
Similar to Algorithm Performance and Financial Analysis (20)
More from 알고리즘 기업분석 컨설팅-알기컨,algikeon
More from 알고리즘 기업분석 컨설팅-알기컨,algikeon (20)
Recently uploaded
Recently uploaded (20)
Algorithm Performance and Financial Analysis
- 1. Performance Analysis of Algorithm (Separate) 084650 Date Period 3 months 100-m won 2017.12 2018.12 2019.12 Average 2019.06 2019.09 2019.12 2020.03 2020.06 2020.09 IFRS(Sep) IFRS(Sep) IFRS(Sep) IFRS(Sep) IFRS(Sep) IFRS(Sep) IFRS(Sep) IFRS(Sep) IFRS(Sep) IFRS(Sep) IFRS(Sep) Sales 248 275 332 285 85 84 94 119 712 564 96 O-profit -14 -21 11 -8 2 2 6 31 322 353 10 N-income -34 -40 10 -21 5 1 2 24 293 500 8 O-rate -5.6 -7.6 3.3 -3.3 2.4 2.4 6.4 26.1 45.2 62.6 24.2 N-rate -13.7 -14.5 3.0 -8.4 5.9 1.2 2.1 20.2 41.1 88.6 26.5 ROE -15.2 -13.3 3.3 -8.4 6.5 3.9 4.3 10.1 62.2 89.5 29.4 Debt-ratio 78.5 56.5 62.8 65.9 60.4 64.1 62.8 36.9 30.9 25.8 46.8 Quick-ratio 266.7 355.2 309.4 310.4 344.0 317.8 309.4 367.3 533.8 965.2 472.9 reserve-ratio 441.9 503.9 515.4 487.1 517.6 507.7 515.4 601.8 639.2 681.0 577.1 EPS -305 -358 90 -191 45 9 18 215 2,626 4,478 72 BPS 1,998 2,696 2,723 2,472 2,759 2,723 2,723 3,377 3,666 3,981 2,896 Dividends 0 0 0 0 2020-07-27 Major Financial Information Recent Annual Performance Recent quarterly performance Estimate Average Gap (Indication / stock) Color High price ~ -65 % High mid ~ -70 % Mid ~ -75 % Low mid ~ -80 % Low price ~ -86 % Indication price Range Current stock price Company score 13,232 W 13,232 W 10,951 W 10,951 W 10,951 W 8,669 W Evaluation 15,514 W 15,514 W~ 13,232 W 44,450 W 44.08,669 W 8,669 W 6,387 W High price Normal 6,387 W 6,387 W 0 W Industrial name of the company The number of All industries Algorithm Industry ranking Total number of listed companies Algorithm company ranking Investment opinion Life Science Tools and Services 79 72 3,119 1,597 6,387원 8,669원 10,951원 13,232원 15,514원 High price 44,450원 -86% -80% -75% -70% -65% -90% -80% -70% -60% -50% -40% -30% -20% -10% 0.% 0W 5,000W 10,000W 15,000W 20,000W 25,000W 30,000W 35,000W 40,000W 45,000W 50,000W Low price Low mid Mid High mid High price Indication price chart (Separate) Indication price labgenomics Gap labgenomics
- 2. [Price for scheduled purchasing] Arbitrarily made Algorithm stocks Trading Strategies (Separate) 084650 Date Period Gap (Indication / stock) Color 2020-07-27 3 months Current stock price Evaluation Stock price rise probability score Investment opinion Prospective purchase amount 44,450 W High price 47.6 Normal 3,000,000 W Suggested Purchase Amount 832,806 W Number of stocks purchased 19 Indication price Range Buying / Selling Buying / Selling [Stocks] High price 15,514 W 15,514 W~ ~ 13,232 W -65 % 542,137 W 35 High mid 13,232 W 13,232 W ~ 10,951 W -70 % 584,887 W 44 Mid 10,951 W 10,951 W ~ 8,669 W -75 % 627,636 W 57 Low mid 8,669 W 8,669 W ~ 6,387 W -80 % 670,386 W 77 low price 6,387 W 6,387 W ~ 0 W -86 % 713,136 W 112 2020.03.02 2020.03.30 2020.04.28 2020.05.29 2020.06.26 2020.07.24 37.5 44.5 40.2 Stock price rise probability score A Sector 51.6 44.3 55.4 51.9 43.6 50.4 47.6B Sector 20.4 30.8 51.9 51.9 45.4 30.0 Total average 36.0 37.5 46.5 16 % -11 % 2020.03.30 2020.04.28 2020.05.29 2020.06.26 2020.07.24 Total of increase rate Total score A Sector -17 % 20 % -7 % -19 % 13 % 1 % 48.7B Sector 34 % 18 % 28 % -14 % -51 % Total average 4 % 19 % -24 % -17% 20% -7% -19% 13% 34% 18% 28% -14% -51% 4% 19% -24% 16% -11% -60% -40% -20% 0% 20% 40% 2020.03.30 2020.04.28 2020.05.29 2020.06.26 2020.07.24 Increase rate of stock price rise A sector B sector Total average labgenomics 52 44 55 52 44 50 20 31 38 52 45 30 36 38 46 38 45 40 0 10 20 30 40 50 60 2020.03.02 2020.03.30 2020.04.28 2020.05.29 2020.06.26 2020.07.24 Stock price rise probability score A sector B sector Total average
- 3. may ded by Compliance notice ① The information provided by The Algorithm Company Analysis Consulting is obtained through reliable data and information and The Algorithm Company Analysis Program (TACAP), but its accuracy or completeness are not guaranteed. Furthermore, it may change over time.Therefore, we are not legally responsible for the results of the data provided by The Algorithm Company Analysis Consulting because of information errors or omissions. ② The Algorithm Company Analysis Consulting and all the information provided on it site are reference materials for investment decisions and the final responsibility of investment is up to users utilizing this information. ③ The Algorithm Company Analysis Consulting and its site do not do anything that violates the related laws such as discretionary transaction. ④ Users can not reallocate and recycle the information provided by The Algorithm Company Analysis Consulting firm let alone the information provided by its Site. ⑤ Be sure to know about application period of this algorithm analysis report in order to improve its accuracy. Tel : 070 - 4667 - 5009 Email : tacac@tacac.co.kr Homepage : tacac.co.kr Blog : tacac.blog.me SERVICES M&A, IPO, RECOVER, CORPORATE RESTRUCTURING, MANAGEMENT OF TECHNOLOGY, BUSINESS STRATEGY, FAMILY BUSINESS Request : http://tacac.co.kr/?page_id=1374