kepco kps 051600 Algorithm Investment Report
•
1 like•166 views

kepco kps 051600 Algorithm Investment Report
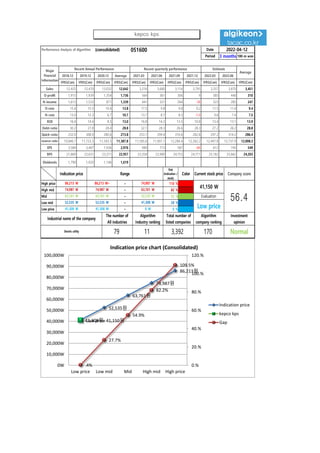
![[Price for scheduled purchasing]
Arbitrarily made
Algorithm stocks Trading Strategies (consolidated) 051600 Date
Period
Gap
(Indication /
stock)
Color
low price 41,308 W 41,308 W ~ 0 W 0 % -18,093 W -0
Low mid 52,535 W 52,535 W ~ 41,308 W 28 % -1,300,254 W -25
Mid 63,761 W 63,761 W ~ 52,535 W 55 % -2,582,416 W -41
High mid 74,987 W 74,987 W ~ 63,761 W 82 % -3,864,578 W -52
Suggested Purchase
Amount 4,699,784 W
Number of stocks
purchased 114
Indication price Range Buying / Selling Buying / Selling [Stocks]
High price 86,213 W 86,213 W~ ~ 74,987 W 110 % -5,146,739 W All selling
2022-04-12
3 months
Current stock price Evaluation
Stock price rise
probability score
Investment opinion Prospective purchase amount
41,150 W Low price 43.8 Normal 10,000,000 W
38.8 36.0 52.7 36.7 41.3 36.3
2021.11.12 2021.12.10 2022.01.10 2022.02.10 2022.03.14 2022.04.11
Stock price rise
probability score
A Sector 43.5 41.6 47.0 44.2 46.8 45.6
43.8
B Sector 34.2 30.4 58.3 44.2 35.8 27.1
Total average
2022.01.10 2022.02.10 2022.03.14 2022.04.11
Total of
increase rate
Total score
A Sector -5 % 12 % -6 % 6 % -3 %
-4 % 43.0
B Sector -12 % 48 % -32 % -23 % -32 %
Total average -8 % 32 % -44 % 11 % -14 %
2021.12.10
44 42
47 44 47 46
34
30
58
44
36
27
39 36
53
37
41
36
0
10
20
30
40
50
60
70
2021.11.12 2021.12.10 2022.01.10 2022.02.10 2022.03.14 2022.04.11
Stock price rise probability score
A sector
B sector
Total average
-5%
12%
-6%
6%
-3%
-12%
48%
-32%
-23%
-32%
-8%
32%
-44%
11%
-14%
-60%
-40%
-20%
0%
20%
40%
60%
2021.12.10 2022.01.10 2022.02.10 2022.03.14 2022.04.11
Increase rate of stock price rise
A sector
B sector
Total average
kepco kps](data:image/gif;base64,R0lGODlhAQABAIAAAAAAAP///yH5BAEAAAAALAAAAAABAAEAAAIBRAA7)
Recommended
Recommended
More Related Content
What's hot
What's hot (20)
Similar to kepco kps 051600 Algorithm Investment Report
Similar to kepco kps 051600 Algorithm Investment Report (20)
More from 알고리즘 기업분석 컨설팅-알기컨,algikeon
More from 알고리즘 기업분석 컨설팅-알기컨,algikeon (20)
Recently uploaded
Recently uploaded (20)
kepco kps 051600 Algorithm Investment Report
- 1. Performance Analysis of Algorithm (consolidated) 051600 Date Period 3 months 100-m won 2018.12 2019.12 2020.12 Average 2021.03 2021.06 2021.09 2021.12 2022.03 2022.06 IFRS(Con) IFRS(Con) IFRS(Con) IFRS(Con) IFRS(Con) IFRS(Con) IFRS(Con) IFRS(Con) IFRS(Con) IFRS(Con) IFRS(Con) Sales 12,425 12,470 13,032 12,642 3,216 3,680 3,114 3,795 3,357 3,870 3,451 O-profit 1,915 1,939 1,354 1,736 564 361 306 9 385 440 310 N-income 1,613 1,533 871 1,339 441 321 264 -38 323 285 247 O-rate 15.4 15.5 10.4 13.8 17.5 9.8 9.8 0.2 11.5 11.4 9.4 N-rate 13.0 12.3 6.7 10.7 13.7 8.7 8.5 -1.0 9.6 7.4 7.5 ROE 16.4 14.4 8.3 13.0 16.8 14.3 13.5 10.8 13.4 13.1 13.9 Debt-ratio 30.2 27.8 28.4 28.8 32.1 28.3 26.6 28.3 27.2 26.2 28.8 Quick-ratio 232.0 308.9 280.6 273.8 253.1 299.4 310.6 282.6 297.2 314.2 286.4 reserve-ratio 10,846.7 11,723.3 11,593.3 11,387.8 11,585.6 11,901.1 12,284.4 12,262.2 12,497.8 12,737.9 12,008.3 EPS 3,584 3,407 1,936 2,976 980 713 587 -84 612 745 549 BPS 21,869 23,631 23,371 22,957 23,358 23,989 24,753 24,711 25,182 25,662 24,203 Dividends 1,790 1,920 1,146 1,619 Major Financial Information Recent Annual Performance Recent quarterly performance Estimate Average 2022-04-12 Gap (Indication / stock) Color High price ~ 110 % High mid ~ 82 % Mid ~ 55 % Low mid ~ 28 % Low price ~ 0 % Normal 41,308 W 41,308 W 0 W Industrial name of the company The number of All industries Algorithm Industry ranking Total number of listed companies Algorithm company ranking Investment opinion Electric utility 79 11 3,392 170 74,987 W 74,987 W 63,761 W 63,761 W 63,761 W 52,535 W Evaluation 86,213 W 86,213 W~ 74,987 W 41,150 W 56.4 52,535 W 52,535 W 41,308 W Low price Indication price Range Current stock price Company score 41,308원 52,535원 63,761원 74,987원 86,213원 Low price 41,150원 .4% 27.7% 54.9% 82.2% 109.5% 0.% 20.% 40.% 60.% 80.% 100.% 120.% 0W 10,000W 20,000W 30,000W 40,000W 50,000W 60,000W 70,000W 80,000W 90,000W 100,000W Low price Low mid Mid High mid High price Indication price chart (Consolidated) Indication price kepco kps Gap kepco kps
- 2. [Price for scheduled purchasing] Arbitrarily made Algorithm stocks Trading Strategies (consolidated) 051600 Date Period Gap (Indication / stock) Color low price 41,308 W 41,308 W ~ 0 W 0 % -18,093 W -0 Low mid 52,535 W 52,535 W ~ 41,308 W 28 % -1,300,254 W -25 Mid 63,761 W 63,761 W ~ 52,535 W 55 % -2,582,416 W -41 High mid 74,987 W 74,987 W ~ 63,761 W 82 % -3,864,578 W -52 Suggested Purchase Amount 4,699,784 W Number of stocks purchased 114 Indication price Range Buying / Selling Buying / Selling [Stocks] High price 86,213 W 86,213 W~ ~ 74,987 W 110 % -5,146,739 W All selling 2022-04-12 3 months Current stock price Evaluation Stock price rise probability score Investment opinion Prospective purchase amount 41,150 W Low price 43.8 Normal 10,000,000 W 38.8 36.0 52.7 36.7 41.3 36.3 2021.11.12 2021.12.10 2022.01.10 2022.02.10 2022.03.14 2022.04.11 Stock price rise probability score A Sector 43.5 41.6 47.0 44.2 46.8 45.6 43.8 B Sector 34.2 30.4 58.3 44.2 35.8 27.1 Total average 2022.01.10 2022.02.10 2022.03.14 2022.04.11 Total of increase rate Total score A Sector -5 % 12 % -6 % 6 % -3 % -4 % 43.0 B Sector -12 % 48 % -32 % -23 % -32 % Total average -8 % 32 % -44 % 11 % -14 % 2021.12.10 44 42 47 44 47 46 34 30 58 44 36 27 39 36 53 37 41 36 0 10 20 30 40 50 60 70 2021.11.12 2021.12.10 2022.01.10 2022.02.10 2022.03.14 2022.04.11 Stock price rise probability score A sector B sector Total average -5% 12% -6% 6% -3% -12% 48% -32% -23% -32% -8% 32% -44% 11% -14% -60% -40% -20% 0% 20% 40% 60% 2021.12.10 2022.01.10 2022.02.10 2022.03.14 2022.04.11 Increase rate of stock price rise A sector B sector Total average kepco kps
- 3. 정보와 완전 정보 결 투자판단 있습니 위배 무단으 숙지하 Compliance notice ① The information provided by The Algorithm Company Analysis Consulting is obtained through reliable data and information and The Algorithm Company Analysis Program (TACAP), but its accuracy or completeness are not guaranteed. Furthermore, it may change over time.Therefore, we are not legally responsible for the results of the data provided by The Algorithm Company Analysis Consulting because of information errors or omissions. ② The Algorithm Company Analysis Consulting and all the information provided on it site are reference materials for investment decisions and the final responsibility of investment is up to users utilizing this information. ③ The Algorithm Company Analysis Consulting and its site do not do anything that violates the related laws such as discretionary transaction. ④ Users can not reallocate and recycle the information provided by The Algorithm Company Analysis Consulting firm let alone the information provided by its Site. ⑤ Be sure to know about application period of this algorithm analysis report in order to improve its accuracy. Tel : 070 - 4667 - 5009 Email : tacac@tacac.co.kr Homepage : tacac.co.kr Blog : tacac.blog.me SERVICES M&A, IPO, RECOVER, CORPORATE RESTRUCTURING, MANAGEMENT OF TECHNOLOGY, BUSINESS STRATEGY, FAMILY BUSINESS Request : http://tacac.co.kr/?page_id=1374 ① Consulting is o The Algorithm accuracy or com change over tim results of the d Consulting bec ② information pr investment dec up ③ do anything th transaction. ④ The Algorithm information pr ⑤ analysis report