gs 078930 Algorithm Investment Report
•
0 likes•69 views

gs 078930 Algorithm Investment Report
![[Price for scheduled purchasing]
Arbitrarily made
Algorithm stocks Trading Strategies (consolidated) 078930 Date
Period
Gap
(Indication /
stock)
Color
2021-02-25
3 months
Current stock price Evaluation
Stock price rise
probability score
Investment opinion Prospective purchase amount
40,150 W Low price 48.6 Normal 10,000,000 W
Suggested Purchase
Amount 4,325,460 W
Number of stocks
purchased 108
Indication price Range Buying / Selling Buying / Selling [Stocks]
High price 91,532 W 91,532 W~ ~ 83,719 W 128 % -5,535,471 W All selling
High mid 83,719 W 83,719 W ~ 75,907 W 109 % -4,693,811 W All selling
Mid 75,907 W 75,907 W ~ 68,094 W 89 % -3,852,151 W -51
Low mid 68,094 W 68,094 W ~ 60,282 W 70 % -3,010,491 W -44
low price 60,282 W 60,282 W ~ 0 W 50 % -2,168,831 W -36
Stock price rise
probability score
A Sector 45.8 52.1 47.4 44.0 51.2 45.9
48.6
B Sector 44.2 37.9 29.6 44.0 22.9 28.3
Total average
2020.09.24 2020.10.28 2020.11.25 2020.12.23 2021.01.25 2021.02.24
45.0 45.0 38.5 25.4 37.1 37.1
31 % 0 %
2020.10.28 2020.11.25 2020.12.23 2021.01.25 2021.02.24
Total of
increase rate
Total score
A Sector 12 % -10 % -8 % 14 % -12 %
-7 % 43.3
B Sector -16 % -28 % 33 % -92 % 19 %
Total average 0 % -17 % -51 %
46
52
47
44
51
46
44
38
30
44
23
28
45 45
38
25
37 37
0
10
20
30
40
50
60
2020.09.24 2020.10.28 2020.11.25 2020.12.23 2021.01.25 2021.02.24
Stock price rise probability score
A sector
B sector
Total average
12%
-10% -8%
14%
-12%
-16%
-28%
33%
-92%
19%
0%
-17%
-51%
31%
0%
-100%
-80%
-60%
-40%
-20%
0%
20%
40%
2020.10.28 2020.11.25 2020.12.23 2021.01.25 2021.02.24
Increase rate of stock price rise
A sector
B sector
Total average
gs](data:image/gif;base64,R0lGODlhAQABAIAAAAAAAP///yH5BAEAAAAALAAAAAABAAEAAAIBRAA7)
Recommended
Recommended
More Related Content
What's hot
What's hot (20)
Similar to gs 078930 Algorithm Investment Report
Similar to gs 078930 Algorithm Investment Report (20)
More from 알고리즘 기업분석 컨설팅-알기컨,algikeon
More from 알고리즘 기업분석 컨설팅-알기컨,algikeon (20)
Recently uploaded
Recently uploaded (20)
gs 078930 Algorithm Investment Report
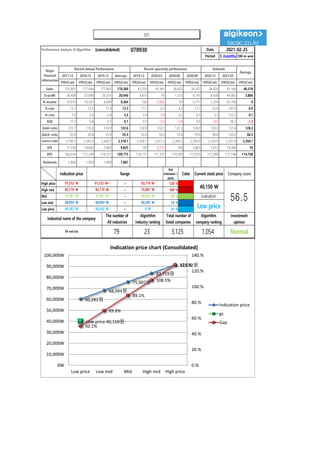
- 1. Performance Analysis of Algorithm (consolidated) 078930 Date Period 3 months 100-m won 2017.12 2018.12 2019.12 Average 2019.12 2020.03 2020.06 2020.09 2020.12 2021.03 IFRS(Con) IFRS(Con) IFRS(Con) IFRS(Con) IFRS(Con) IFRS(Con) IFRS(Con) IFRS(Con) IFRS(Con) IFRS(Con) IFRS(Con) Sales 155,801 177,444 177,861 170,369 43,359 41,961 36,655 39,297 36,856 41,164 40,318 O-profit 20,408 22,098 20,331 20,946 4,815 95 1,573 4,741 8,430 44,063 2,806 N-income 10,919 10,305 6,689 9,304 183 -2,952 95 2,711 1,224 62,790 9 O-rate 13.1 12.5 11.4 12.3 11.1 0.2 4.3 12.1 22.9 107.0 6.9 N-rate 7.0 5.8 3.8 5.5 0.4 -7.0 0.3 6.9 3.3 152.5 0.1 ROE 11.3 9.8 6.1 9.1 0.7 -5.3 -1.4 0.9 -0.1 36.7 -1.3 Debt-ratio 127.7 115.0 124.9 122.6 124.9 132.1 127.3 128.9 130.3 131.6 128.3 Quick-ratio 52.6 59.8 53.9 55.4 53.9 59.0 73.0 79.6 96.6 120.2 66.3 reserve-ratio 2,190.7 2,342.9 2,420.7 2,318.1 2,420.7 2,311.2 2,309.5 2,359.0 2,339.9 2,321.0 2,350.1 EPS 11,530 10,882 7,063 9,825 193 -3,117 100 2,863 1,613 14,384 10 BPS 102,034 111,140 116,151 109,775 116,151 111,337 114,509 117,035 117,390 117,746 114,758 Dividends 1,800 1,900 1,900 1,867 2021-02-25 Major Financial Information Recent Annual Performance Recent quarterly performance Estimate Average Gap (Indication / stock) Color High price ~ 128 % High mid ~ 109 % Mid ~ 89 % Low mid ~ 70 % Low price ~ 50 % Indication price Range Current stock price Company score 83,719 W 83,719 W 75,907 W 75,907 W 75,907 W 68,094 W Evaluation 91,532 W 91,532 W~ 83,719 W 40,150 W 56.5 68,094 W 68,094 W 60,282 W Low price Normal 60,282 W 60,282 W 0 W Industrial name of the company The number of All industries Algorithm Industry ranking Total number of listed companies Algorithm company ranking Investment opinion Oil and Gas 79 23 3,125 1,054 60,282원 68,094원 75,907원 83,719원 91,532원 Low price 40,150원 50.1% 69.6% 89.1% 108.5% 128.% 0.% 20.% 40.% 60.% 80.% 100.% 120.% 140.% 0W 10,000W 20,000W 30,000W 40,000W 50,000W 60,000W 70,000W 80,000W 90,000W 100,000W Low price Low mid Mid High mid High price Indication price chart (Consolidated) Indication price gs Gap gs
- 2. [Price for scheduled purchasing] Arbitrarily made Algorithm stocks Trading Strategies (consolidated) 078930 Date Period Gap (Indication / stock) Color 2021-02-25 3 months Current stock price Evaluation Stock price rise probability score Investment opinion Prospective purchase amount 40,150 W Low price 48.6 Normal 10,000,000 W Suggested Purchase Amount 4,325,460 W Number of stocks purchased 108 Indication price Range Buying / Selling Buying / Selling [Stocks] High price 91,532 W 91,532 W~ ~ 83,719 W 128 % -5,535,471 W All selling High mid 83,719 W 83,719 W ~ 75,907 W 109 % -4,693,811 W All selling Mid 75,907 W 75,907 W ~ 68,094 W 89 % -3,852,151 W -51 Low mid 68,094 W 68,094 W ~ 60,282 W 70 % -3,010,491 W -44 low price 60,282 W 60,282 W ~ 0 W 50 % -2,168,831 W -36 Stock price rise probability score A Sector 45.8 52.1 47.4 44.0 51.2 45.9 48.6 B Sector 44.2 37.9 29.6 44.0 22.9 28.3 Total average 2020.09.24 2020.10.28 2020.11.25 2020.12.23 2021.01.25 2021.02.24 45.0 45.0 38.5 25.4 37.1 37.1 31 % 0 % 2020.10.28 2020.11.25 2020.12.23 2021.01.25 2021.02.24 Total of increase rate Total score A Sector 12 % -10 % -8 % 14 % -12 % -7 % 43.3 B Sector -16 % -28 % 33 % -92 % 19 % Total average 0 % -17 % -51 % 46 52 47 44 51 46 44 38 30 44 23 28 45 45 38 25 37 37 0 10 20 30 40 50 60 2020.09.24 2020.10.28 2020.11.25 2020.12.23 2021.01.25 2021.02.24 Stock price rise probability score A sector B sector Total average 12% -10% -8% 14% -12% -16% -28% 33% -92% 19% 0% -17% -51% 31% 0% -100% -80% -60% -40% -20% 0% 20% 40% 2020.10.28 2020.11.25 2020.12.23 2021.01.25 2021.02.24 Increase rate of stock price rise A sector B sector Total average gs
- 3. 정보와 완전 정보 결 투자판단 있습니 위배 무단으 숙지하 Compliance notice ① The information provided by The Algorithm Company Analysis Consulting is obtained through reliable data and information and The Algorithm Company Analysis Program (TACAP), but its accuracy or completeness are not guaranteed. Furthermore, it may change over time.Therefore, we are not legally responsible for the results of the data provided by The Algorithm Company Analysis Consulting because of information errors or omissions. ② The Algorithm Company Analysis Consulting and all the information provided on it site are reference materials for investment decisions and the final responsibility of investment is up to users utilizing this information. ③ The Algorithm Company Analysis Consulting and its site do not do anything that violates the related laws such as discretionary transaction. ④ Users can not reallocate and recycle the information provided by The Algorithm Company Analysis Consulting firm let alone the information provided by its Site. ⑤ Be sure to know about application period of this algorithm analysis report in order to improve its accuracy. Tel : 070 - 4667 - 5009 Email : tacac@tacac.co.kr Homepage : tacac.co.kr Blog : tacac.blog.me SERVICES M&A, IPO, RECOVER, CORPORATE RESTRUCTURING, MANAGEMENT OF TECHNOLOGY, BUSINESS STRATEGY, FAMILY BUSINESS Request : http://tacac.co.kr/?page_id=1374 ① Consulting is o The Algorithm accuracy or com change over tim results of the d Consulting bec ② information pr investment dec up ③ do anything th transaction. ④ The Algorithm information pr ⑤ analysis report