2018 GIS in Recreation: The Making of a Trail
•
1 like•62 views

As a part of a joint effort between the Town of Silverthorne and the Summit Sky Ranch development, Allpoints GIS and Contour Logic were contracted to provide trail planning services on private and National Forest lands. Several variables presented challenges that required detailed planning work. Lidar data analysis, 3D web scenes, survey data, high resolution web maps, and ArcGIS Collector in the field were all employed in a joint desktop and field GIS effort to create trail plans. I will detail our GIS methods and products from this project from start to finish.

Recommended
Recommended
More Related Content
What's hot
What's hot (20)
Similar to 2018 GIS in Recreation: The Making of a Trail
Similar to 2018 GIS in Recreation: The Making of a Trail (20)
More from GIS in the Rockies
More from GIS in the Rockies (20)
Recently uploaded
Recently uploaded (20)
2018 GIS in Recreation: The Making of a Trail
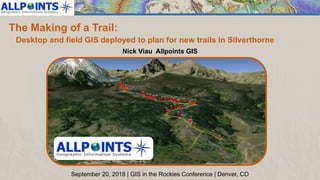
- 1. The Making of a Trail: Desktop and field GIS deployed to plan for new trails in Silverthorne September 20, 2018 | GIS in the Rockies Conference | Denver, CO Nick Viau Allpoints GIS
- 3. Quick Intro Nick Viau | GIS Specialist & Instructor | Allpoints GIS
- 4. The Setup ✓ New housing development being built in Silverthorne ✓ Summit Sky Ranch / Maryland Creek Ranch
- 5. The Setup ✓ Development agreement with town calls for developer to build new, public use trails and park
- 6. The Setup ✓ Members of the Silverthorne Parks, Open Space, Rec, and Trails Committee contacted me and asked for some mapping help ✓ Special thanks to John Taylor, longtime advocate of outdoor recreation enhancement in Silverthorne. Without his passion and tireless commitment, this would never have happened
- 7. Reconnaissance ✓ First task: Exploratory / recon hike along proposed MC trail corridor ✓ August, 22, 2017 ✓ I took pictures with my phone along the hike (and made sure the geo-tag setting was turned on!)
- 8. Reconnaissance ✓ Geo-tagged photos to points tool in ArcToolbox brings the photos into GIS. ✓ Data Management Tools >> Photos ✓ Output is point FC in a GDB with photos as feature class attachments
- 9. Reconnaissance ✓ Using ArcGIS Pro, I published the photo points to AGOL as a 3D web scene ✓ Shared the scene so project collaborators could view online
- 11. Lessons from Reconnaissance ✓ The bark beetle outbreak has affected this area significantly ✓ Large amount of blown-down beetle kill trees presents a serious challenge to trail construction
- 12. Mapping the Blowdown ✓ Need detailed data that shows the downed trees ✓ Luckily, lidar was collected for Summit county in 2016 by the CWCB & CGS ✓ But, how to use the Lidar to find the blowdown? ✓ First I tried creating the two most common elevation surfaces, a DEM from the lidar ground returns, and a DSM from the first returns
- 14. Mapping the Blowdown ✓ Neither is too useful for this purpose ✓ DEM shows the ground surface below the downed trees ✓ DSM shows canopy top above downed trees ✓ Need to look at the space in the middle ✓ Time to start experimenting with the lidar!
- 15. Mapping the Blowdown ✓ I started experimenting with different combinations of filters on the lidar ✓ What worked : Filtering out first and second returns, leaving returns 3-10 in the data, shows the “middle space” pretty well
- 18. Mapping the Blowdown ✓ It’s not that big of an area, so I visually digitized the heavy blow- down areas by hand off of my hybrid DEM/DSM.
- 19. Mapping the Blowdown ✓ This initial map was used to draw a rough proposed corridor for the trail.
- 20. Mapping the Site ✓ The lower loop trail winds through the neighborhood ✓ Proximity of trail to home lots and wetlands was a concern ✓ Needed to map subdivision lot lines
- 21. Mapping the Site ✓ Surveyors provided the data for the lot lines, but with an unknown coordinate system ✓ Could not get info on the coordinate system ✓ Solution: Georeference lot lines using corner points in the GCDB and surrounding parcels from Summit Co assessor’s data.
- 22. In the Field ✓ Now it’s time for some field work ✓ Trail planning experts from Contour Logic are using Trimble GNSS units linked to ArcGIS Collector on tablets in the field ✓ Problem: There is currently very little to no cell service on the Summit Sky Ranch property
- 23. In the Field ✓ Solution: Sync-enabled feature services hosted in AGOL and deployed in an offline web map in Arc Collector on mobile devices ✓ A bit of trouble getting raster (tiled) services to download for offline use in Collector on mobile device ✓ Otherwise, smooth sailing
- 24. In the Field
- 25. In the Field
- 26. Ongoing Work ✓ Contour Logic field crews have been out surveying the route of the lower loop trail this summer using Arc Collector
- 27. Ongoing Work ✓ Construction has begun on parts of the loop trail as well as the park ✓ Initial field work for the Maryland Creek trail has begun
- 28. Fun Fact! ✓ The car crash scene from National Lampoon’s Christmas Vacation was filmed on the Maryland Creek property in 1989
- 29. Thank You for attending! Nick Viau – Allpoints GIS | nick@allpointsgis.com