More Related Content
Similar to Rockwall TX - Housing Market Report - November 2010
Similar to Rockwall TX - Housing Market Report - November 2010 (13)
More from Valarie Littles
More from Valarie Littles (17)
Rockwall TX - Housing Market Report - November 2010
- 1. Valarie Littles Ultima Real Estate
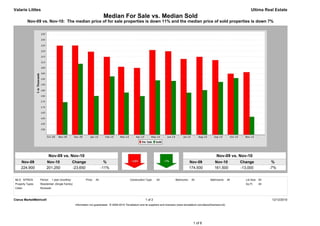
Median For Sale vs. Median Sold
Nov-09 vs. Nov-10: The median price of for sale properties is down 11% and the median price of sold properties is down 7%
Nov-09 vs. Nov-10 Nov-09 vs. Nov-10
Nov-09 Nov-10 Change % Nov-09 Nov-10 Change %
224,900 201,250 -23,650 -11% 174,500 161,500 -13,000 -7%
MLS: NTREIS Period: 1 year (monthly) Price: All Construction Type: All Bedrooms: All Bathrooms: All Lot Size: All
Property Types: Residential: (Single Family) Sq Ft: All
Cities: Rockwall
Clarus MarketMetrics® 1 of 2 12/12/2010
Information not guaranteed. © 2009-2010 Terradatum and its suppliers and licensors (www.terradatum.com/about/licensors.td).
1 of 6
- 2. Valarie Littles Ultima Real Estate
Median For Sale vs. Median Sold
Nov-09 vs. Nov-10: The median price of for sale properties is down 11% and the median price of sold properties is down 7%
For Sale # Properties Sold # Properties Price
Time Period Median For Sale Median Sold Difference
Nov-10 201,250 470 161,500 24 -39,750
Oct-10 199,900 478 196,000 31 -3,900
Sep-10 212,000 487 192,500 50 -19,500
Aug-10 214,900 505 185,250 62 -29,650
Jul-10 213,000 513 183,000 45 -30,000
Jun-10 219,900 496 193,500 78 -26,400
May-10 221,000 479 194,000 75 -27,000
Apr-10 205,000 516 179,900 61 -25,100
Mar-10 206,000 488 183,118 56 -22,883
Feb-10 214,900 438 197,500 33 -17,400
Jan-10 219,500 415 180,000 29 -39,500
Dec-09 225,000 386 208,750 44 -16,250
Nov-09 224,900 398 174,500 53 -50,400
Clarus MarketMetrics® 2 of 2 12/12/2010
Information not guaranteed. © 2009-2010 Terradatum and its suppliers and licensors (www.terradatum.com/about/licensors.td).
2 of 6
- 3. Valarie Littles Ultima Real Estate
Supply & Demand by Month
Nov-09 vs. Nov-10: The number of for sale properties is up 18% and the number of sold properties is down 55%
Nov-09 vs. Nov-10 Nov-09 vs. Nov-10
Nov-09 Nov-10 Change % Nov-09 Nov-10 Change %
398 470 72 +18% 53 24 -29 -55%
MLS: NTREIS Period: 1 year (monthly) Price: All Construction Type: All Bedrooms: All Bathrooms: All Lot Size: All
Property Types: Residential: (Single Family) Sq Ft: All
Cities: Rockwall
Clarus MarketMetrics® 1 of 2 12/12/2010
Information not guaranteed. © 2009-2010 Terradatum and its suppliers and licensors (www.terradatum.com/about/licensors.td).
3 of 6
- 4. Valarie Littles Ultima Real Estate
Supply & Demand by Month
Nov-09 vs. Nov-10: The number of for sale properties is up 18% and the number of sold properties is down 55%
# Properties Average DOM # Properties Average DOM
Time Period For Sale For Sale Sold Sold
Nov-10 470 123 24 63
Oct-10 478 138 31 86
Sep-10 487 152 50 77
Aug-10 505 164 62 74
Jul-10 513 172 45 101
Jun-10 496 179 78 85
May-10 479 184 75 72
Apr-10 516 179 61 86
Mar-10 488 180 56 96
Feb-10 438 188 33 96
Jan-10 415 201 29 92
Dec-09 386 219 44 104
Nov-09 398 220 53 87
Clarus MarketMetrics® 2 of 2 12/12/2010
Information not guaranteed. © 2009-2010 Terradatum and its suppliers and licensors (www.terradatum.com/about/licensors.td).
4 of 6
- 5. Valarie Littles Ultima Real Estate
Months Supply of Inventory
Nov-09 vs. Nov-10: The average months supply of inventory is up 32%
Nov-09 vs. Nov-10
Nov-09 Nov-10 Change %
8.2 10.8 2.7 +32%
MLS: NTREIS Period: 1 year (monthly) Price: All Construction Type: All Bedrooms: All Bathrooms: All Lot Size: All
Property Types: Residential: (Single Family) Sq Ft: All
Cities: Rockwall
Clarus MarketMetrics® 1 of 2 12/12/2010
Information not guaranteed. © 2009-2010 Terradatum and its suppliers and licensors (www.terradatum.com/about/licensors.td).
5 of 6
- 6. Valarie Littles Ultima Real Estate
Months Supply of Inventory
Nov-09 vs. Nov-10: The average months supply of inventory is up 32%
# Units For Sale # UC Units UC Average
Time Period Last Day of Month During Month MSI DOM
Nov-10 379 35 10.8 88
Oct-10 392 37 10.6 74
Sep-10 400 31 12.9 84
Aug-10 390 58 6.7 78
Jul-10 391 69 5.7 82
Jun-10 408 52 7.8 84
May-10 397 45 8.8 79
Apr-10 385 100 3.9 85
Mar-10 388 56 6.9 84
Feb-10 349 54 6.5 84
Jan-10 332 33 10.1 97
Dec-09 313 30 10.4 107
Nov-09 327 40 8.2 115
Clarus MarketMetrics® 2 of 2 12/12/2010
Information not guaranteed. © 2009-2010 Terradatum and its suppliers and licensors (www.terradatum.com/about/licensors.td).
6 of 6