More Related Content
Similar to Addison TX - Housing Market Report - November 2010
Similar to Addison TX - Housing Market Report - November 2010 (14)
More from Valarie Littles
More from Valarie Littles (20)
Addison TX - Housing Market Report - November 2010
- 1. Valarie Littles Ultima Real Estate
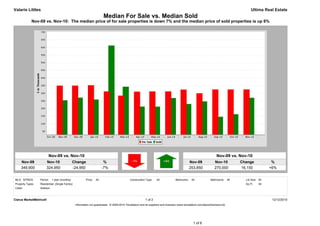
Median For Sale vs. Median Sold
Nov-09 vs. Nov-10: The median price of for sale properties is down 7% and the median price of sold properties is up 6%
Nov-09 vs. Nov-10 Nov-09 vs. Nov-10
Nov-09 Nov-10 Change % Nov-09 Nov-10 Change %
349,900 324,950 -24,950 -7% 253,850 270,000 16,150 +6%
MLS: NTREIS Period: 1 year (monthly) Price: All Construction Type: All Bedrooms: All Bathrooms: All Lot Size: All
Property Types: Residential: (Single Family) Sq Ft: All
Cities: Addison
Clarus MarketMetrics® 1 of 2 12/12/2010
Information not guaranteed. © 2009-2010 Terradatum and its suppliers and licensors (www.terradatum.com/about/licensors.td).
1 of 6
- 2. Valarie Littles Ultima Real Estate
Median For Sale vs. Median Sold
Nov-09 vs. Nov-10: The median price of for sale properties is down 7% and the median price of sold properties is up 6%
For Sale # Properties Sold # Properties Price
Time Period Median For Sale Median Sold Difference
Nov-10 324,950 46 270,000 1 -54,950
Oct-10 324,950 46 162,900 1 -162,050
Sep-10 324,900 43 146,000 1 -178,900
Aug-10 300,000 41 246,750 8 -53,250
Jul-10 324,000 46 229,950 4 -94,050
Jun-10 312,250 51 268,500 4 -43,750
May-10 312,250 45 212,500 6 -99,750
Apr-10 310,625 50 213,000 5 -97,625
Mar-10 285,000 43 342,550 4 57,550
Feb-10 312,250 33 612,500 2 300,250
Jan-10 352,400 24 259,000 3 -93,400
Dec-09 349,900 28 271,100 2 -78,800
Nov-09 349,900 29 253,850 5 -96,050
Clarus MarketMetrics® 2 of 2 12/12/2010
Information not guaranteed. © 2009-2010 Terradatum and its suppliers and licensors (www.terradatum.com/about/licensors.td).
2 of 6
- 3. Valarie Littles Ultima Real Estate
Supply & Demand by Month
Nov-09 vs. Nov-10: The number of for sale properties is up 59% and the number of sold properties is down 80%
Nov-09 vs. Nov-10 Nov-09 vs. Nov-10
Nov-09 Nov-10 Change % Nov-09 Nov-10 Change %
29 46 17 +59% 5 1 -4 -80%
MLS: NTREIS Period: 1 year (monthly) Price: All Construction Type: All Bedrooms: All Bathrooms: All Lot Size: All
Property Types: Residential: (Single Family) Sq Ft: All
Cities: Addison
Clarus MarketMetrics® 1 of 2 12/12/2010
Information not guaranteed. © 2009-2010 Terradatum and its suppliers and licensors (www.terradatum.com/about/licensors.td).
3 of 6
- 4. Valarie Littles Ultima Real Estate
Supply & Demand by Month
Nov-09 vs. Nov-10: The number of for sale properties is up 59% and the number of sold properties is down 80%
# Properties Average DOM # Properties Average DOM
Time Period For Sale For Sale Sold Sold
Nov-10 46 124 1 15
Oct-10 46 132 1 14
Sep-10 43 151 1 2
Aug-10 41 168 8 108
Jul-10 46 164 4 75
Jun-10 51 169 4 27
May-10 45 178 6 40
Apr-10 50 177 5 59
Mar-10 43 178 4 45
Feb-10 33 179 2 62
Jan-10 24 203 3 80
Dec-09 28 214 2 22
Nov-09 29 195 5 36
Clarus MarketMetrics® 2 of 2 12/12/2010
Information not guaranteed. © 2009-2010 Terradatum and its suppliers and licensors (www.terradatum.com/about/licensors.td).
4 of 6
- 5. Valarie Littles Ultima Real Estate
Months Supply of Inventory
Nov-09 vs. Nov-10: The average months supply of inventory is up 125%
Nov-09 vs. Nov-10
Nov-09 Nov-10 Change %
8.7 19.5 10.8 +125%
MLS: NTREIS Period: 1 year (monthly) Price: All Construction Type: All Bedrooms: All Bathrooms: All Lot Size: All
Property Types: Residential: (Single Family) Sq Ft: All
Cities: Addison
Clarus MarketMetrics® 1 of 2 12/12/2010
Information not guaranteed. © 2009-2010 Terradatum and its suppliers and licensors (www.terradatum.com/about/licensors.td).
5 of 6
- 6. Valarie Littles Ultima Real Estate
Months Supply of Inventory
Nov-09 vs. Nov-10: The average months supply of inventory is up 125%
# Units For Sale # UC Units UC Average
Time Period Last Day of Month During Month MSI DOM
Nov-10 39 2 19.5 48
Oct-10 40 1 40.0 15
Sep-10 37 2 18.5 36
Aug-10 32 2 16.0 84
Jul-10 33 5 6.6 92
Jun-10 38 6 6.3 101
May-10 41 3 13.7 12
Apr-10 38 8 4.8 44
Mar-10 36 4 9.0 27
Feb-10 28 3 9.3 19
Jan-10 20 2 10.0 62
Dec-09 17 5 3.4 100
Nov-09 26 3 8.7 24
Clarus MarketMetrics® 2 of 2 12/12/2010
Information not guaranteed. © 2009-2010 Terradatum and its suppliers and licensors (www.terradatum.com/about/licensors.td).
6 of 6