Downloaded 15 times
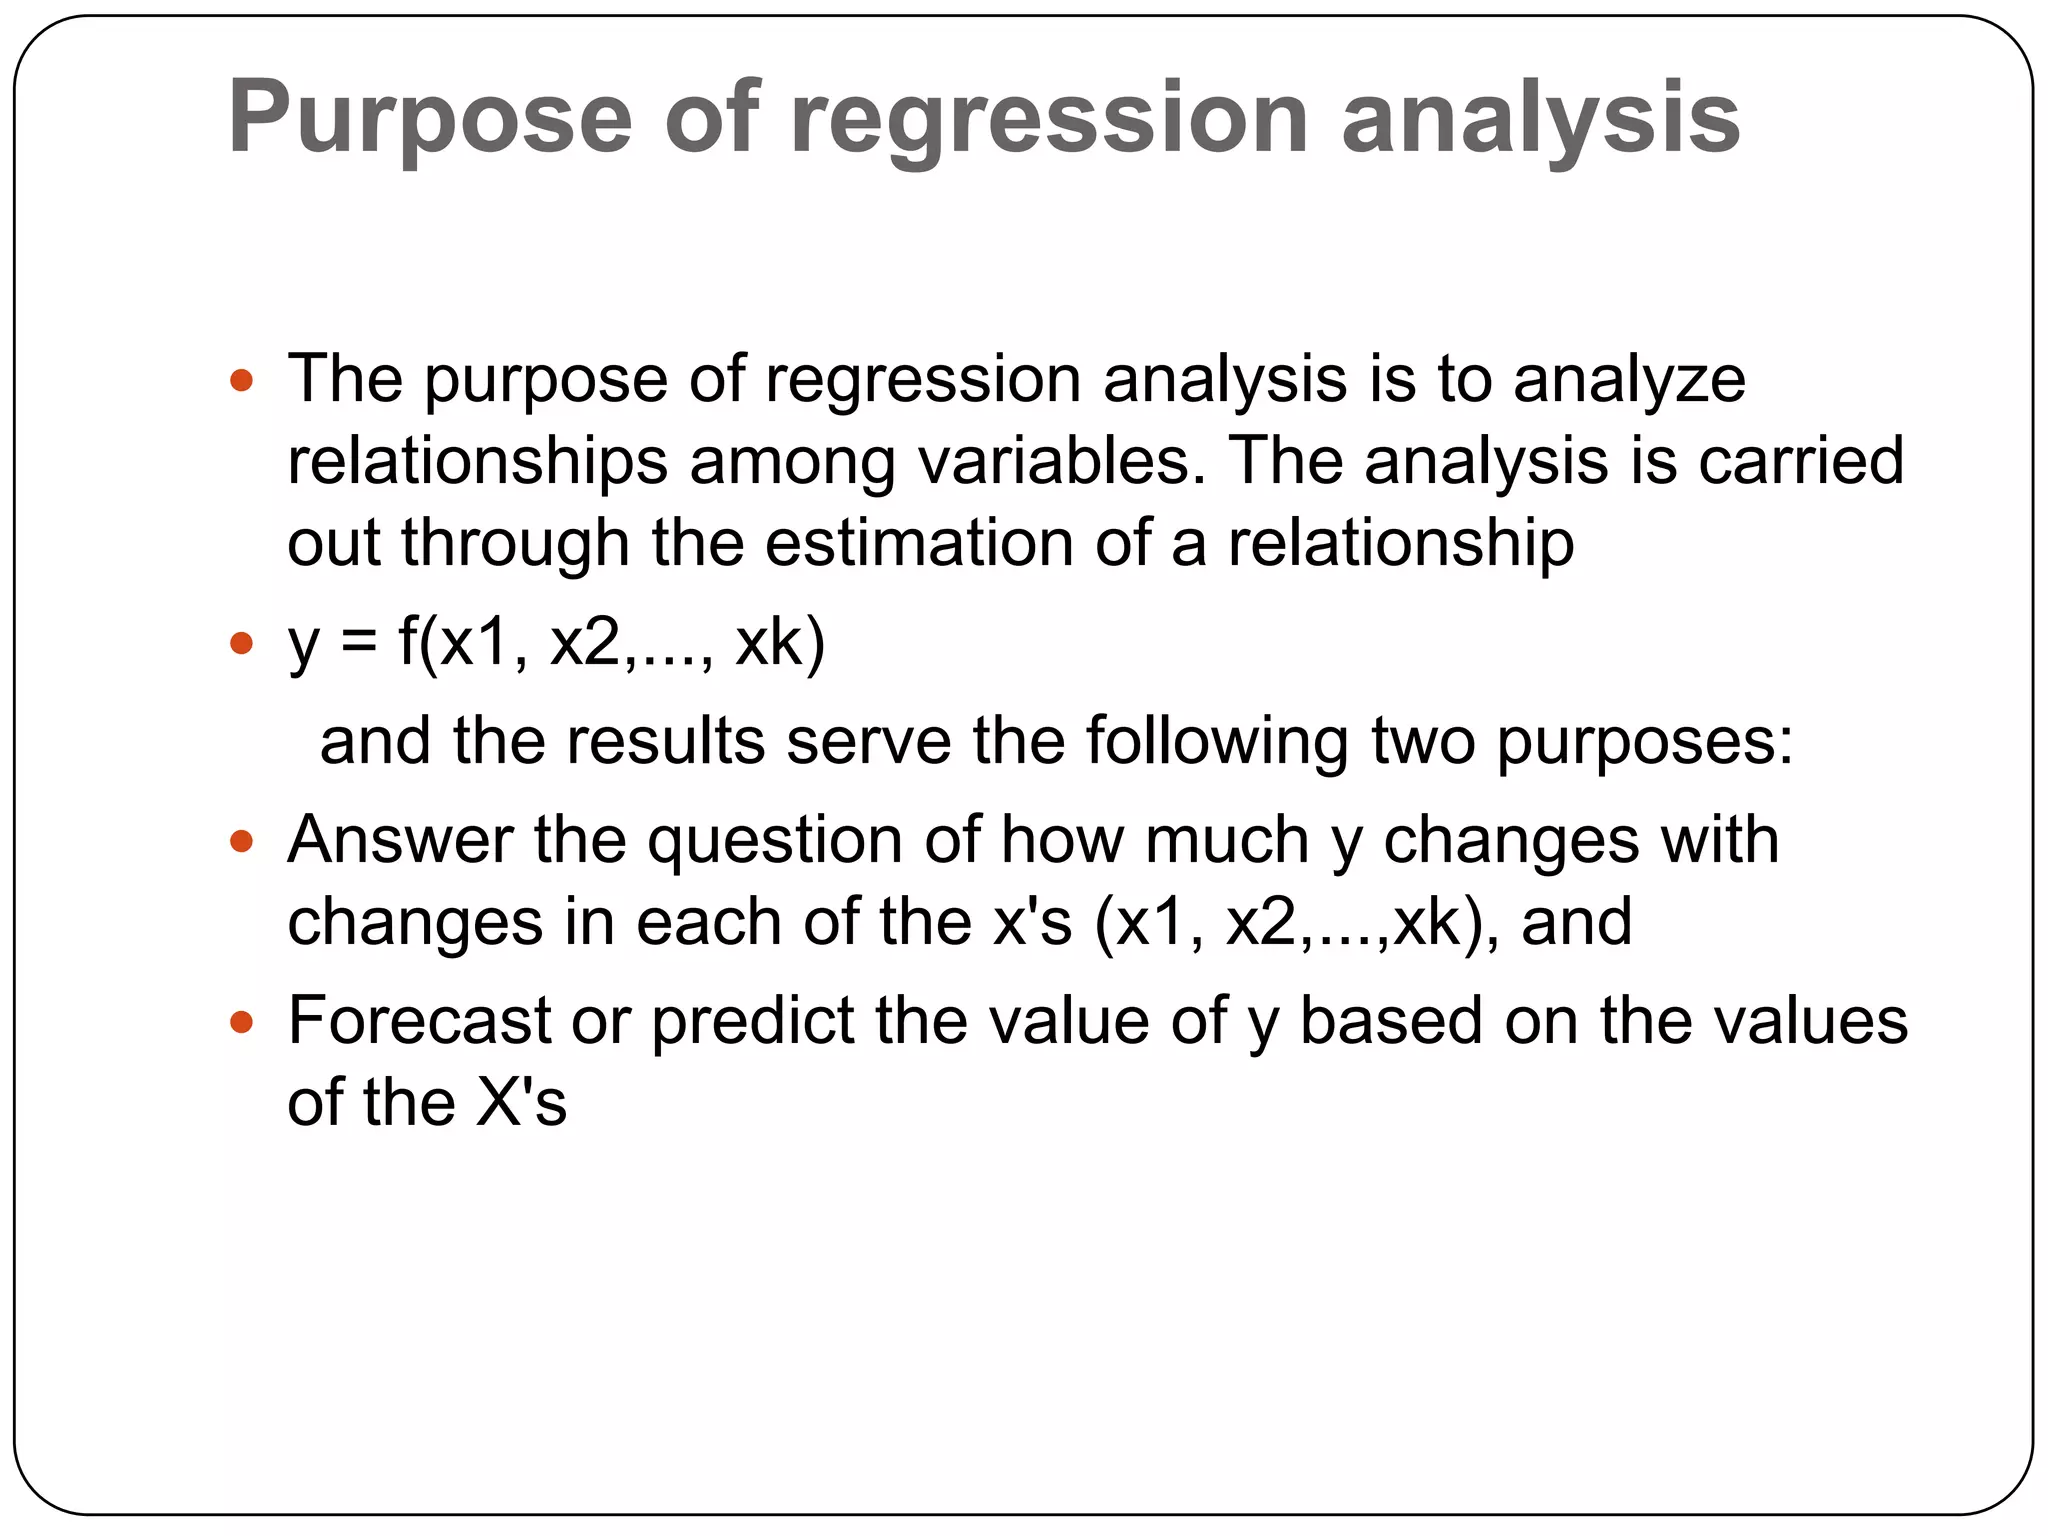

Regression analysis is a statistical technique used to investigate relationships between variables. It allows one to determine the strength of the relationship between a dependent variable (usually denoted by Y) and one or more independent variables (denoted by X). Multiple regression extends this to analyze the relationship between a dependent variable and multiple independent variables. The goals of regression analysis are to understand how the dependent variable changes with the independent variables and to use the independent variables to predict the value of the dependent variable. It requires the dependent variable to be continuous and the independent variables can be either continuous or categorical.
Saba Khan presents the topic of regression analysis.
Regression measures relationships between dependent (Y) and independent variables.
Regression is used in Engineering, Sciences, Economics, Management, and Social Sciences.
Used to investigate variable relationships, predict outcomes, and assess causal effects.
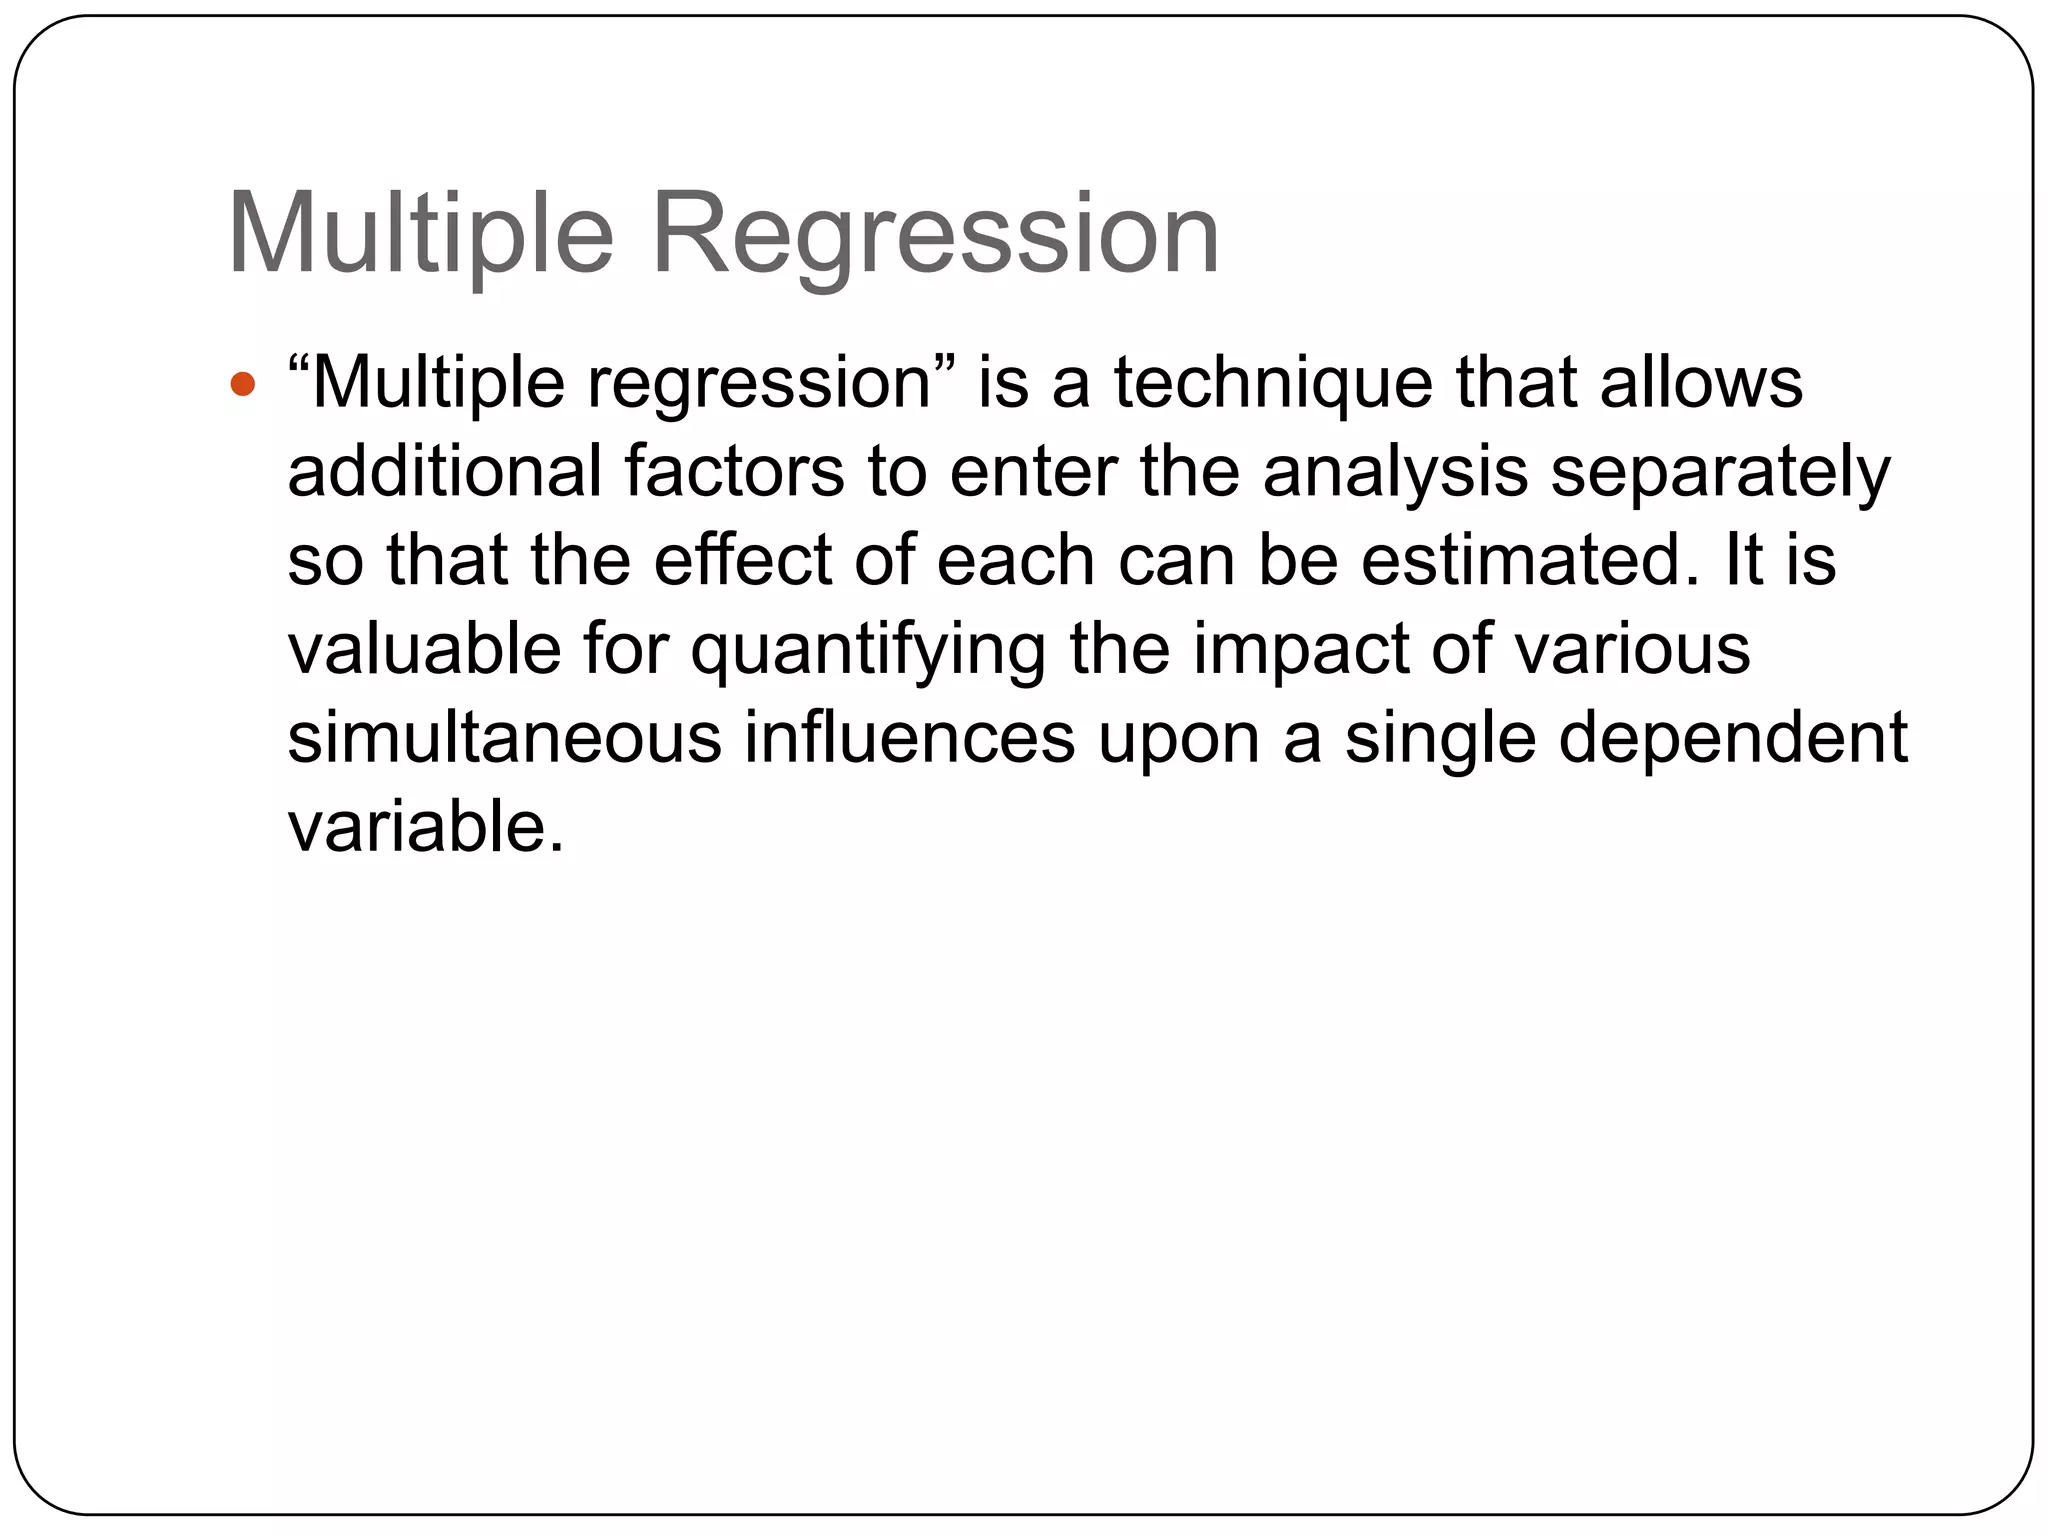
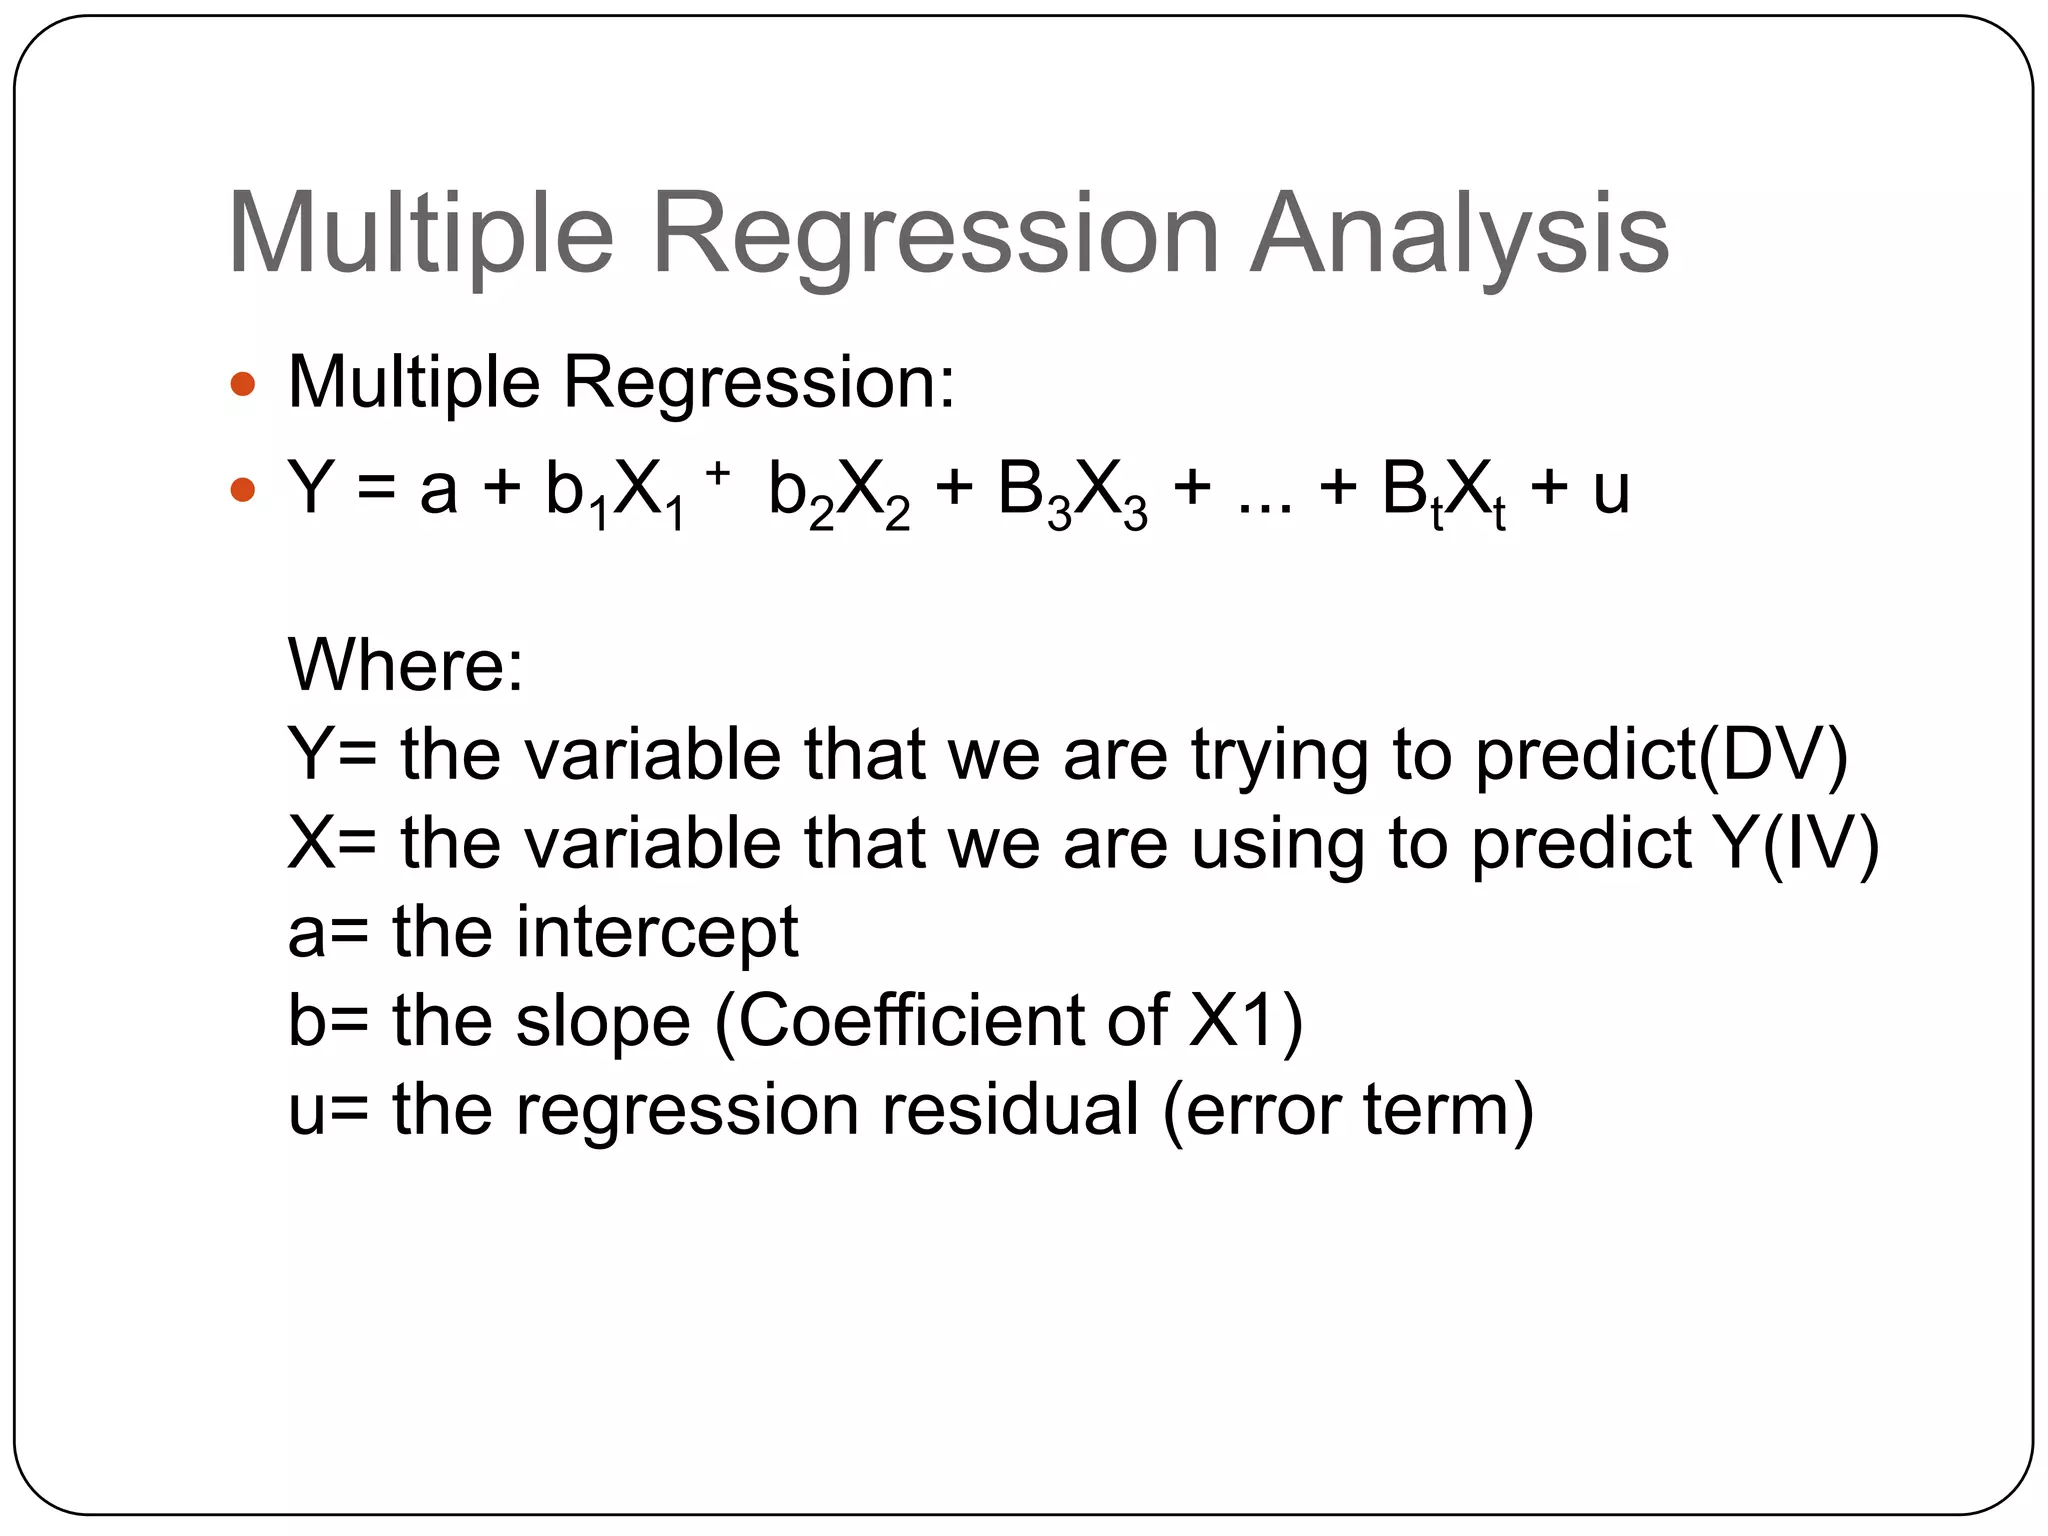
Multiple regression analyzes several independent variables affecting one dependent variable.
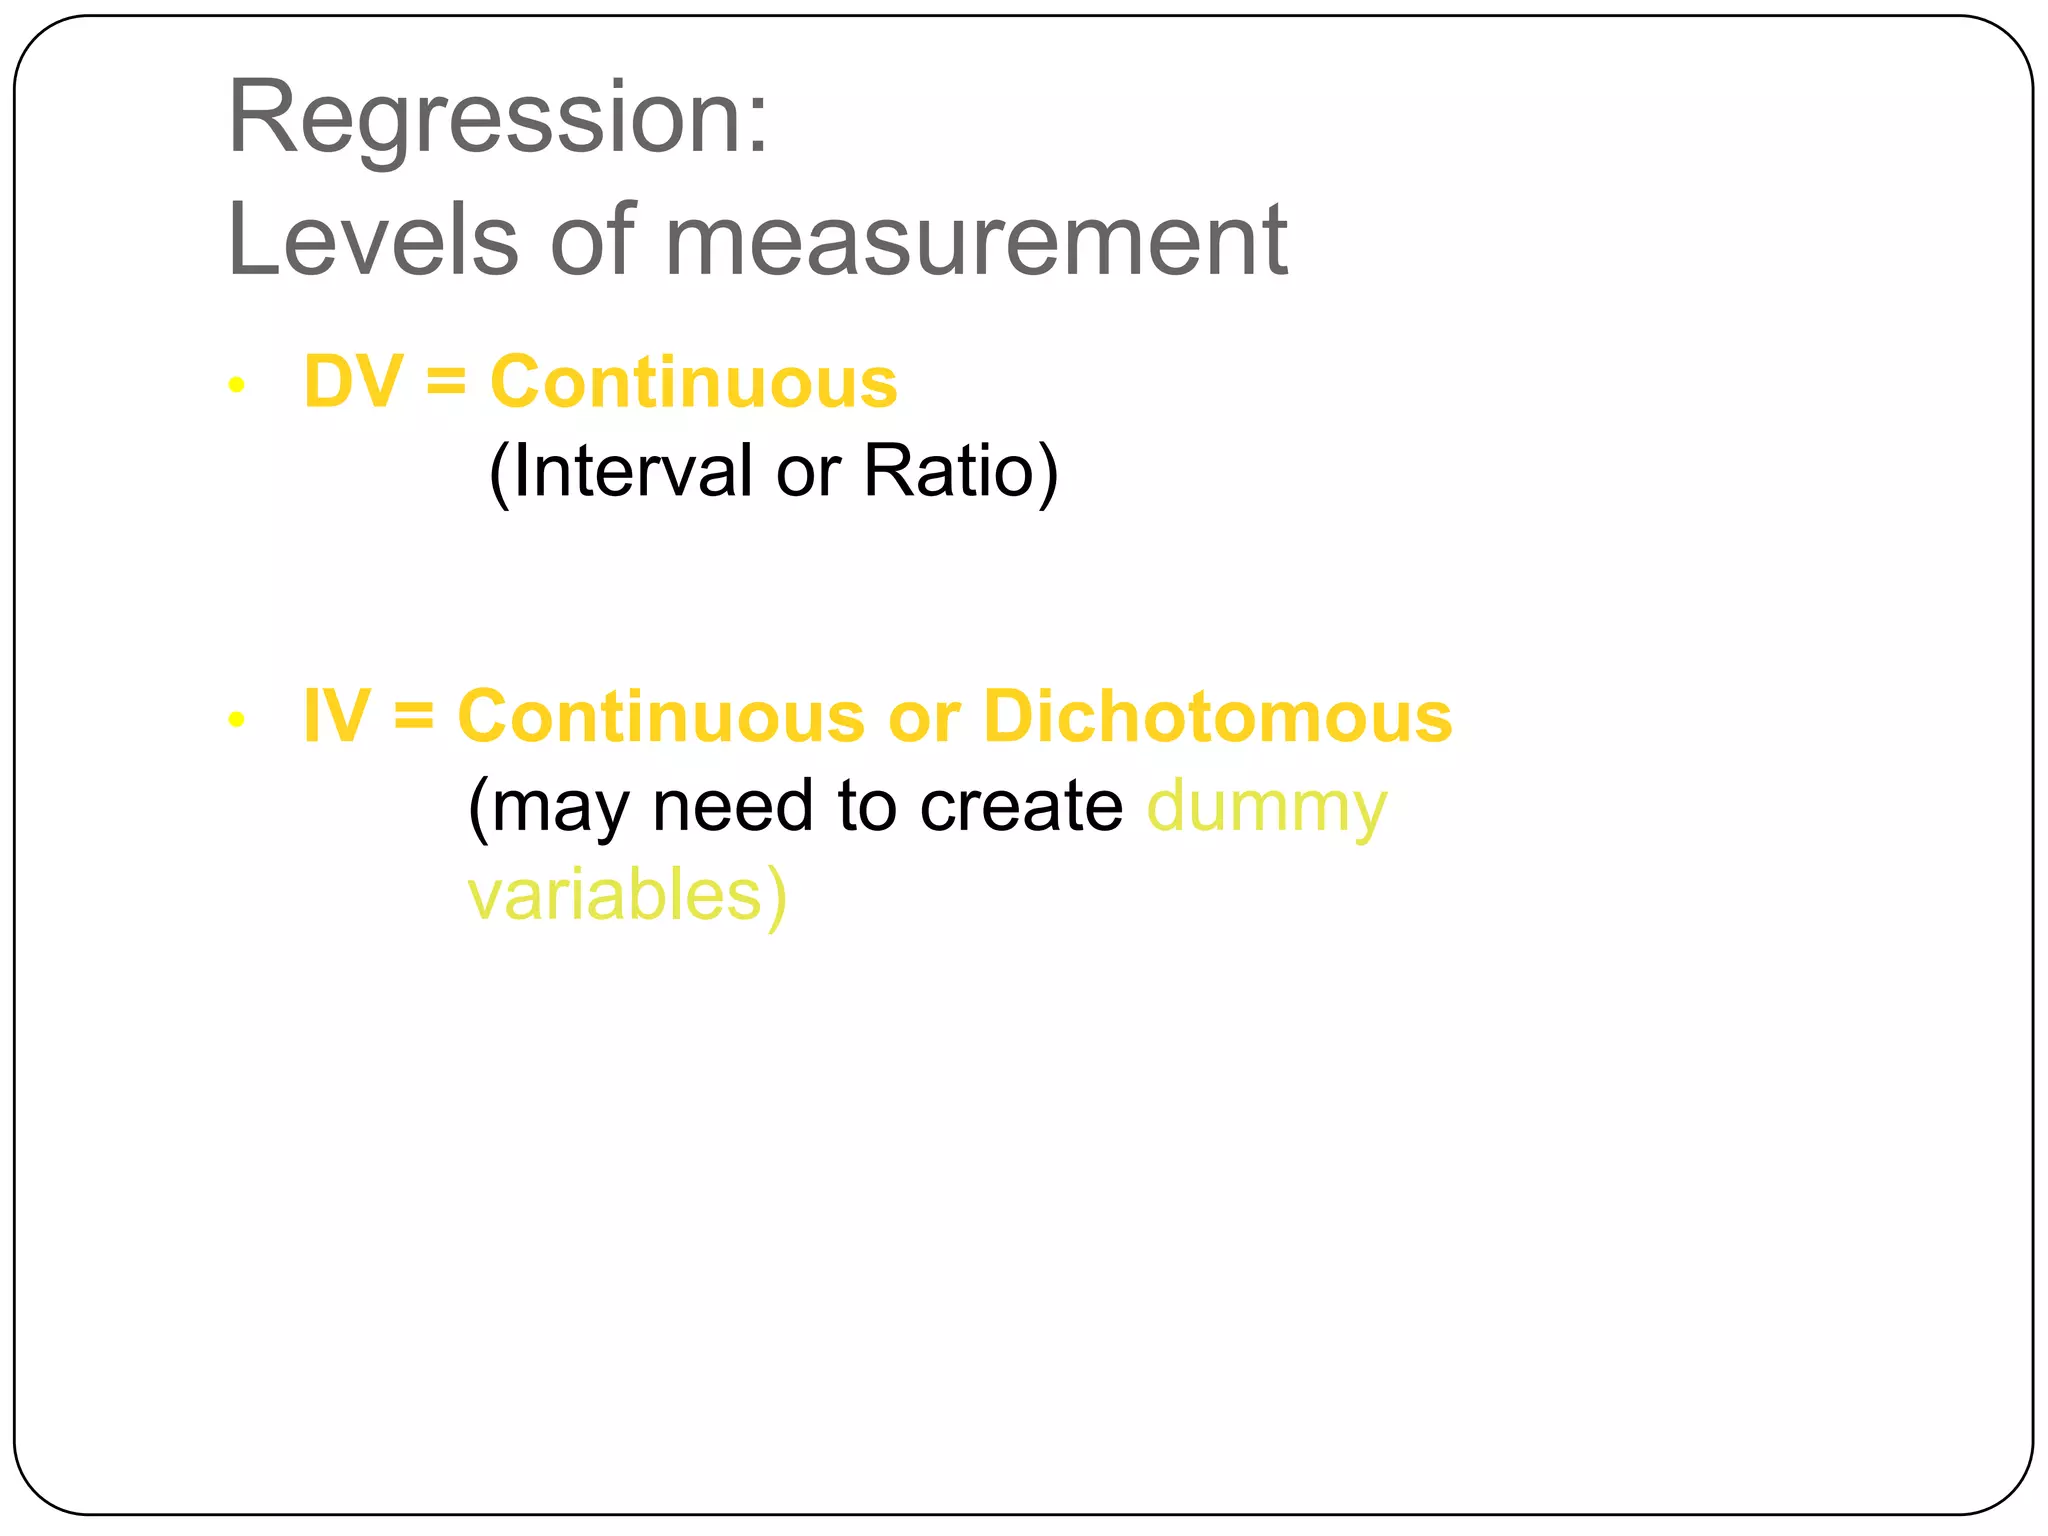
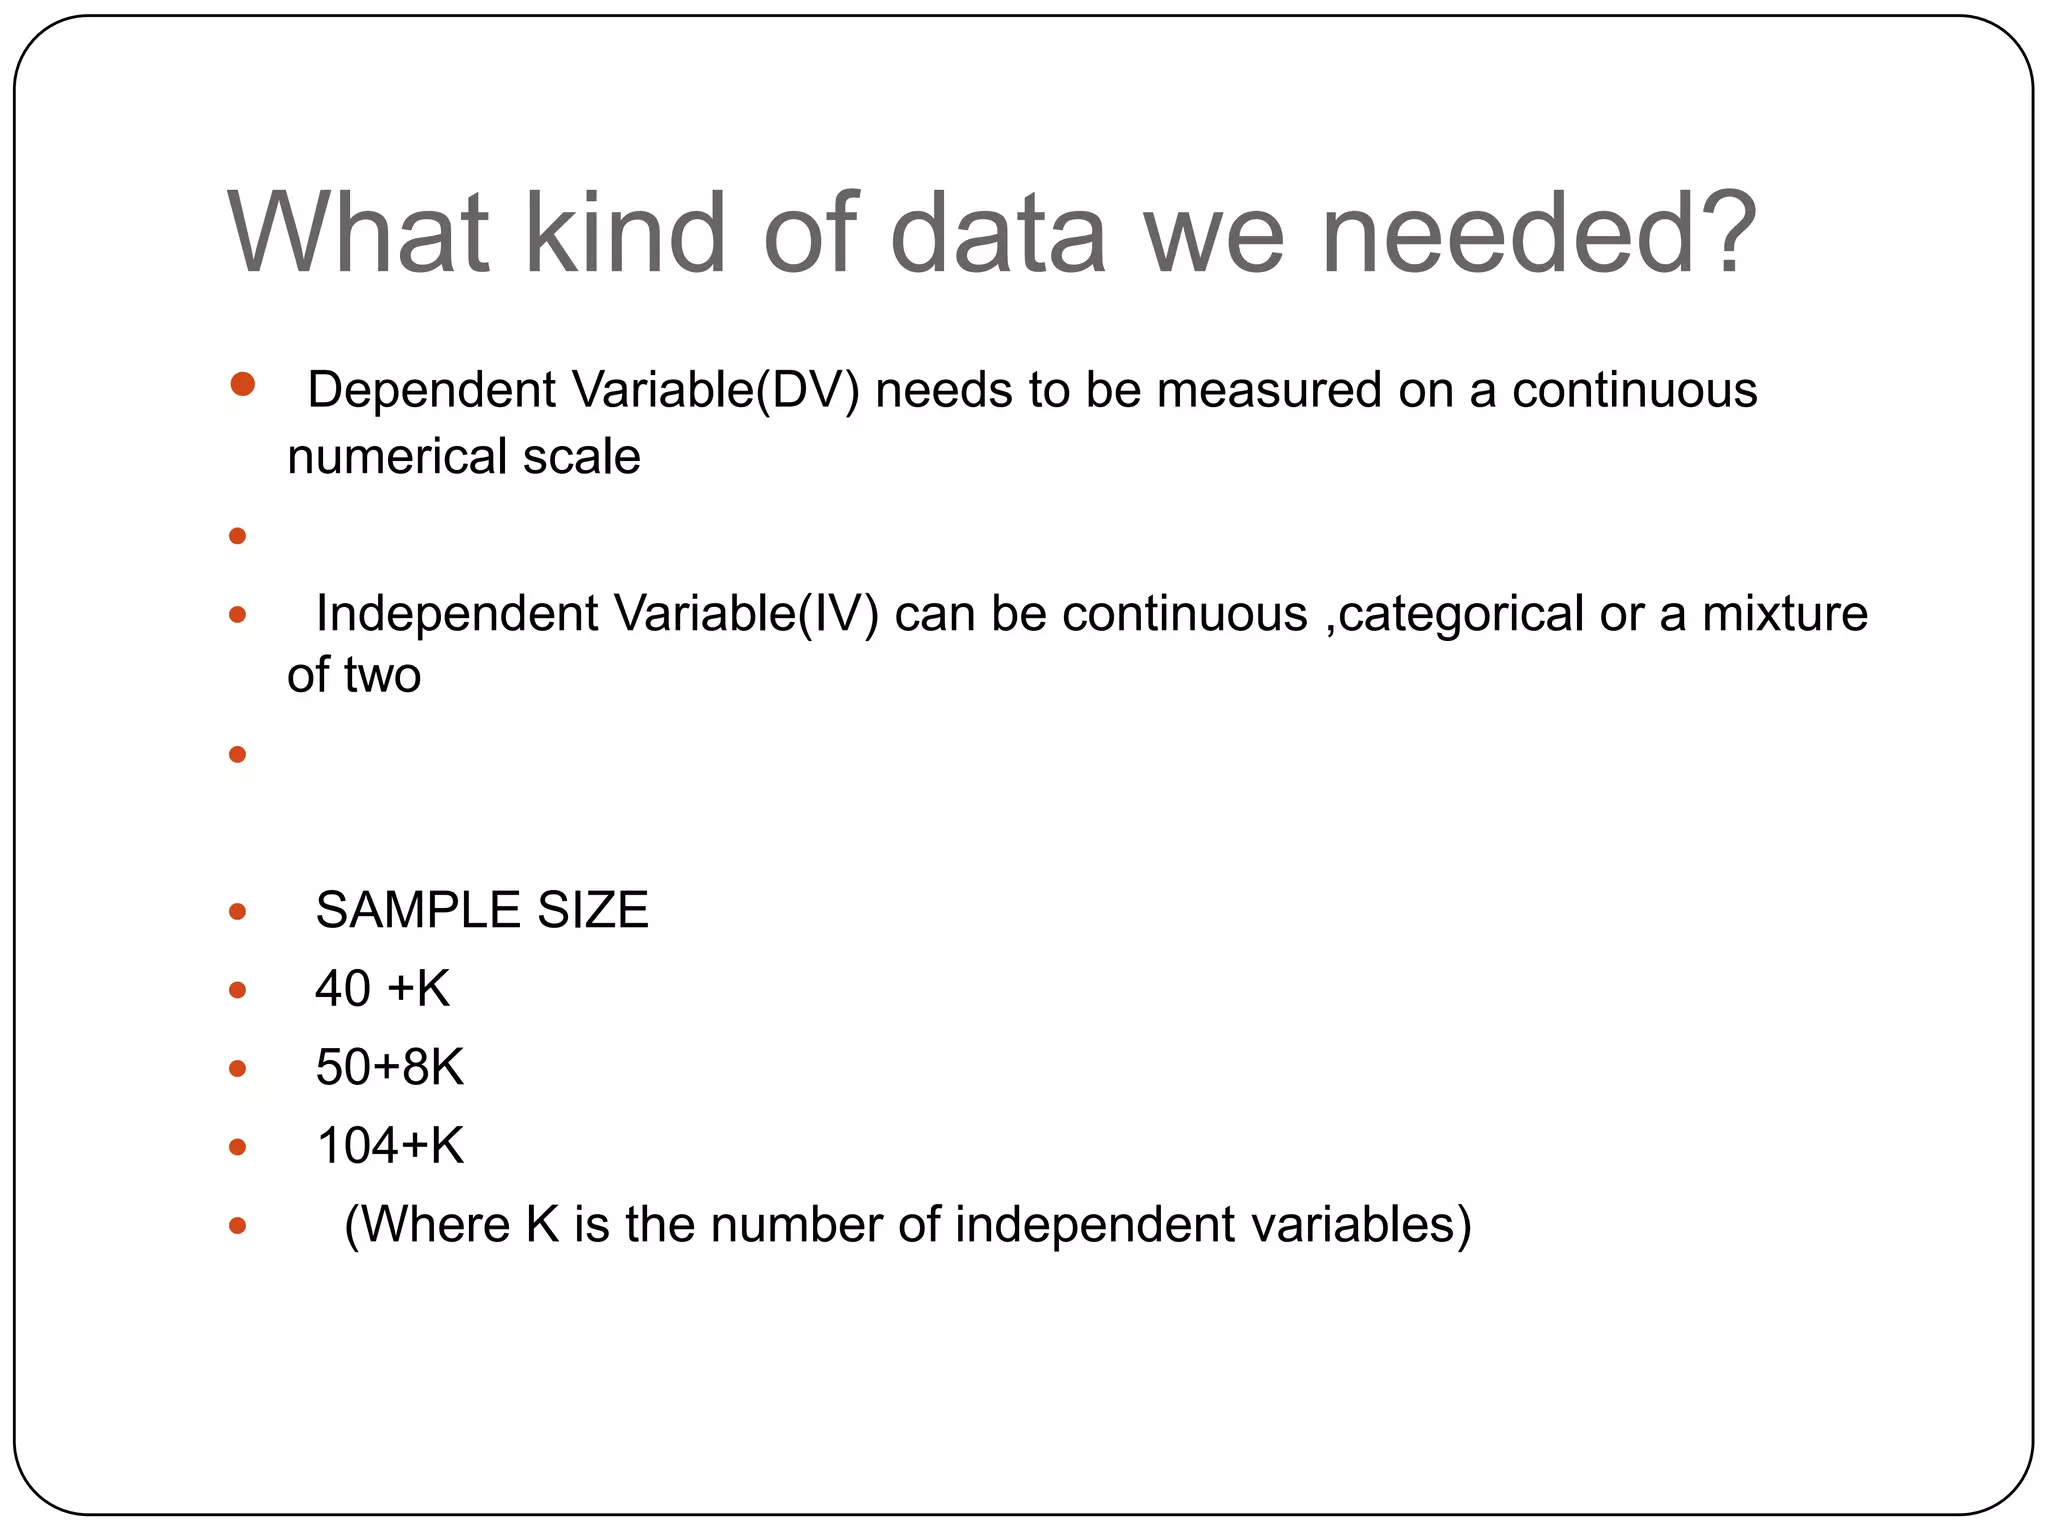
Dependent variable is continuous, while independent variables can be continuous or dichotomous.
Requires continuous dependent variable and varied independent variables; recommended sample size is 40+K.
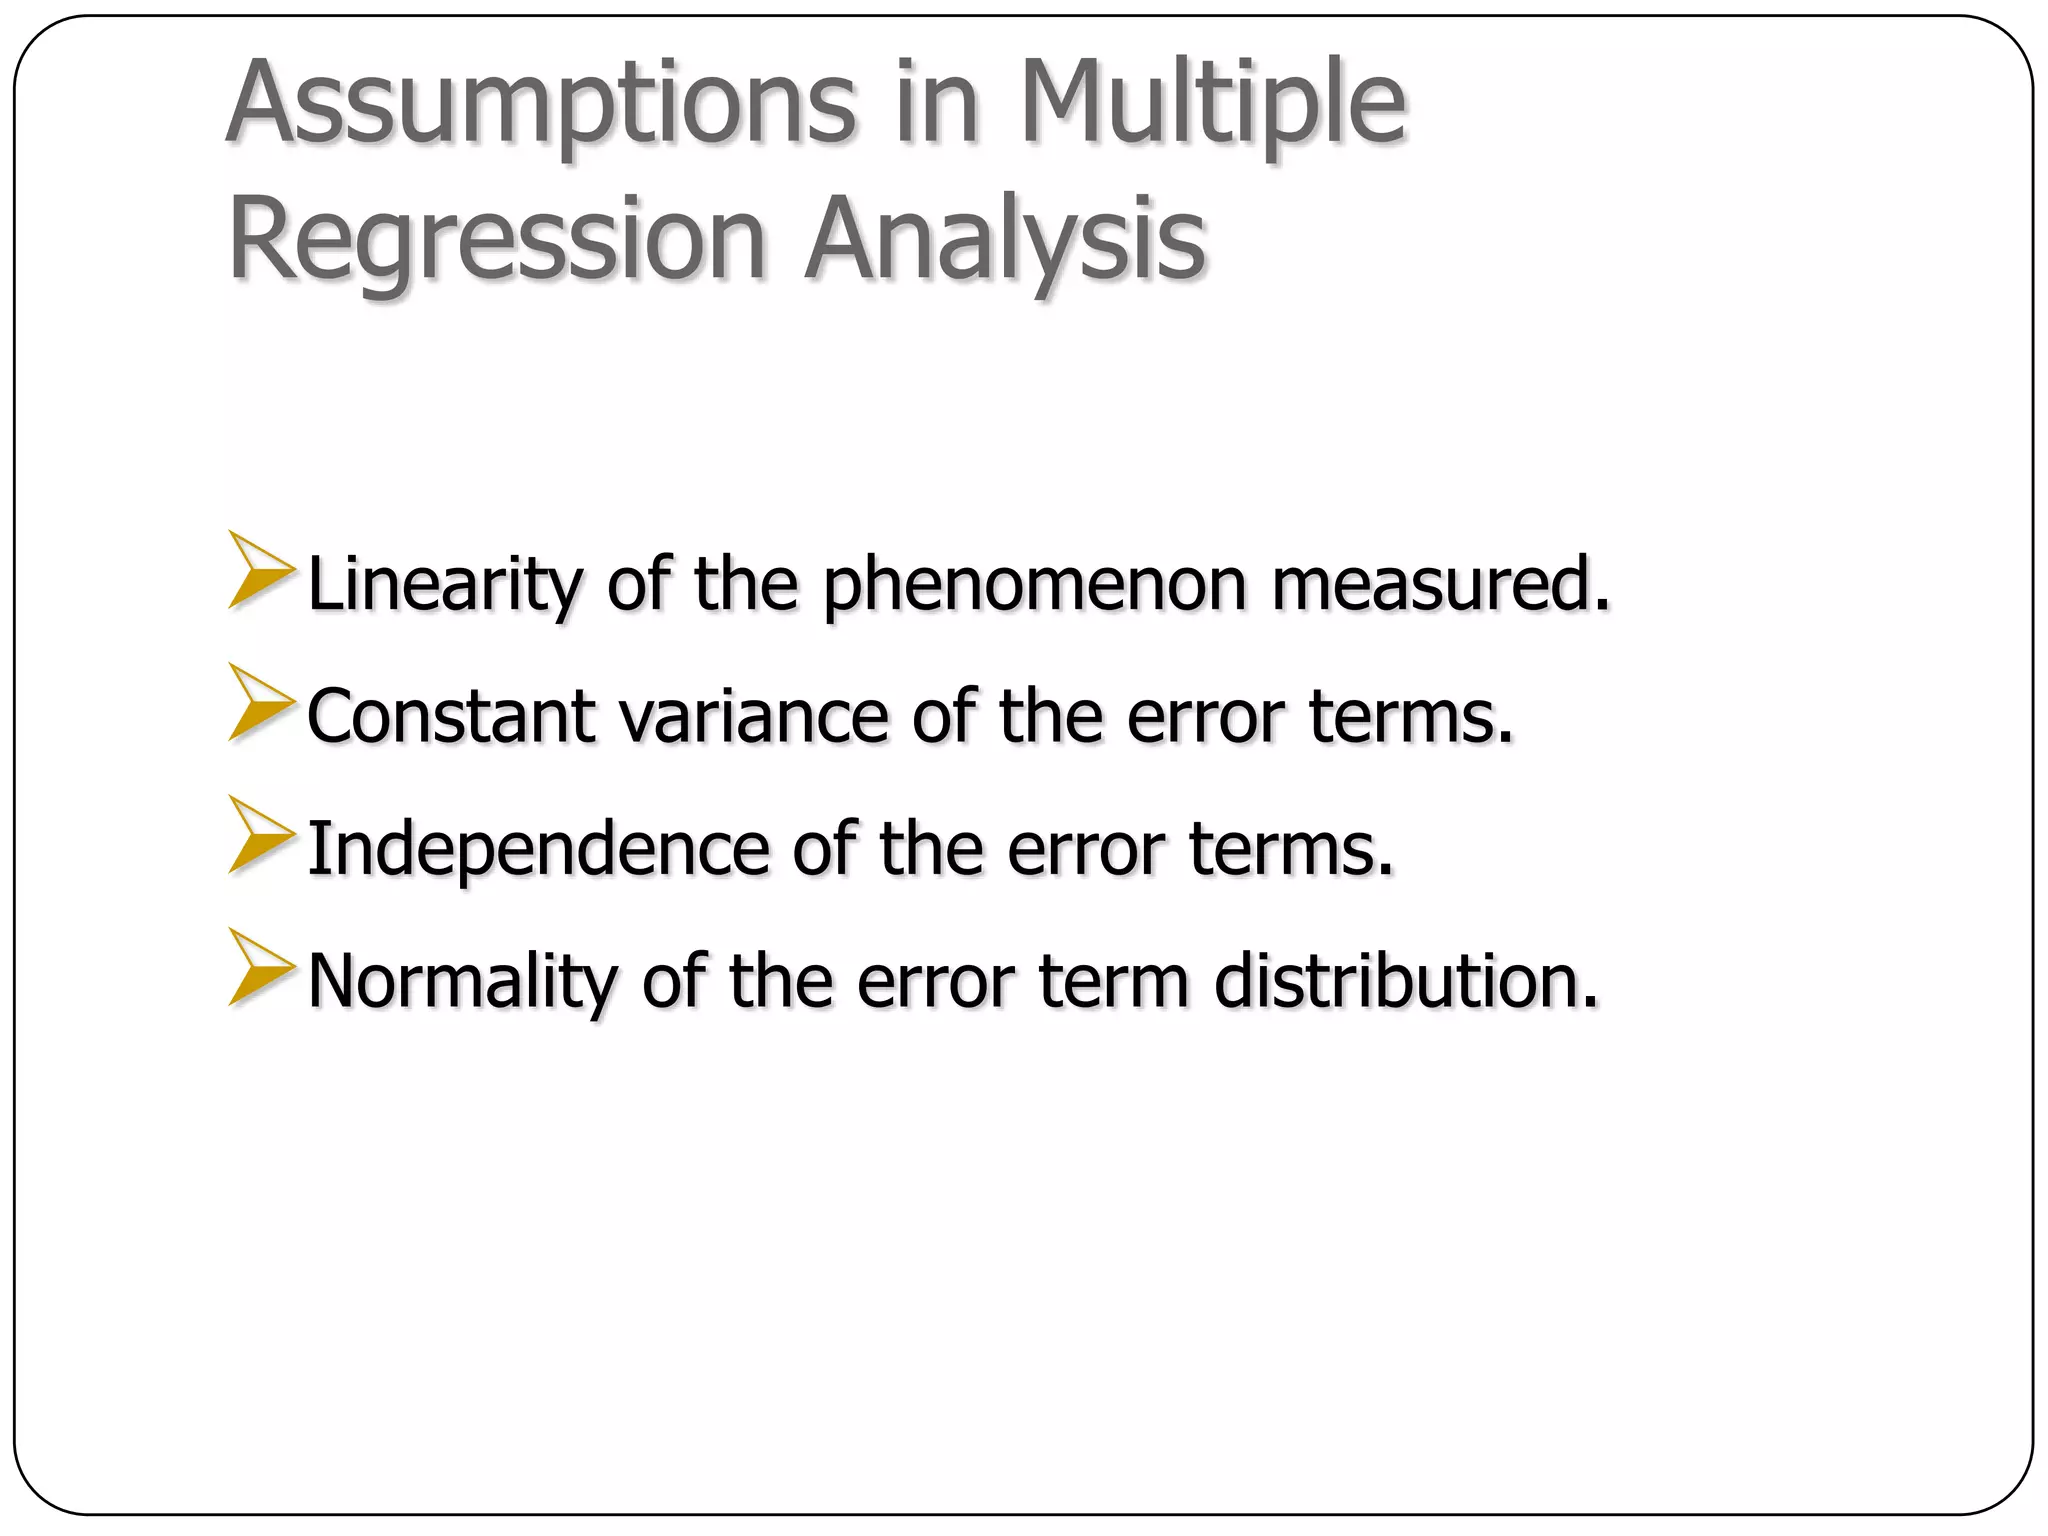
Key assumptions: linearity, constant variance, independence, and normality of error terms.
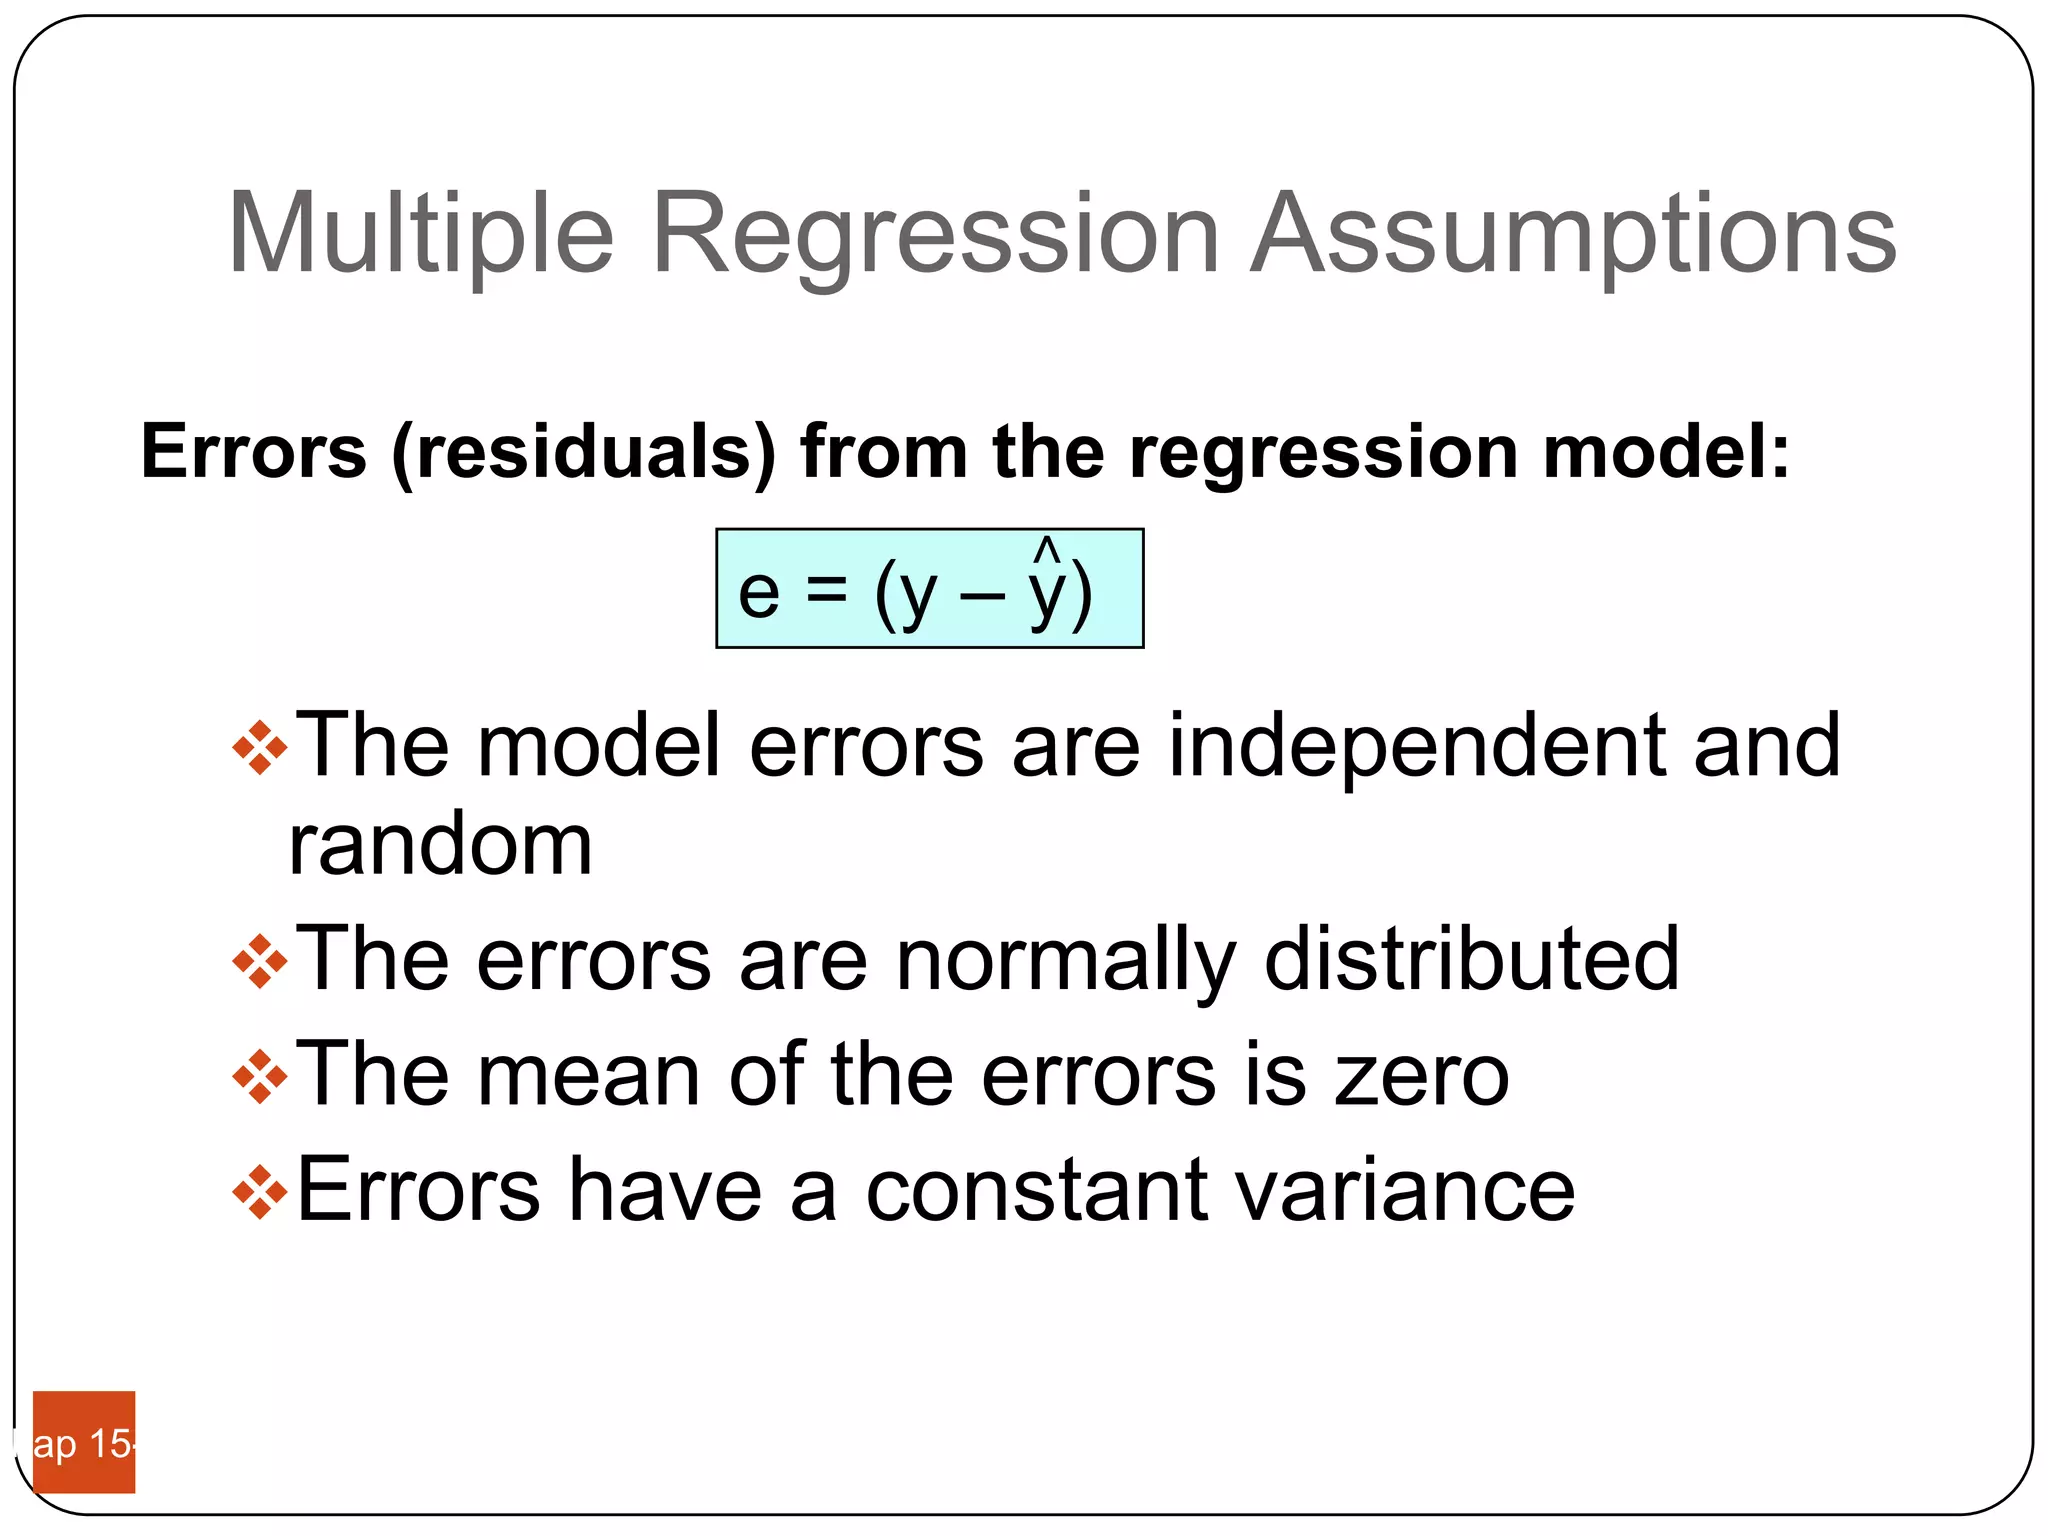
Model errors should be independent, normally distributed, with a mean of zero and constant variance.
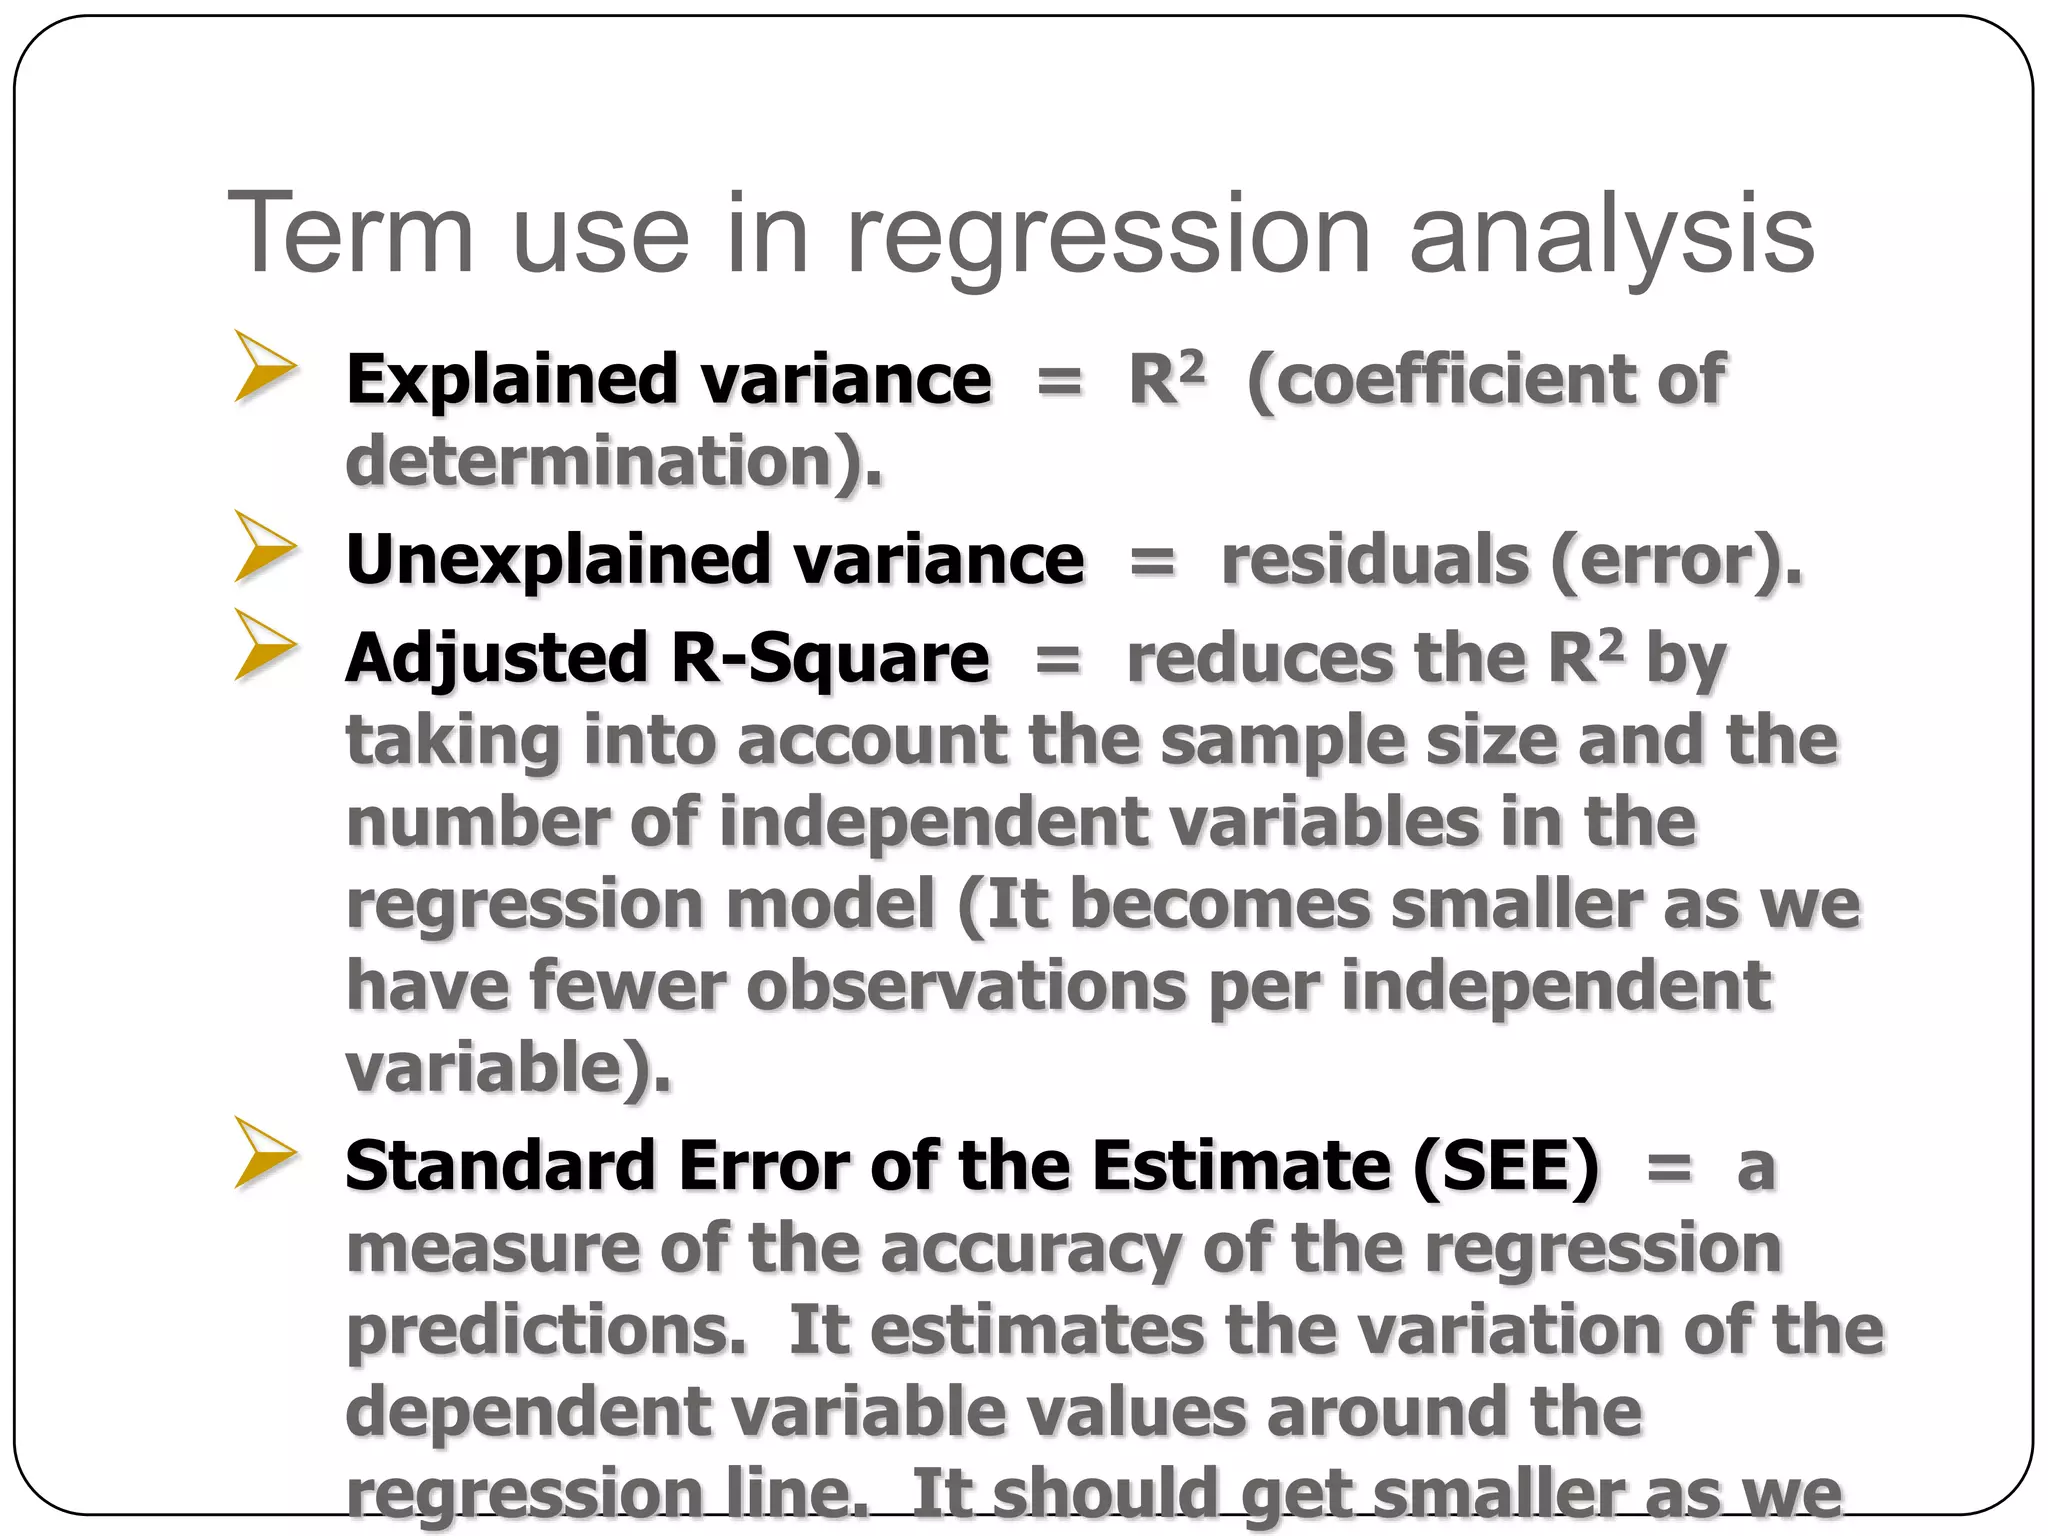
Concepts of explained/unexplained variance, adjusted R-square, standard error of estimate in regression.
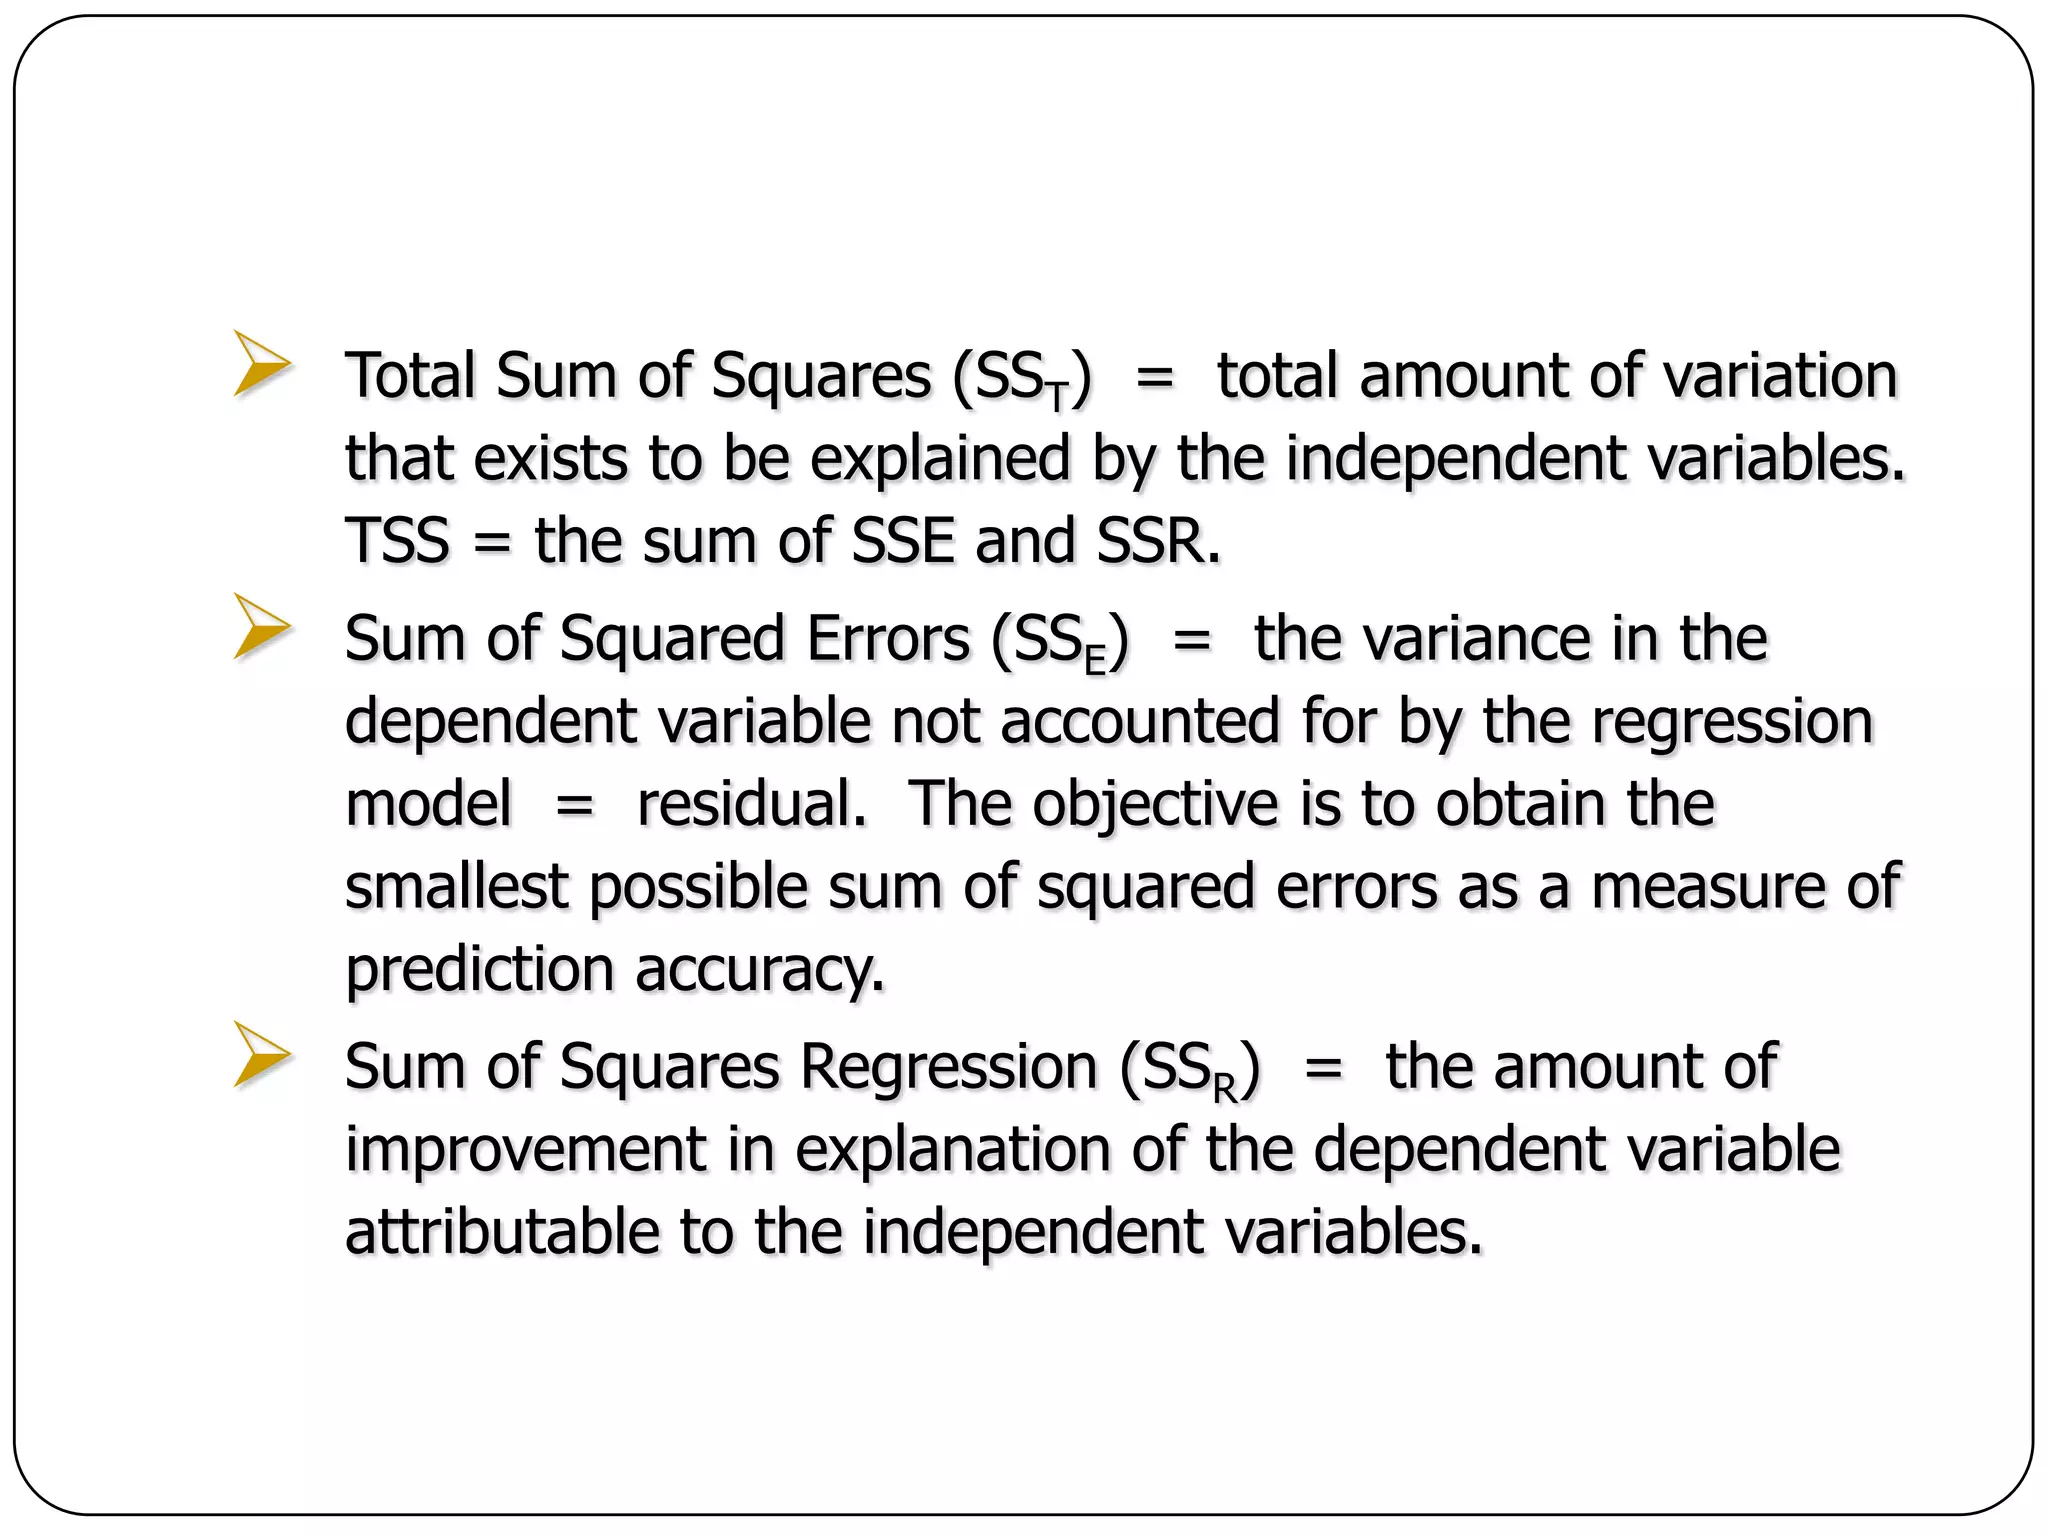
Definitions of total sum of squares, sum of squared errors, and sum of squares regression.
Introduction to conducting regression analysis using SPSS software.


![[DSC Europe 25] Jim Sterne - Adopting Generative AI Capabilities Into the Ent...](https://cdn.slidesharecdn.com/ss_thumbnails/sxhpofuorcagxsaulkmt-3-251204082258-7e66bc48-thumbnail.jpg?width=640&height=640&fit=bounds)


![[DSC Europe 25] Max Talanov - Non digital NNs.pptx](https://cdn.slidesharecdn.com/ss_thumbnails/wif8tr3gtua74qvtopke-non-digital-nns-251205090438-26b0eea6-thumbnail.jpg?width=640&height=640&fit=bounds)


![[DSC Europe 25] Petar Zivanov - AI meets documents From chatbots to AI-powere...](https://cdn.slidesharecdn.com/ss_thumbnails/xer2bb6nrdc8pdpev0pc-8-251204082258-7c2fa4a1-thumbnail.jpg?width=640&height=640&fit=bounds)
![[DSC Europe 25] Bogdan Daniel Maruneac - AI - It starts with you.pptx](https://cdn.slidesharecdn.com/ss_thumbnails/odov3snhrcqs9hx5ny2n-4-251205085715-f1daacfe-thumbnail.jpg?width=640&height=640&fit=bounds)
![[DSC Europe 25] Goran Obradovic - The Rise of Sovereign AI: Building the Regi...](https://cdn.slidesharecdn.com/ss_thumbnails/7nw2xxixrxqdxvrb5wca-6-251205085714-ab09a2ac-thumbnail.jpg?width=640&height=640&fit=bounds)