Downloaded 517 times


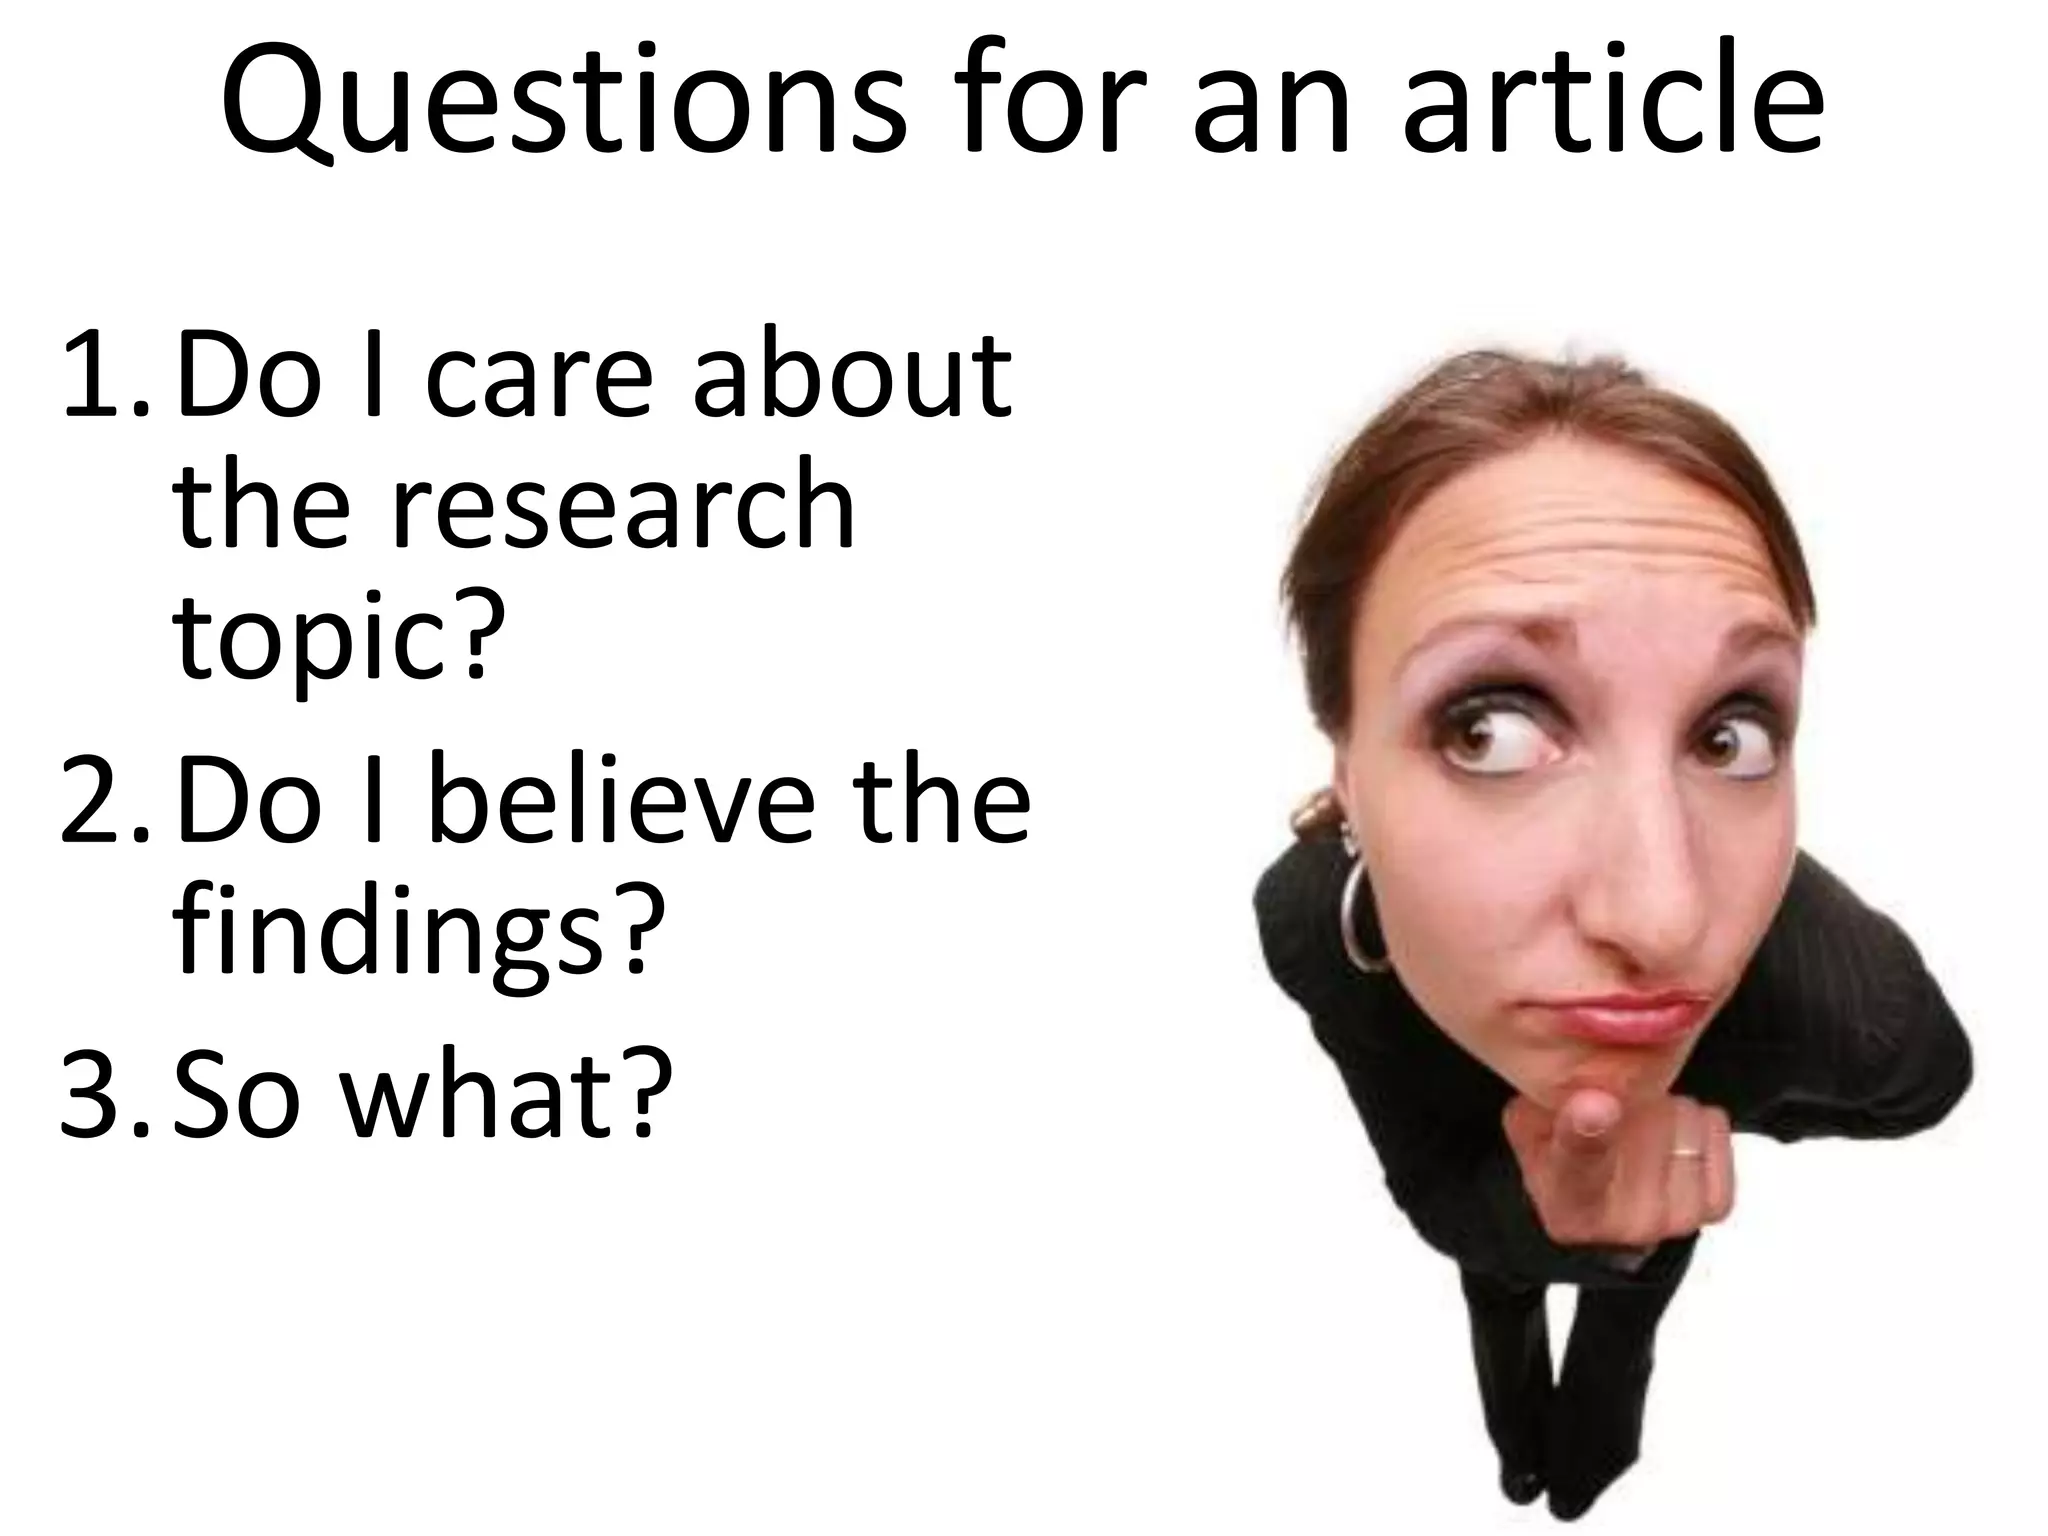
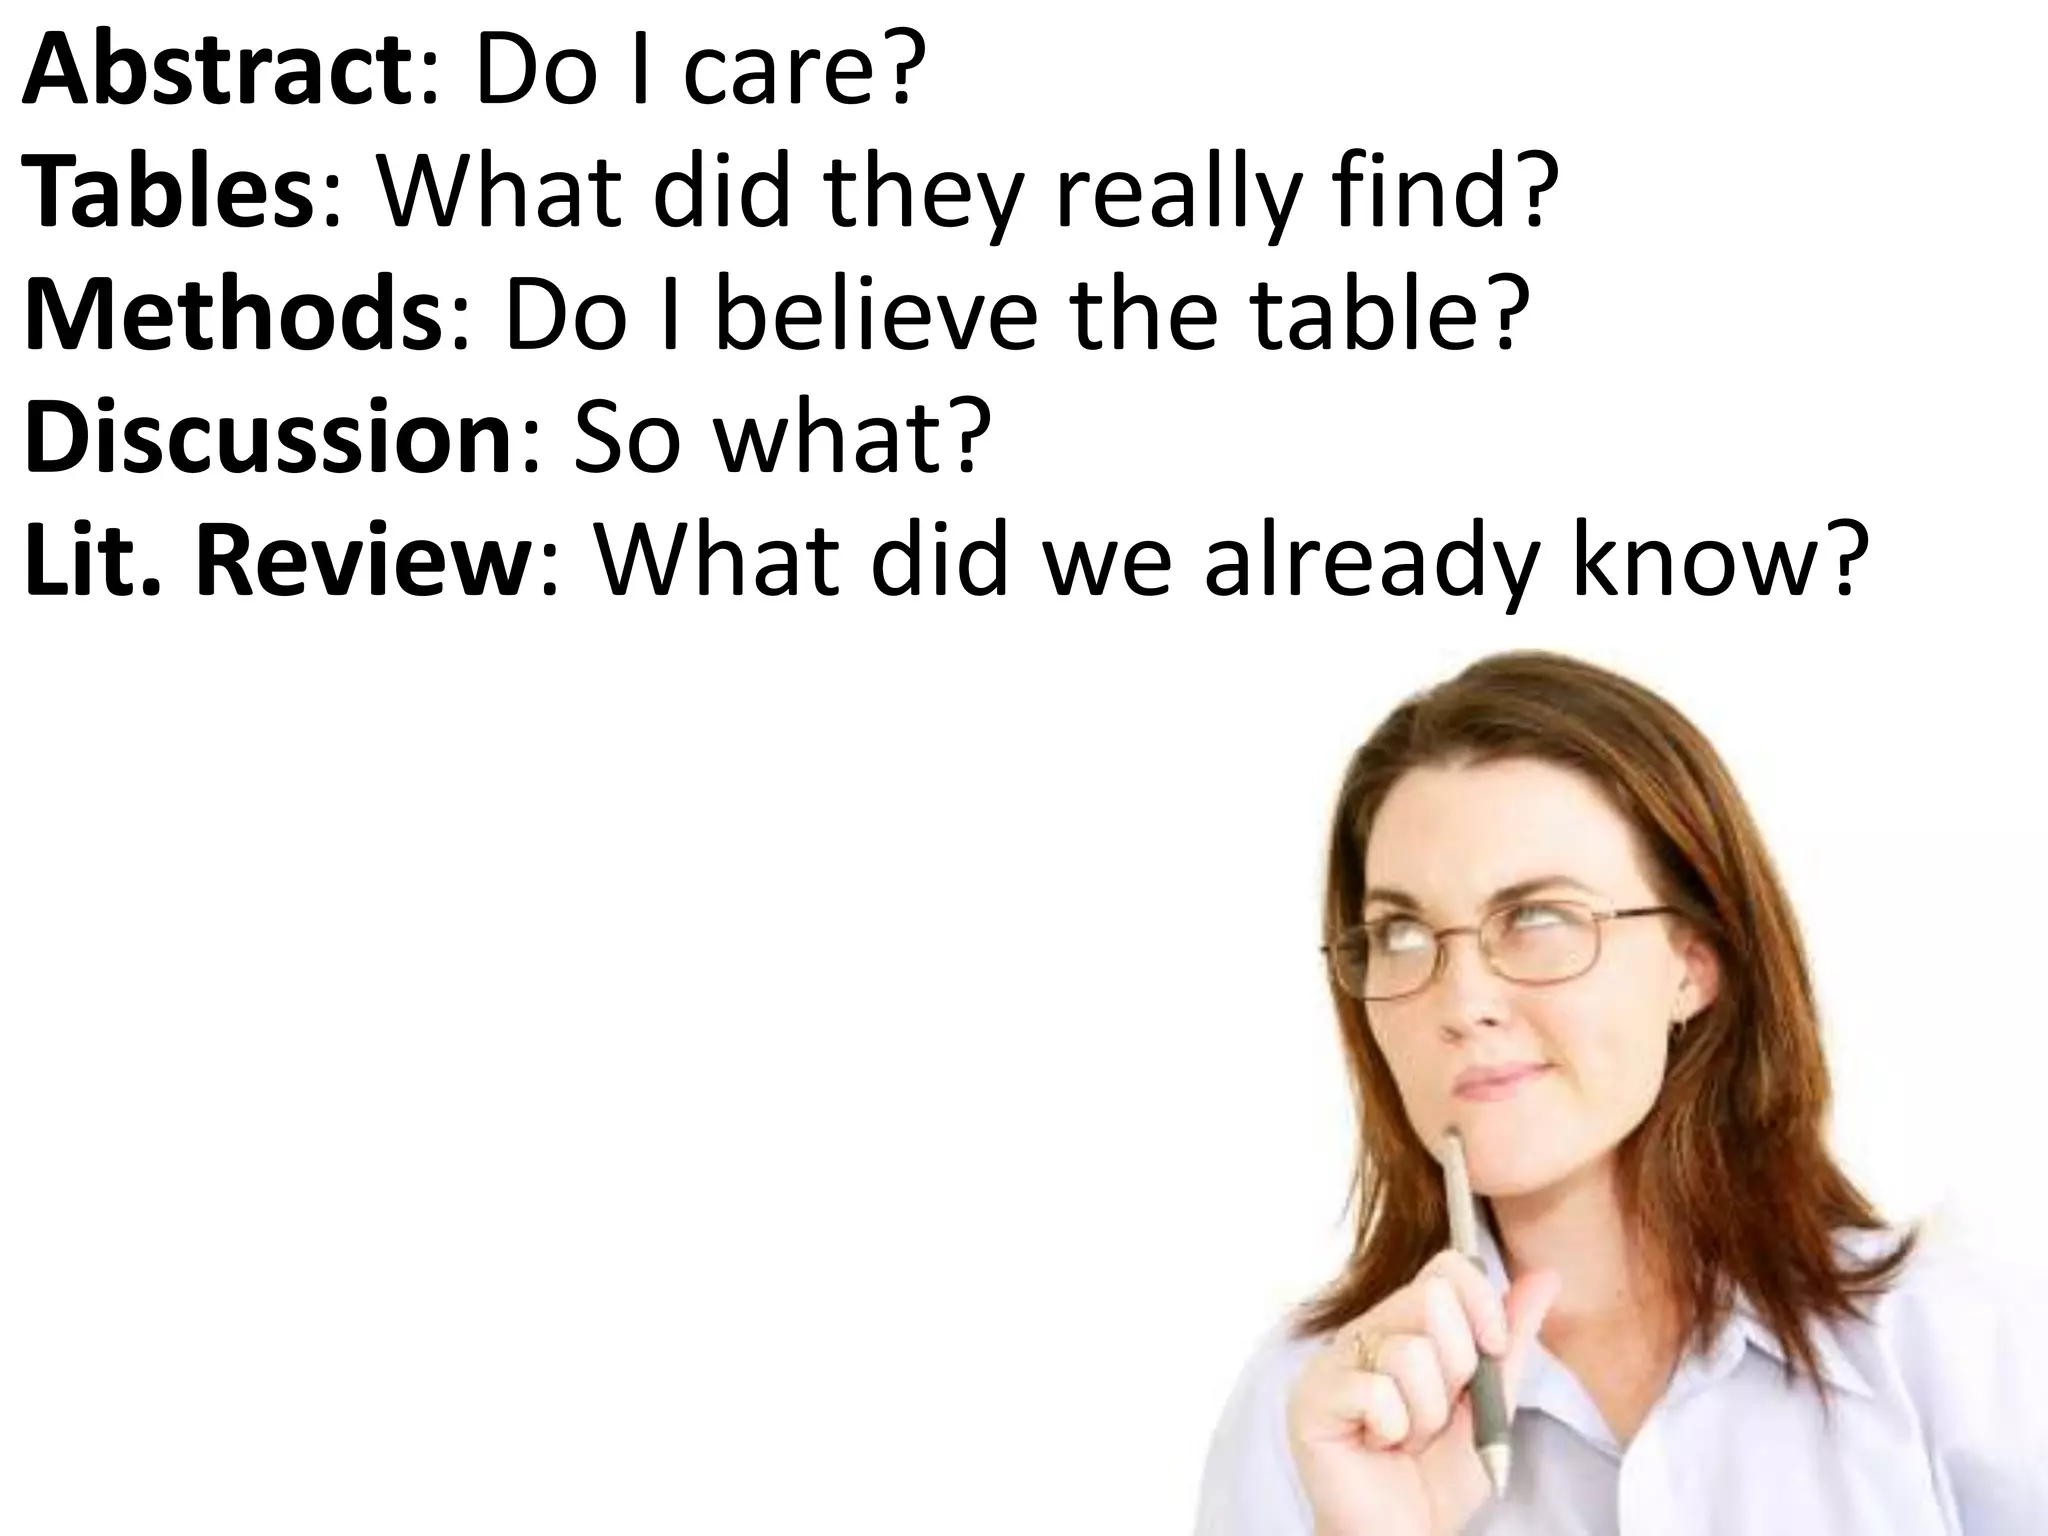
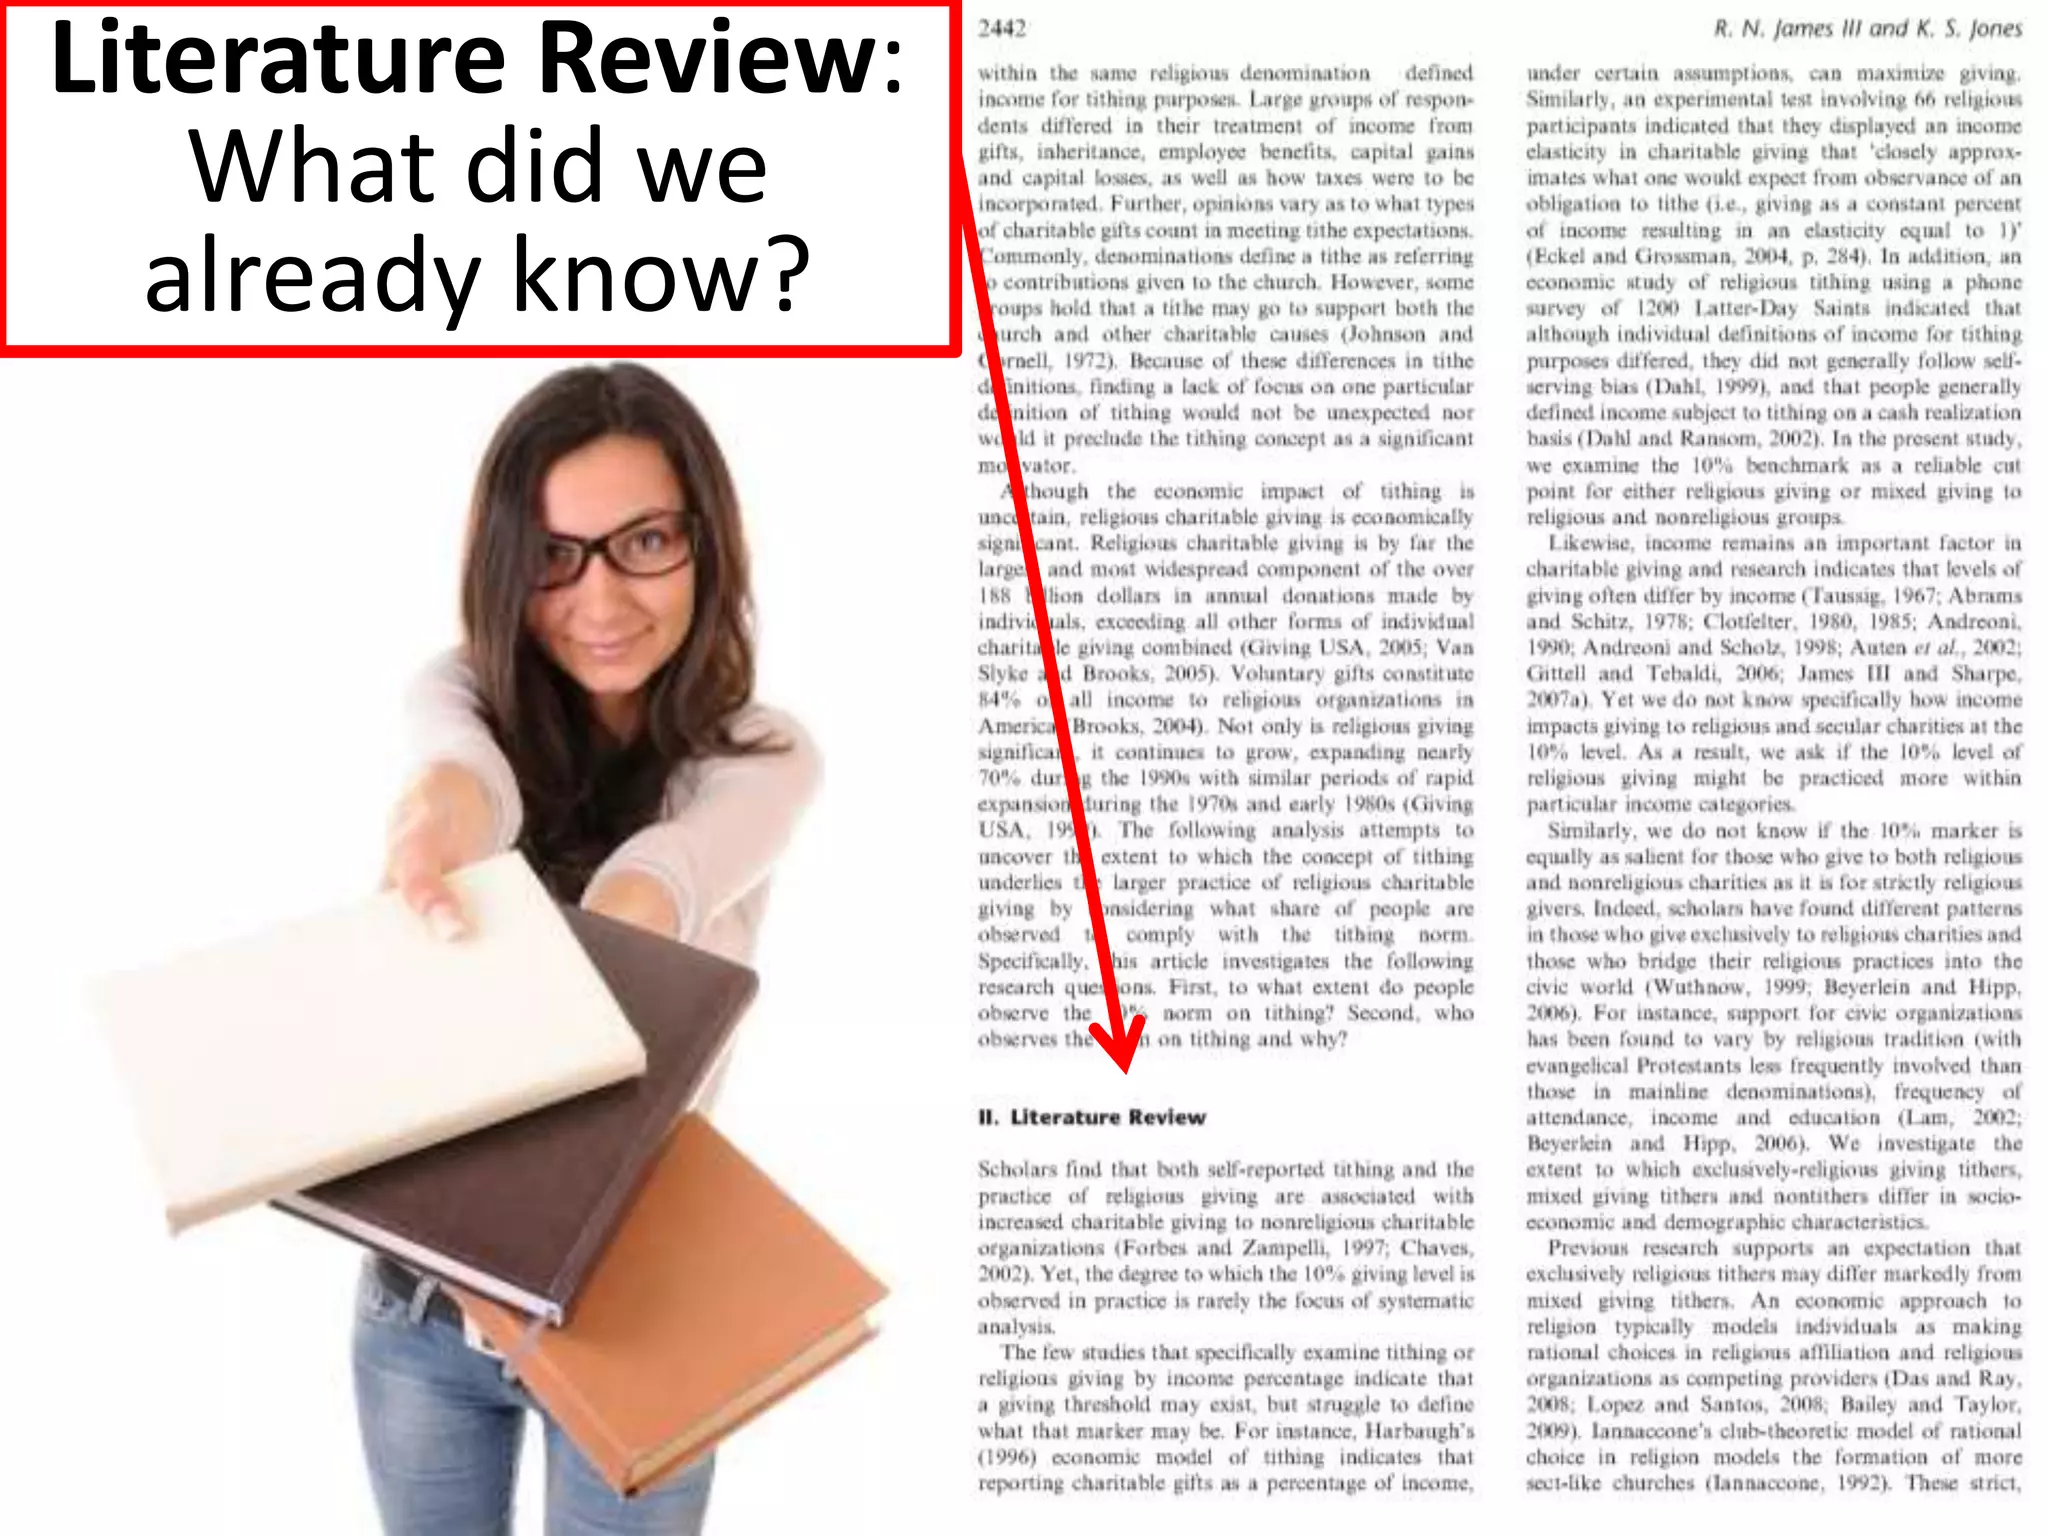
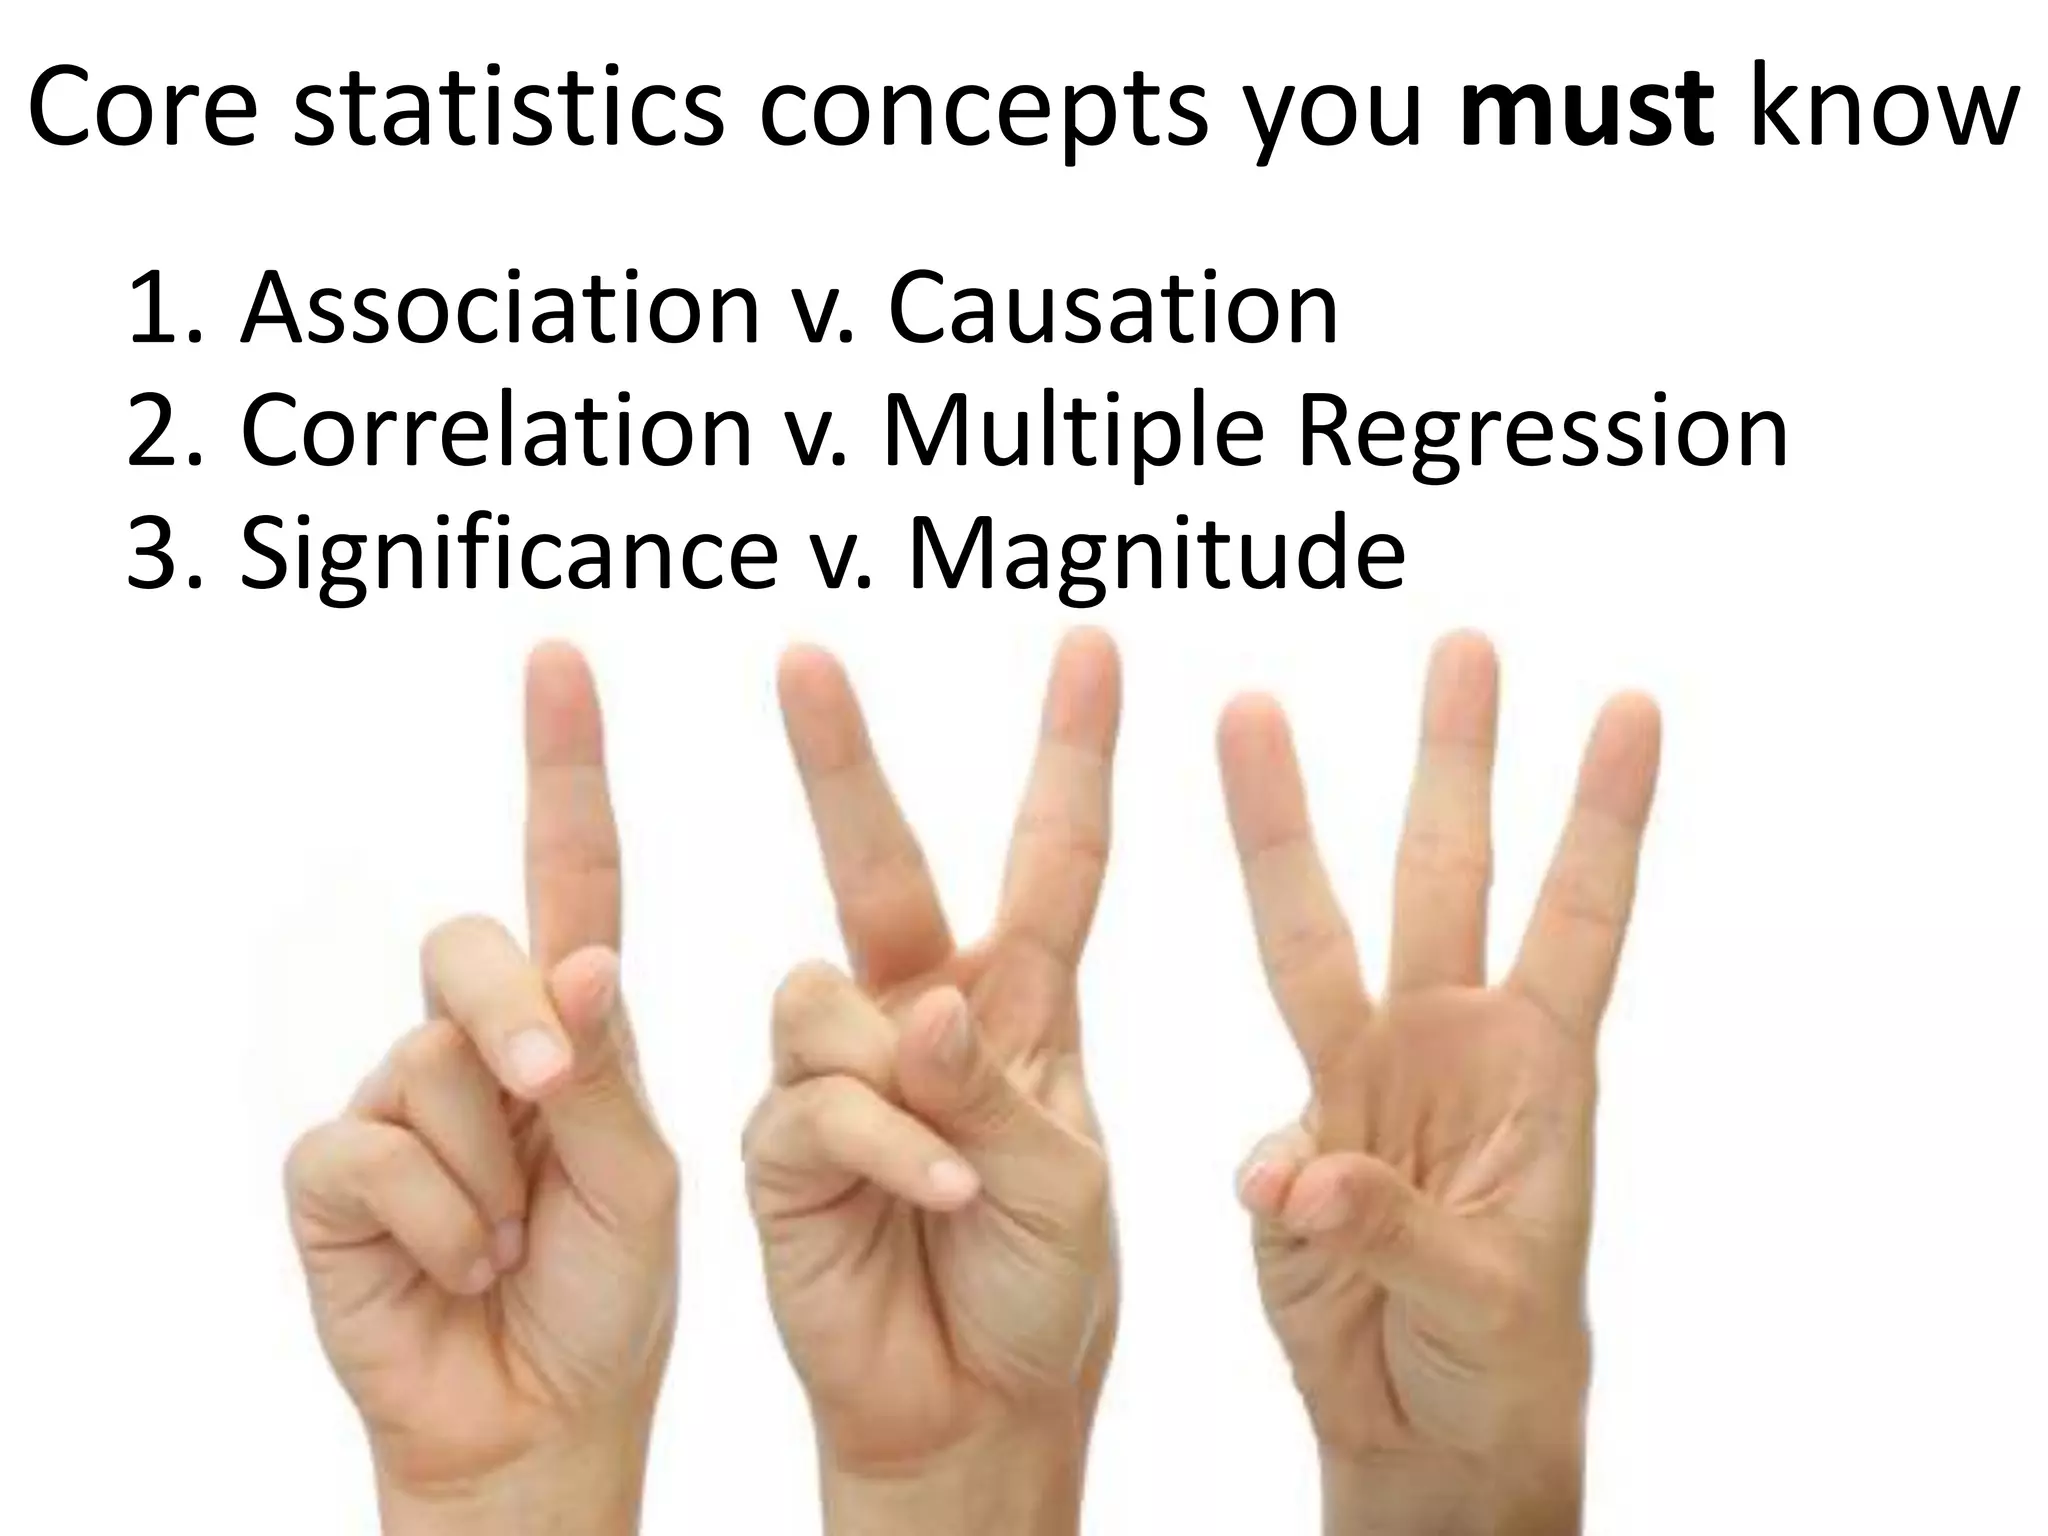
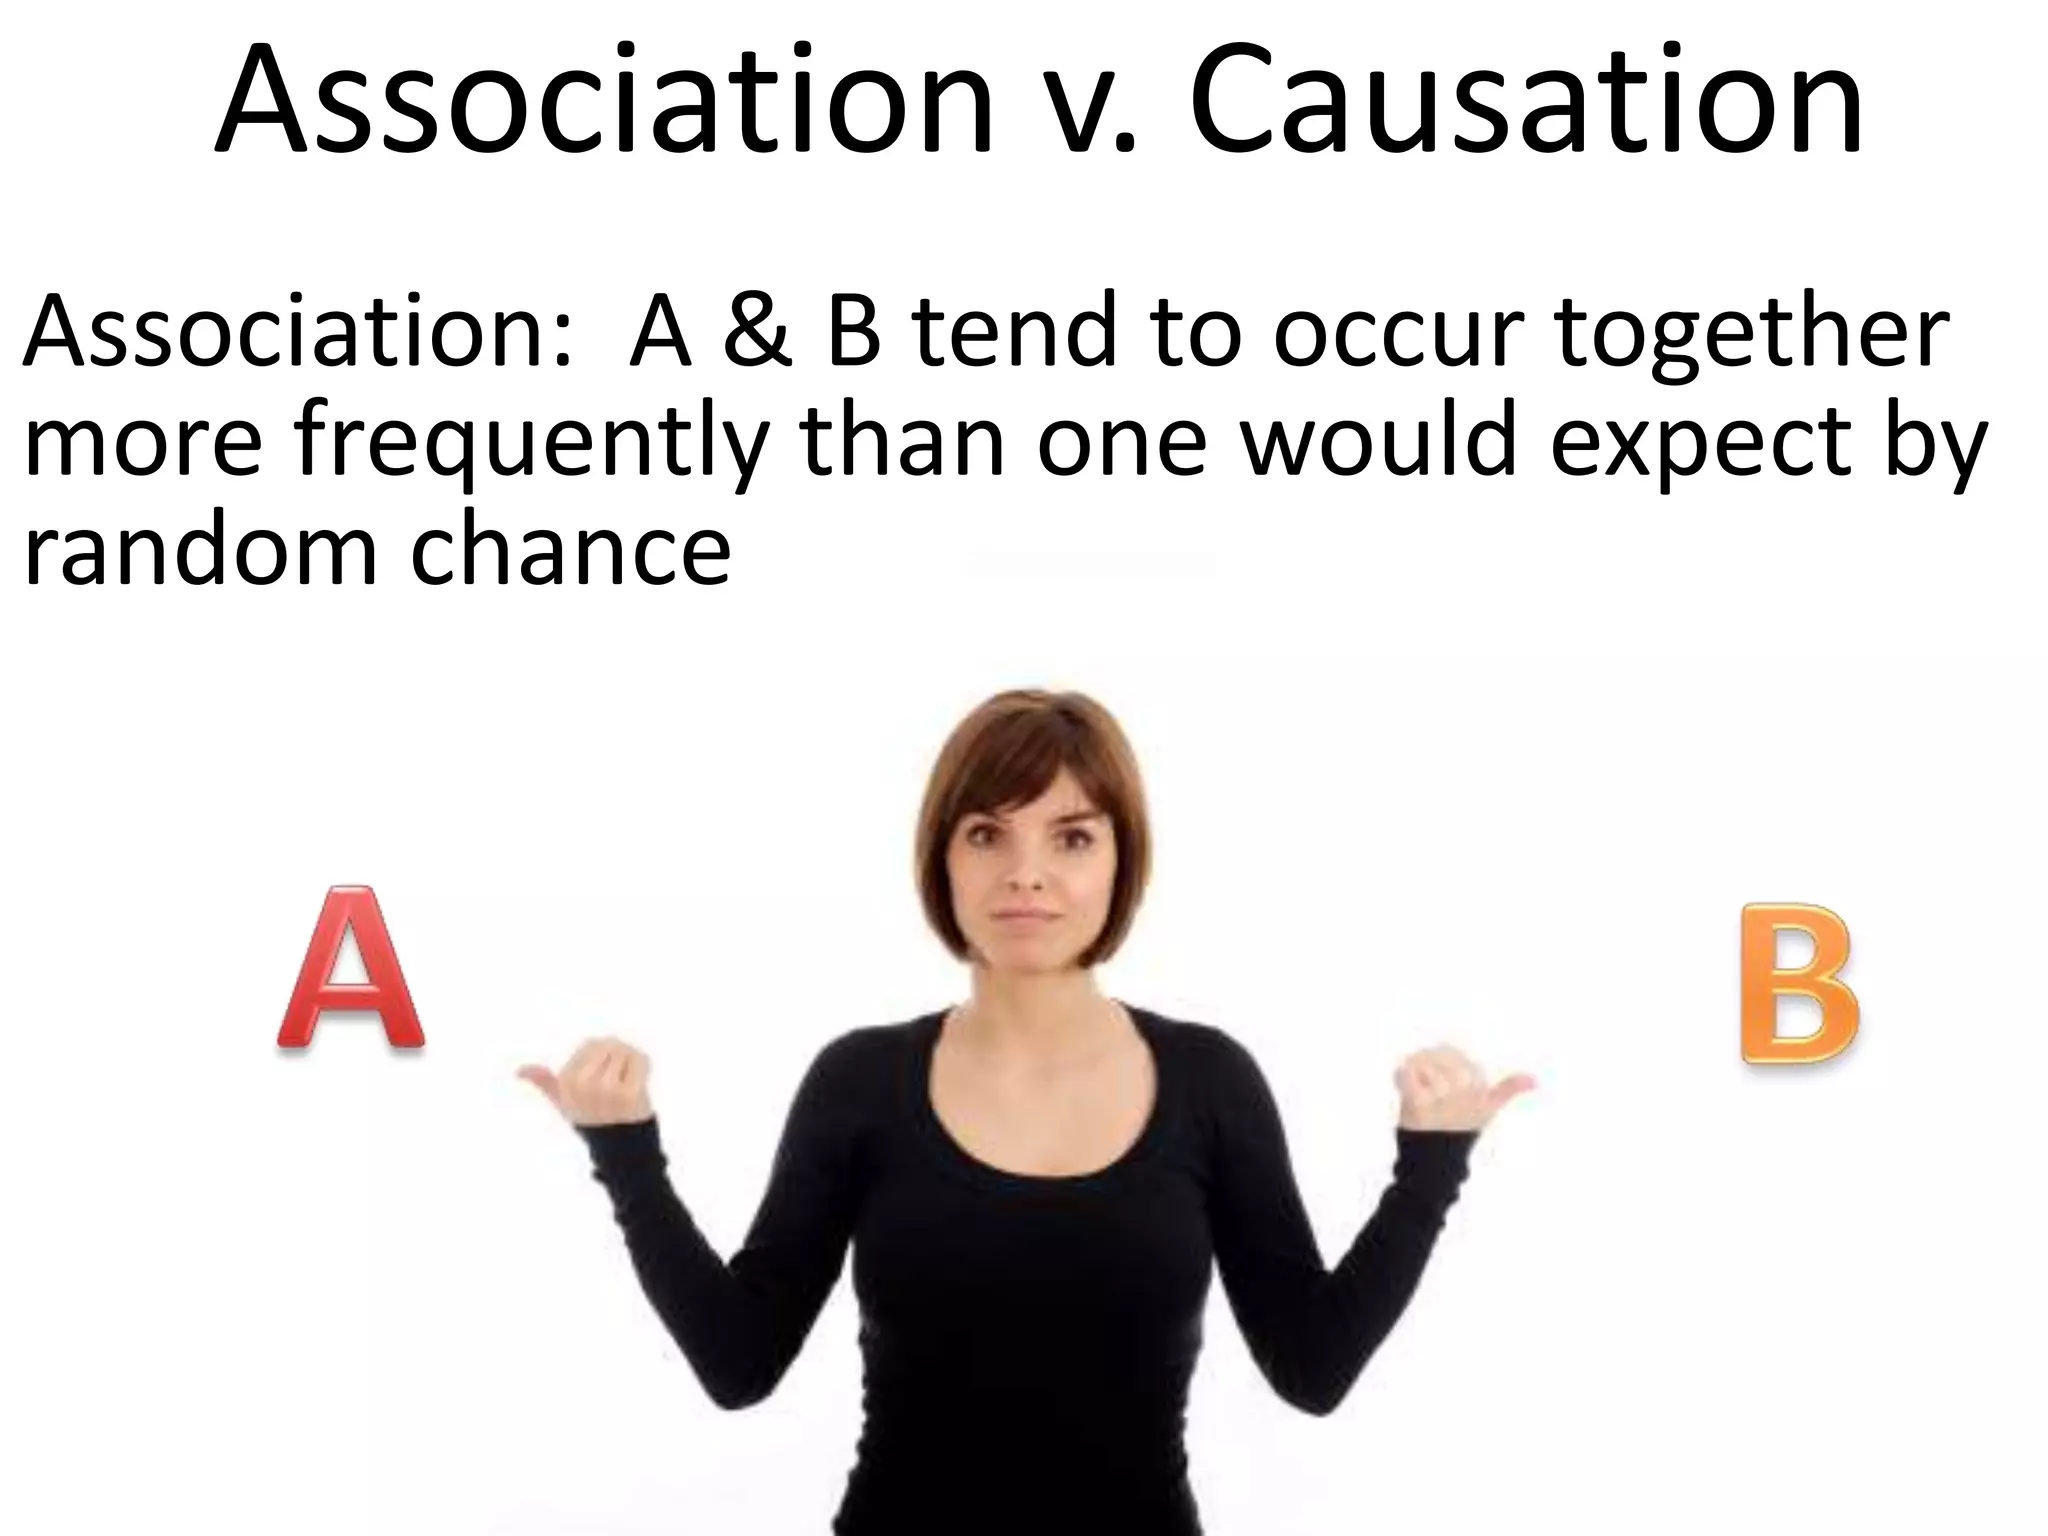
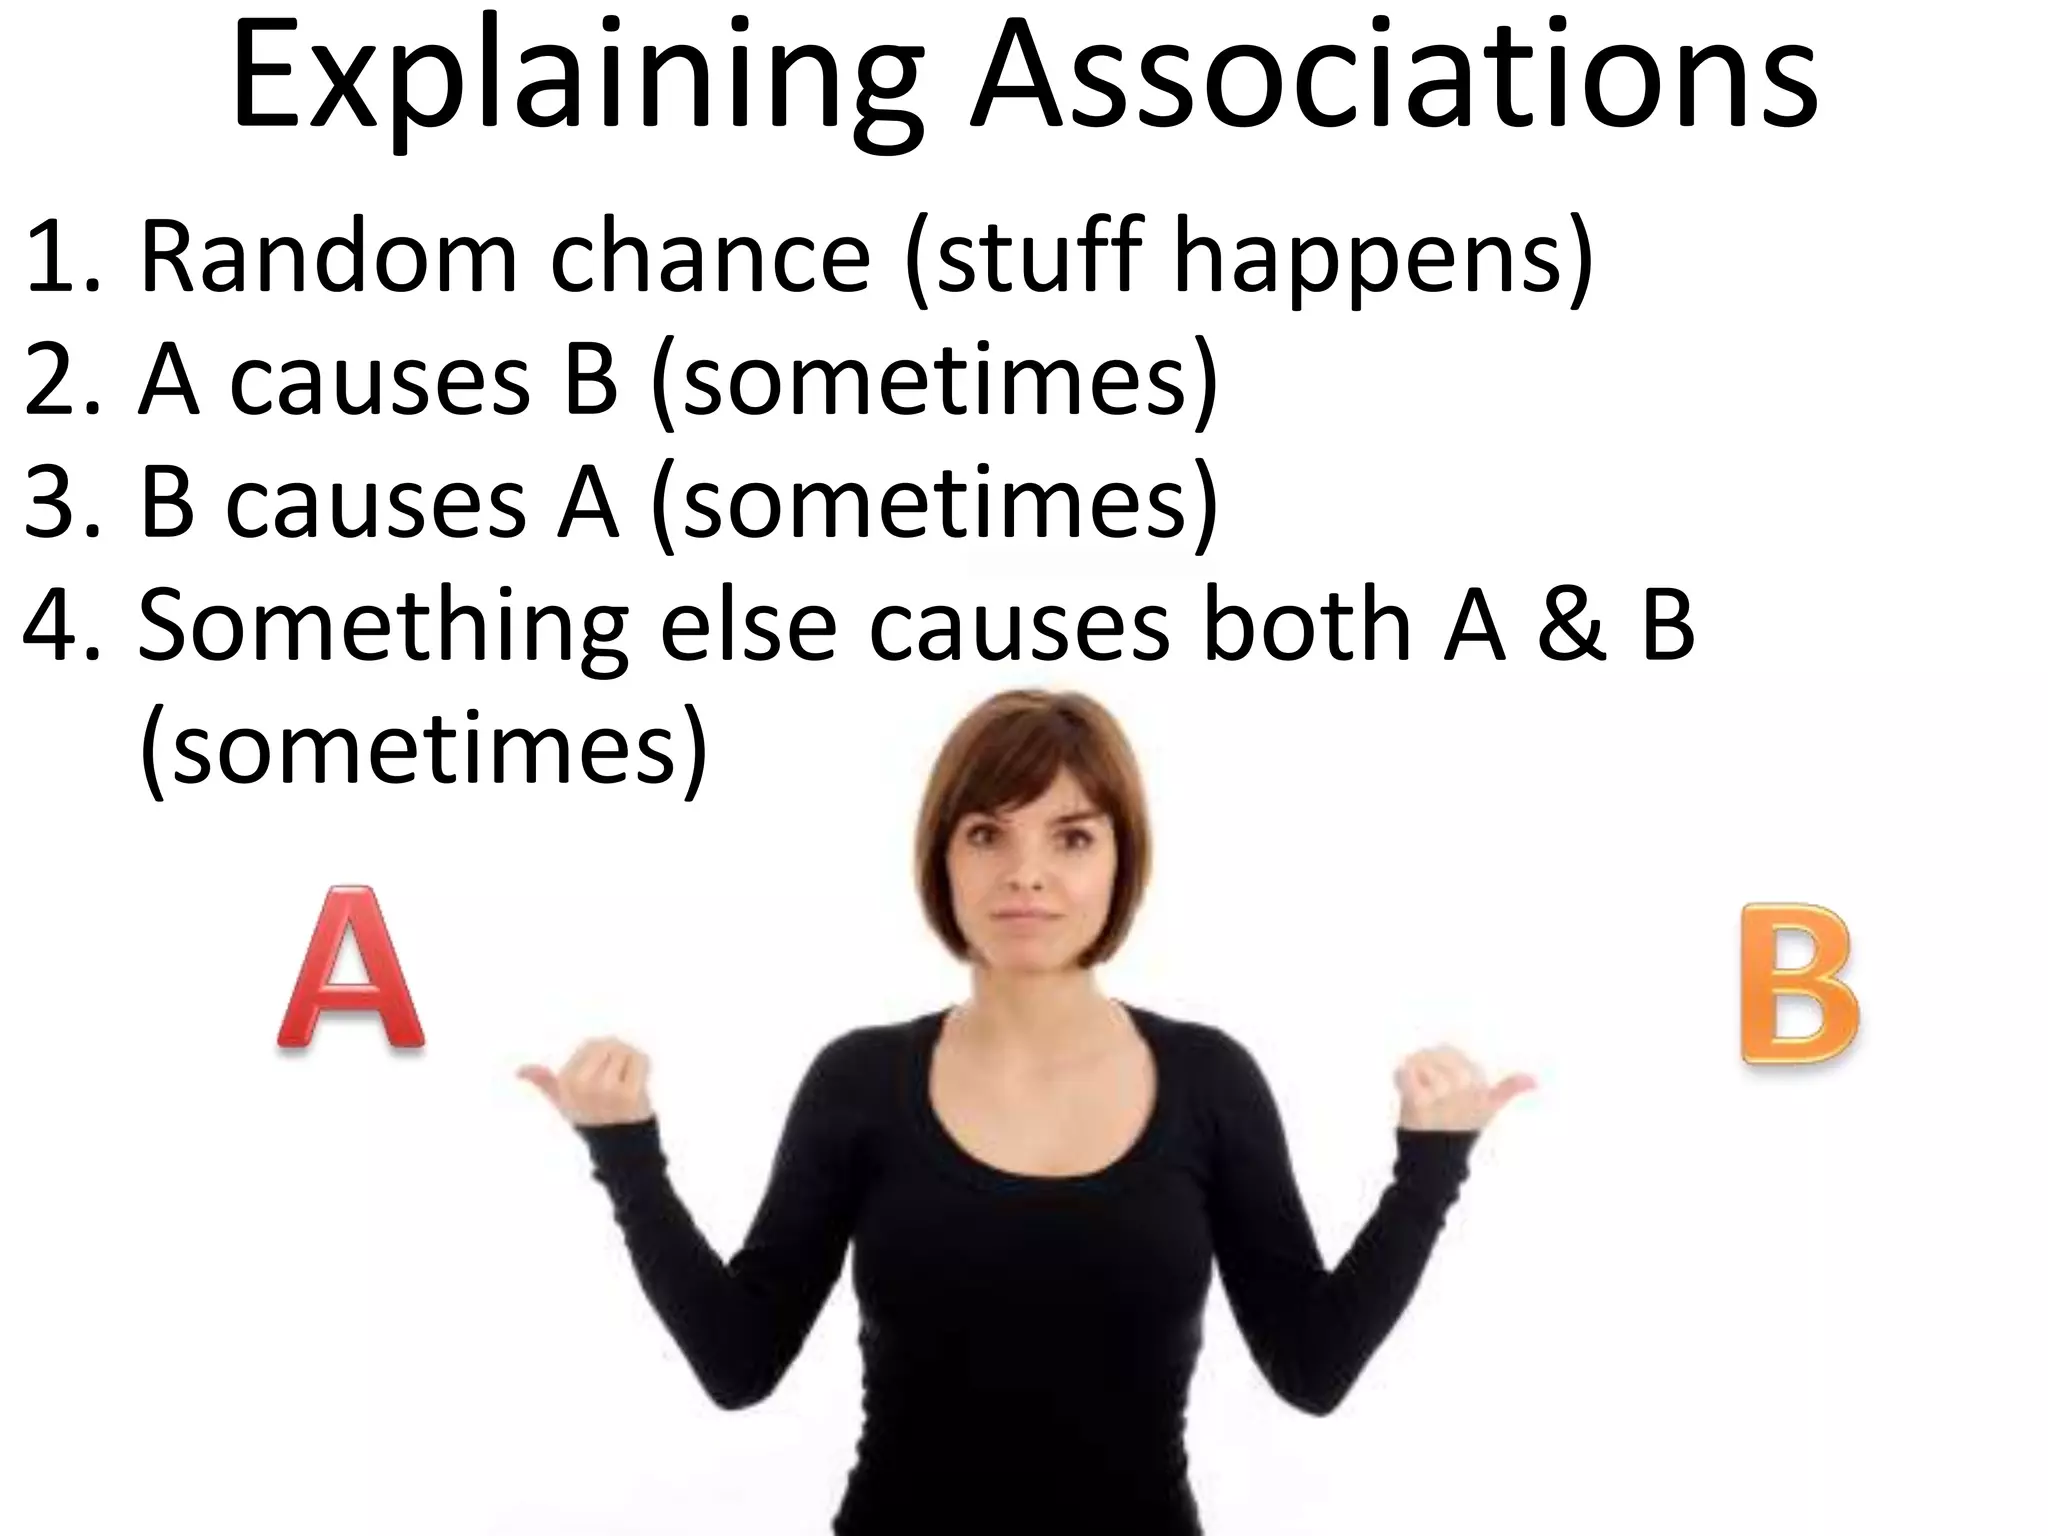


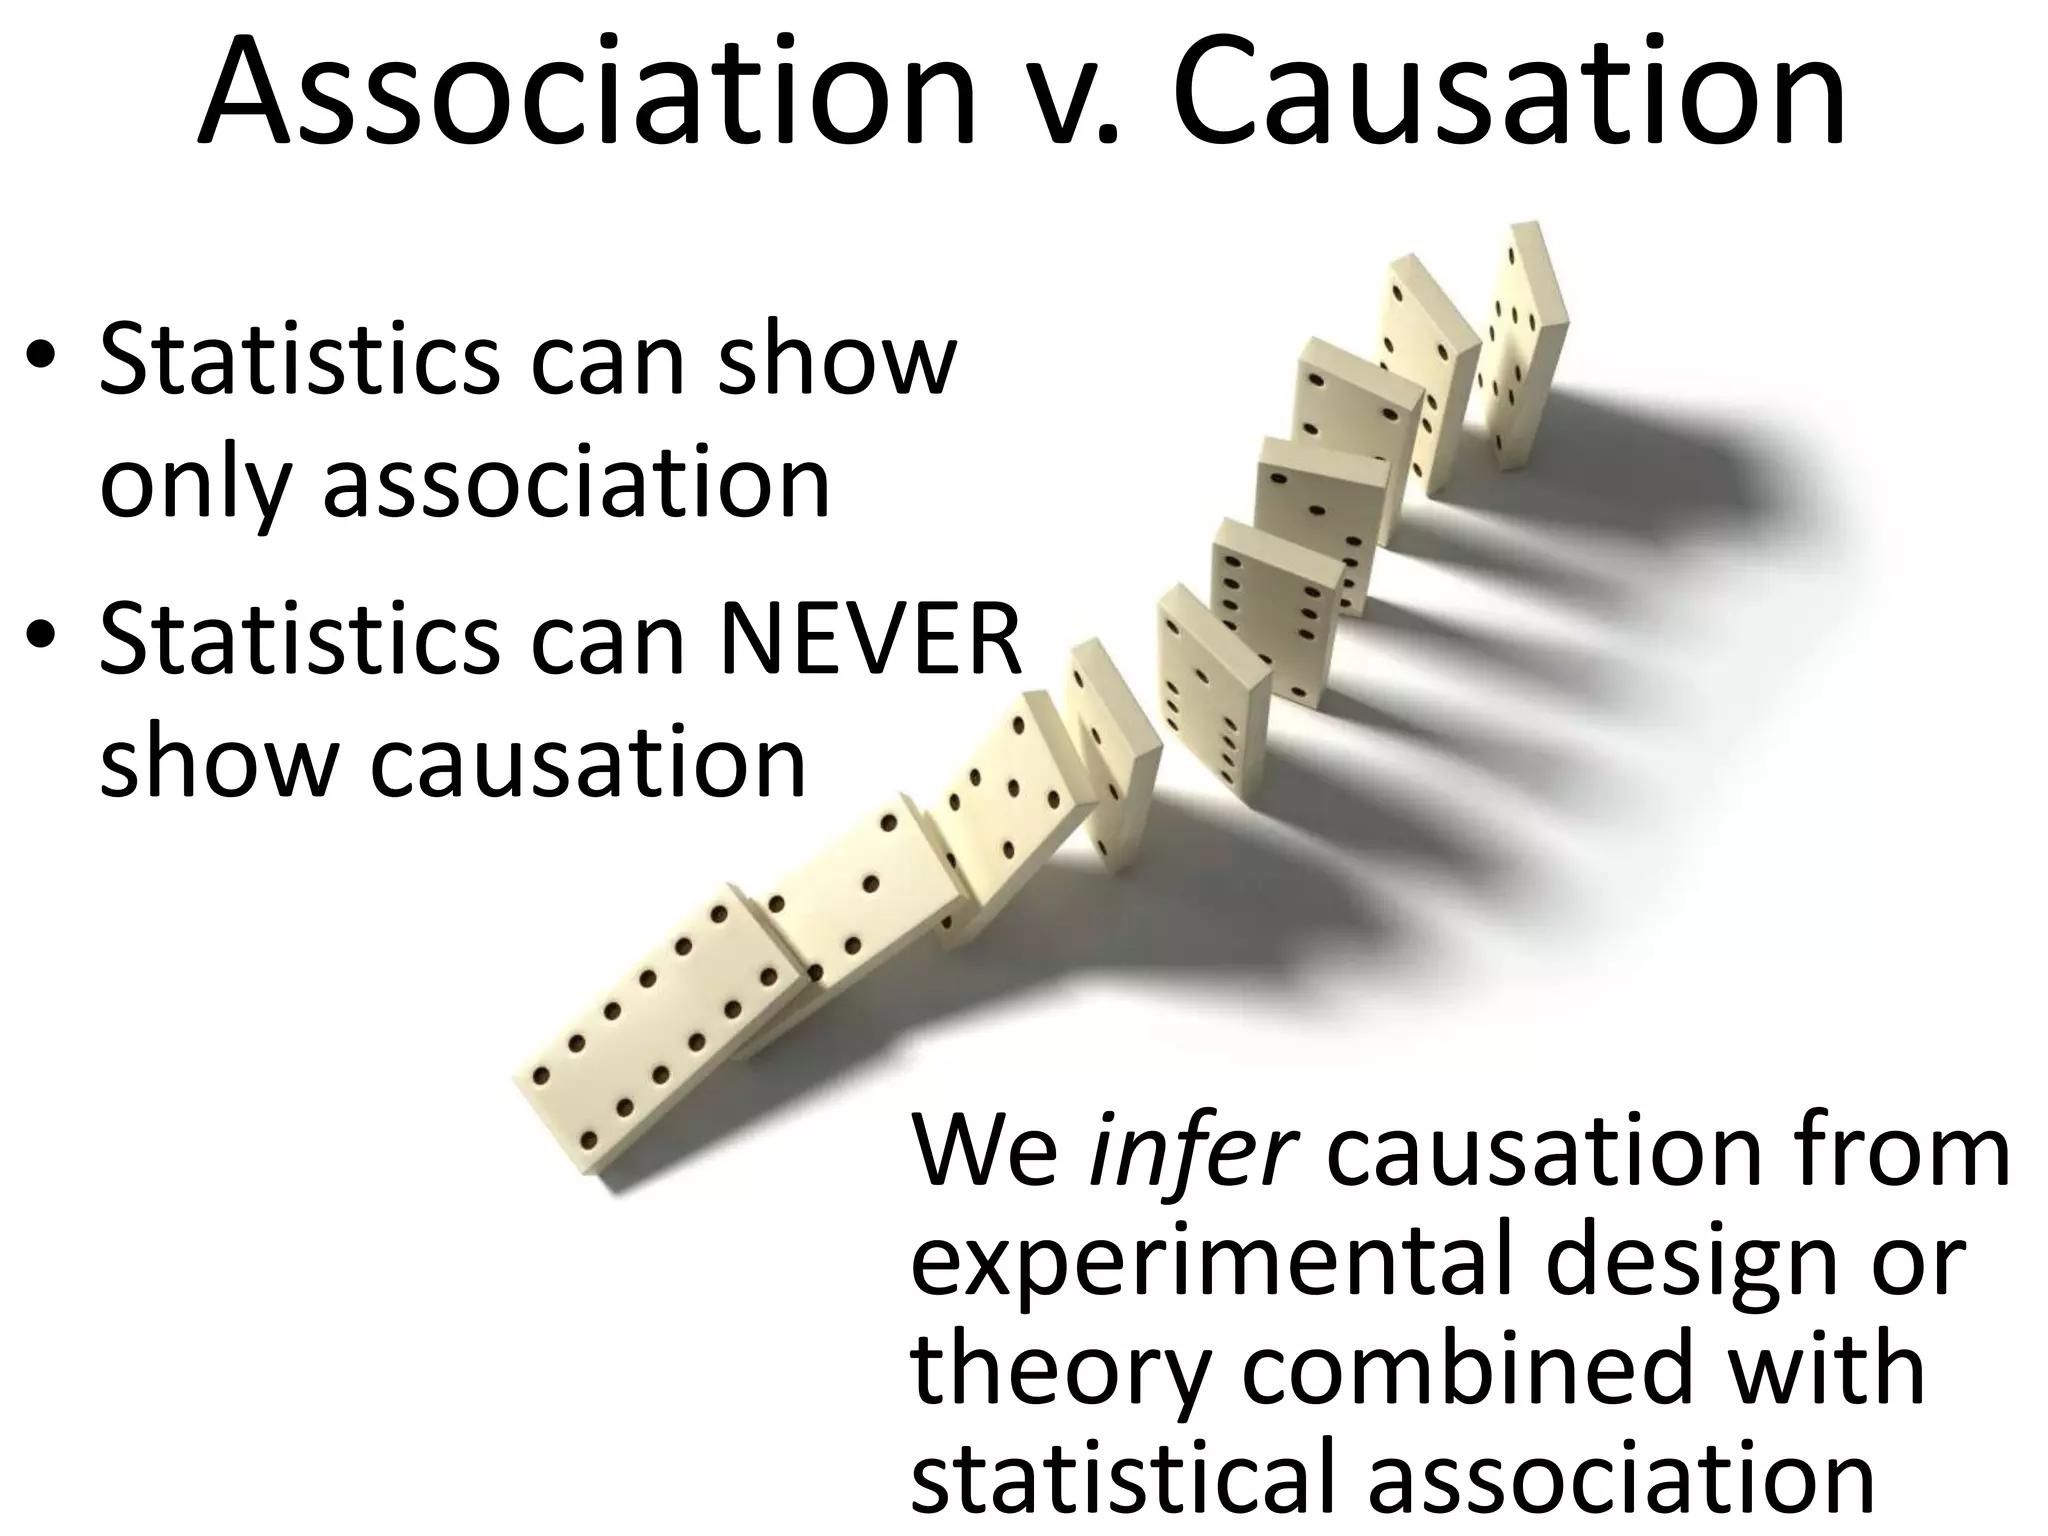
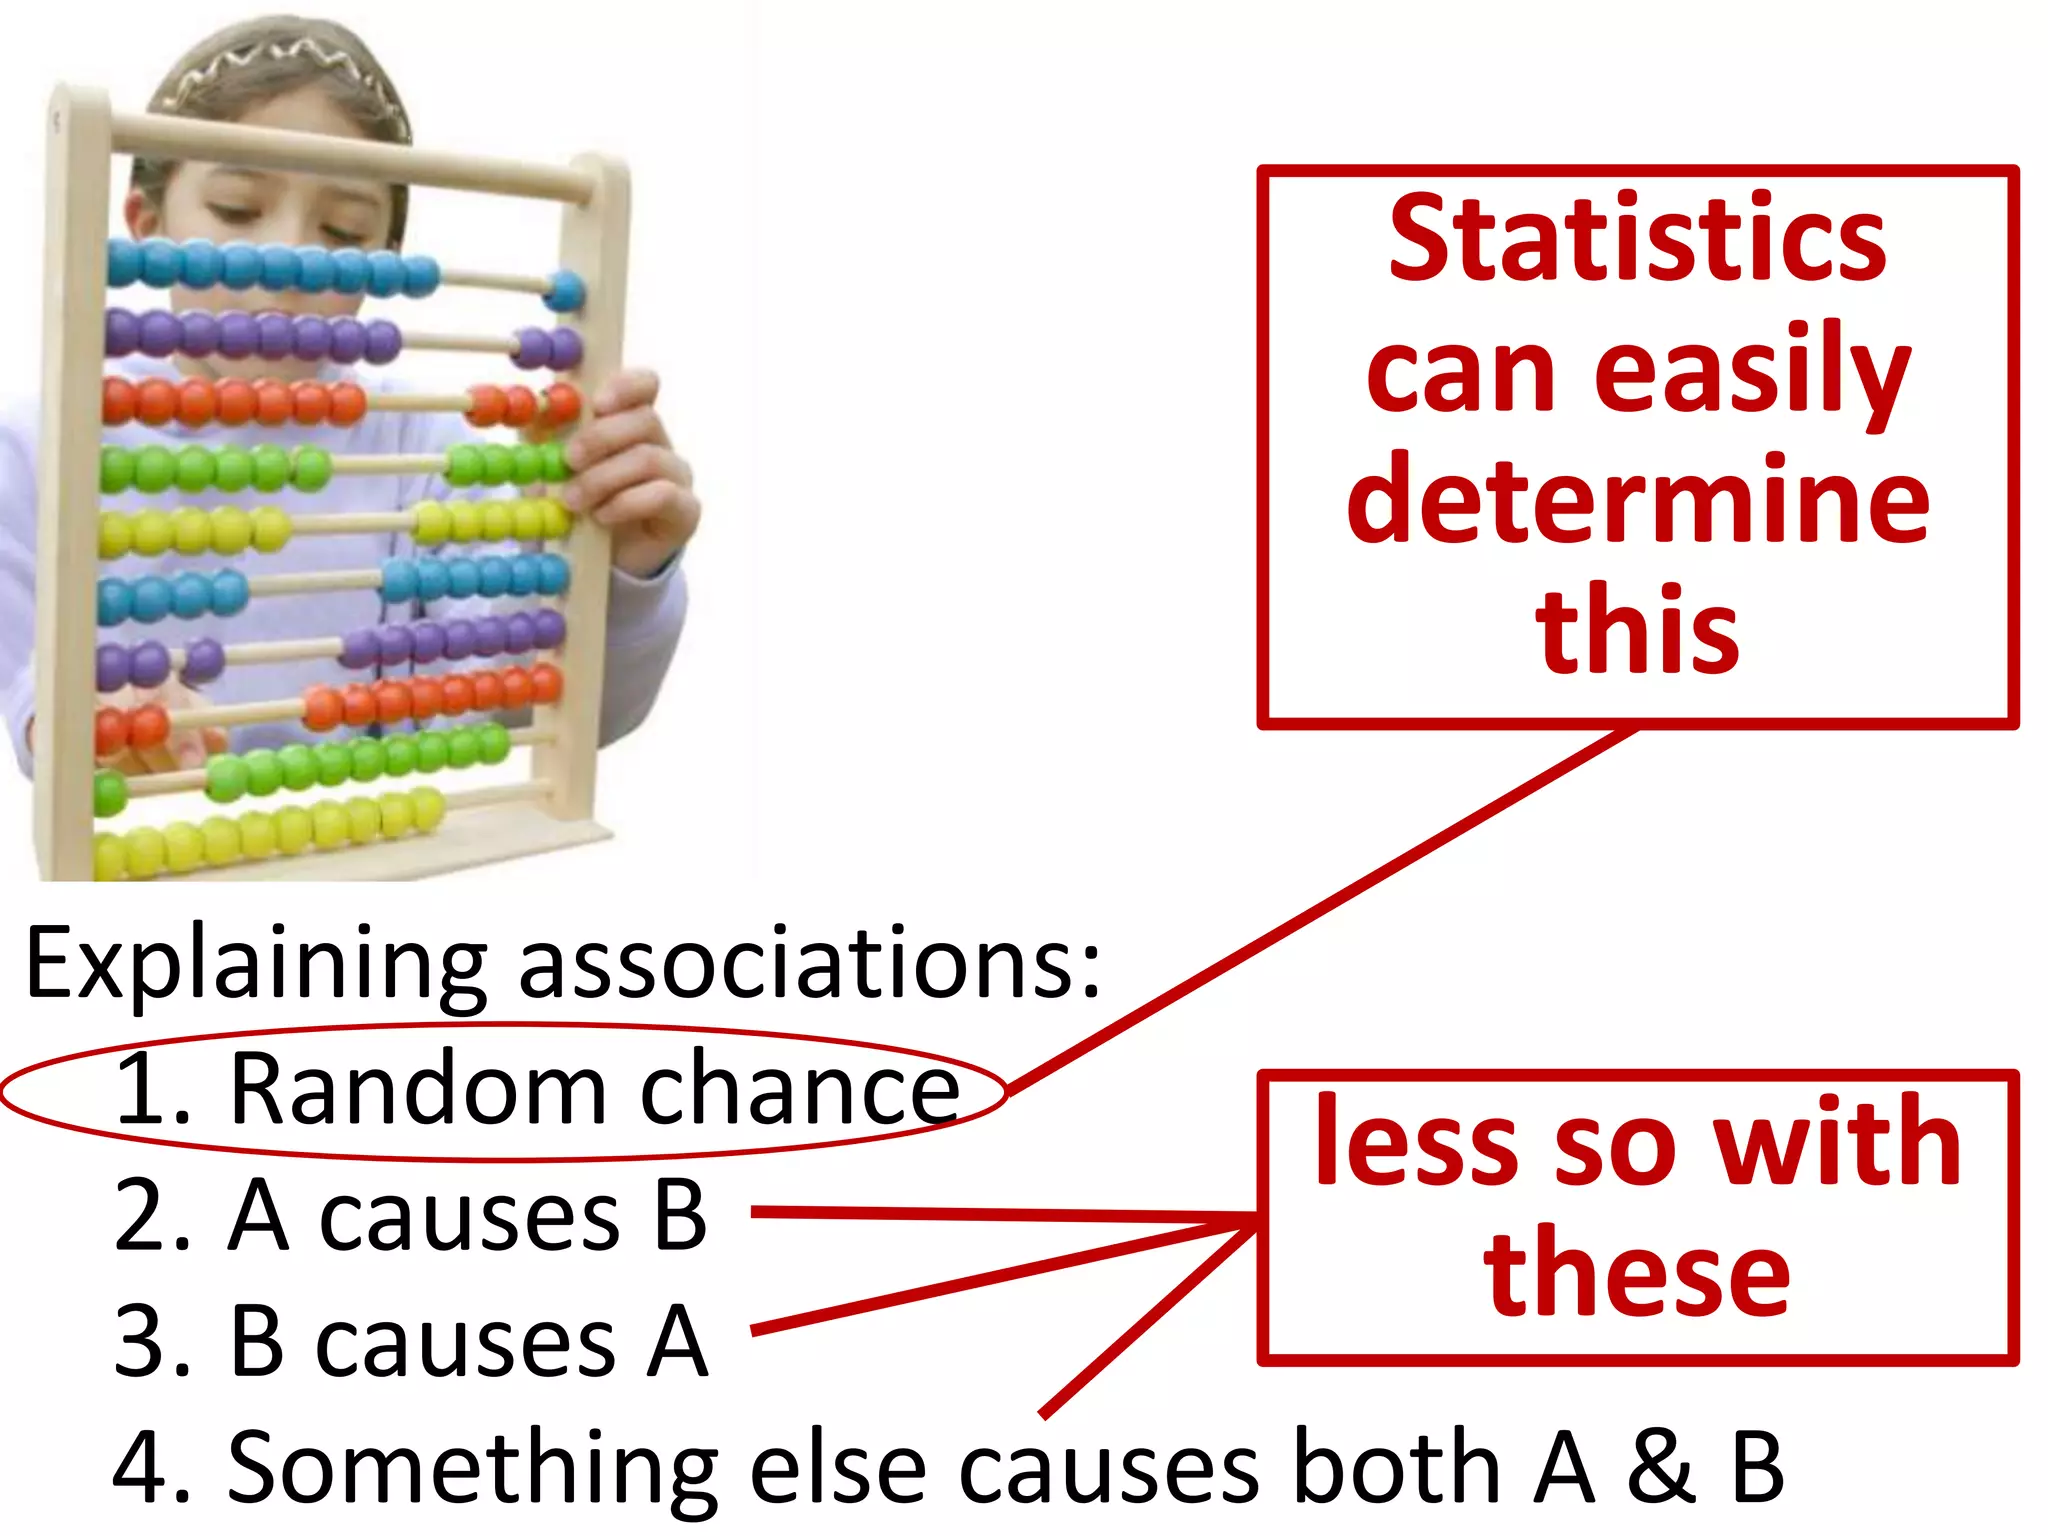
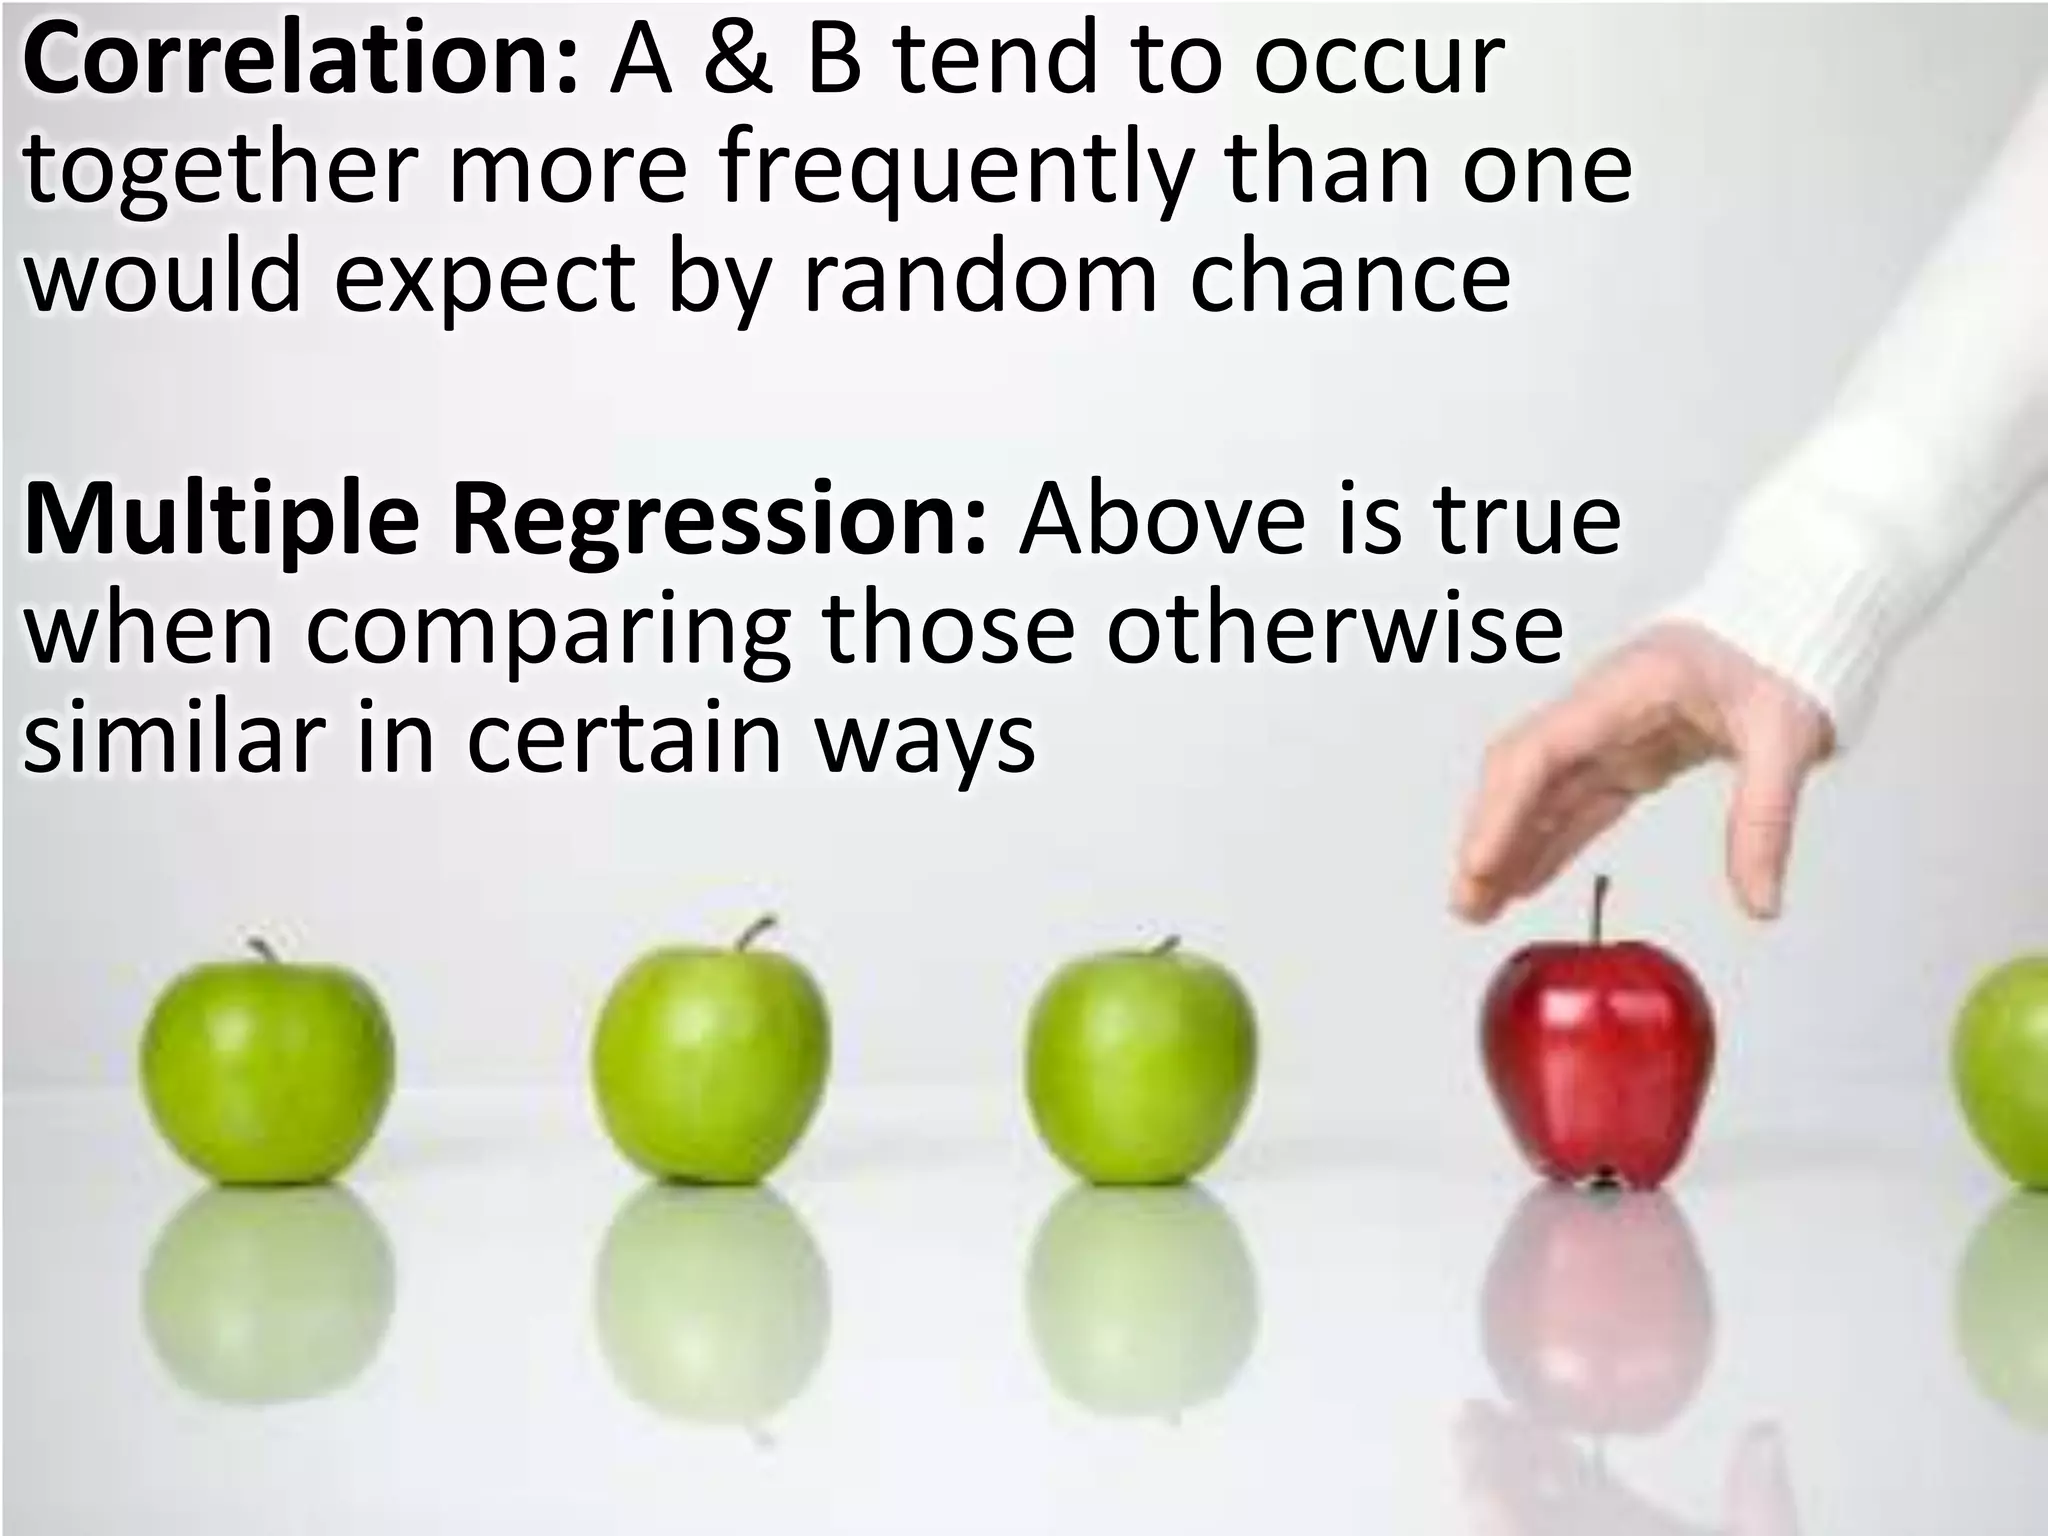
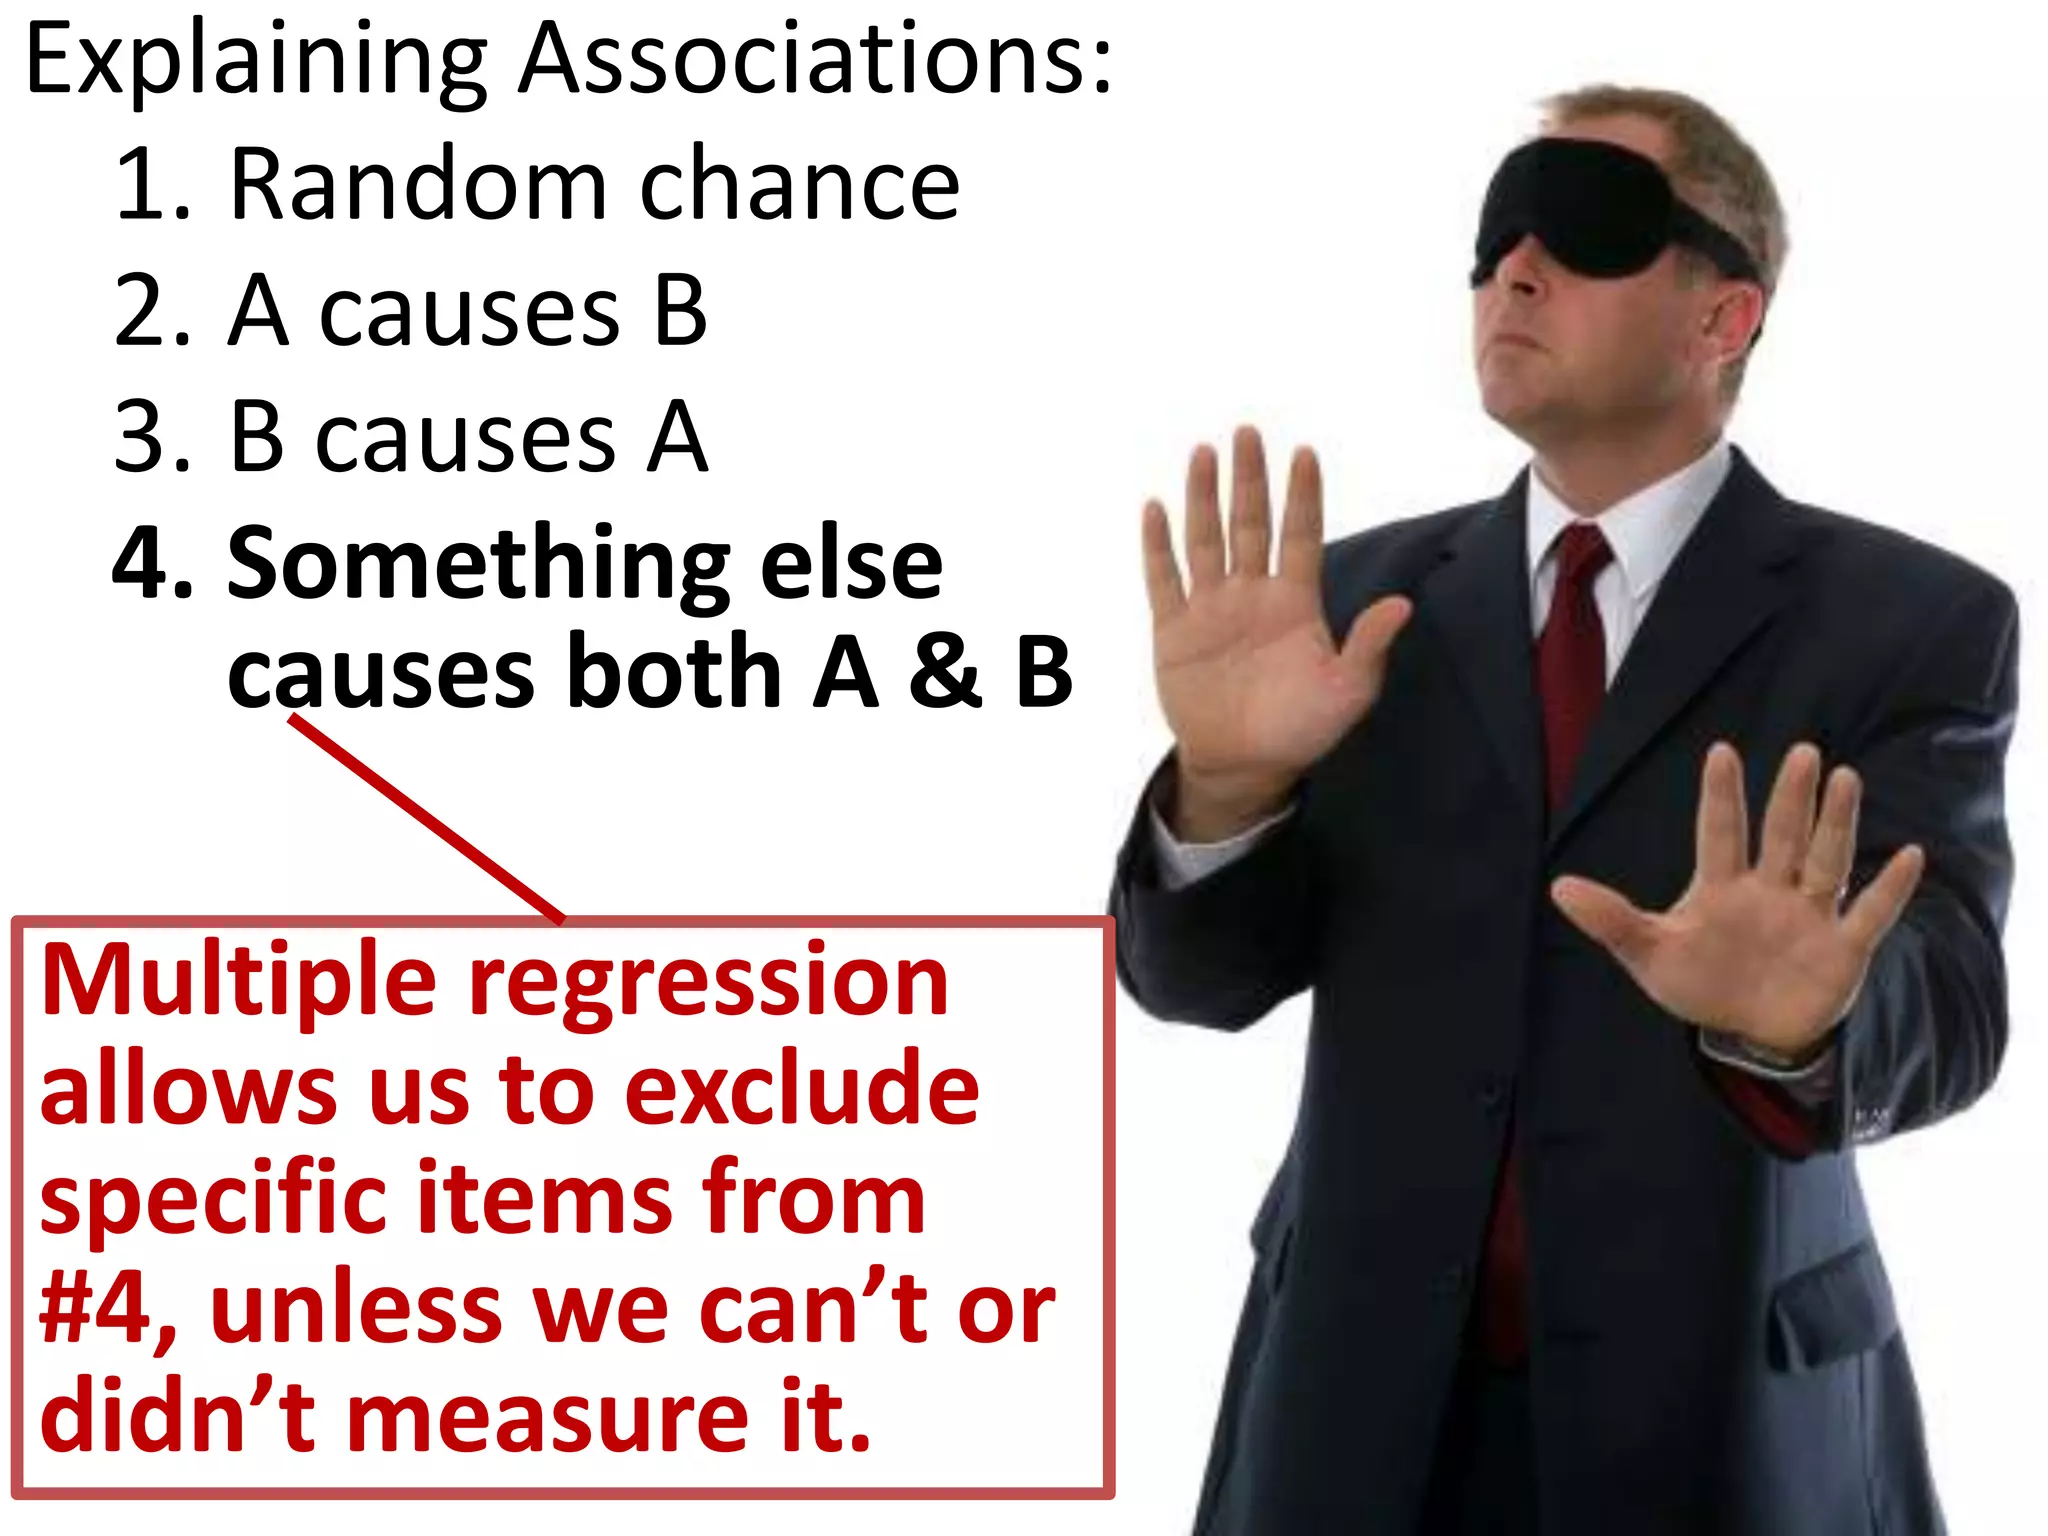
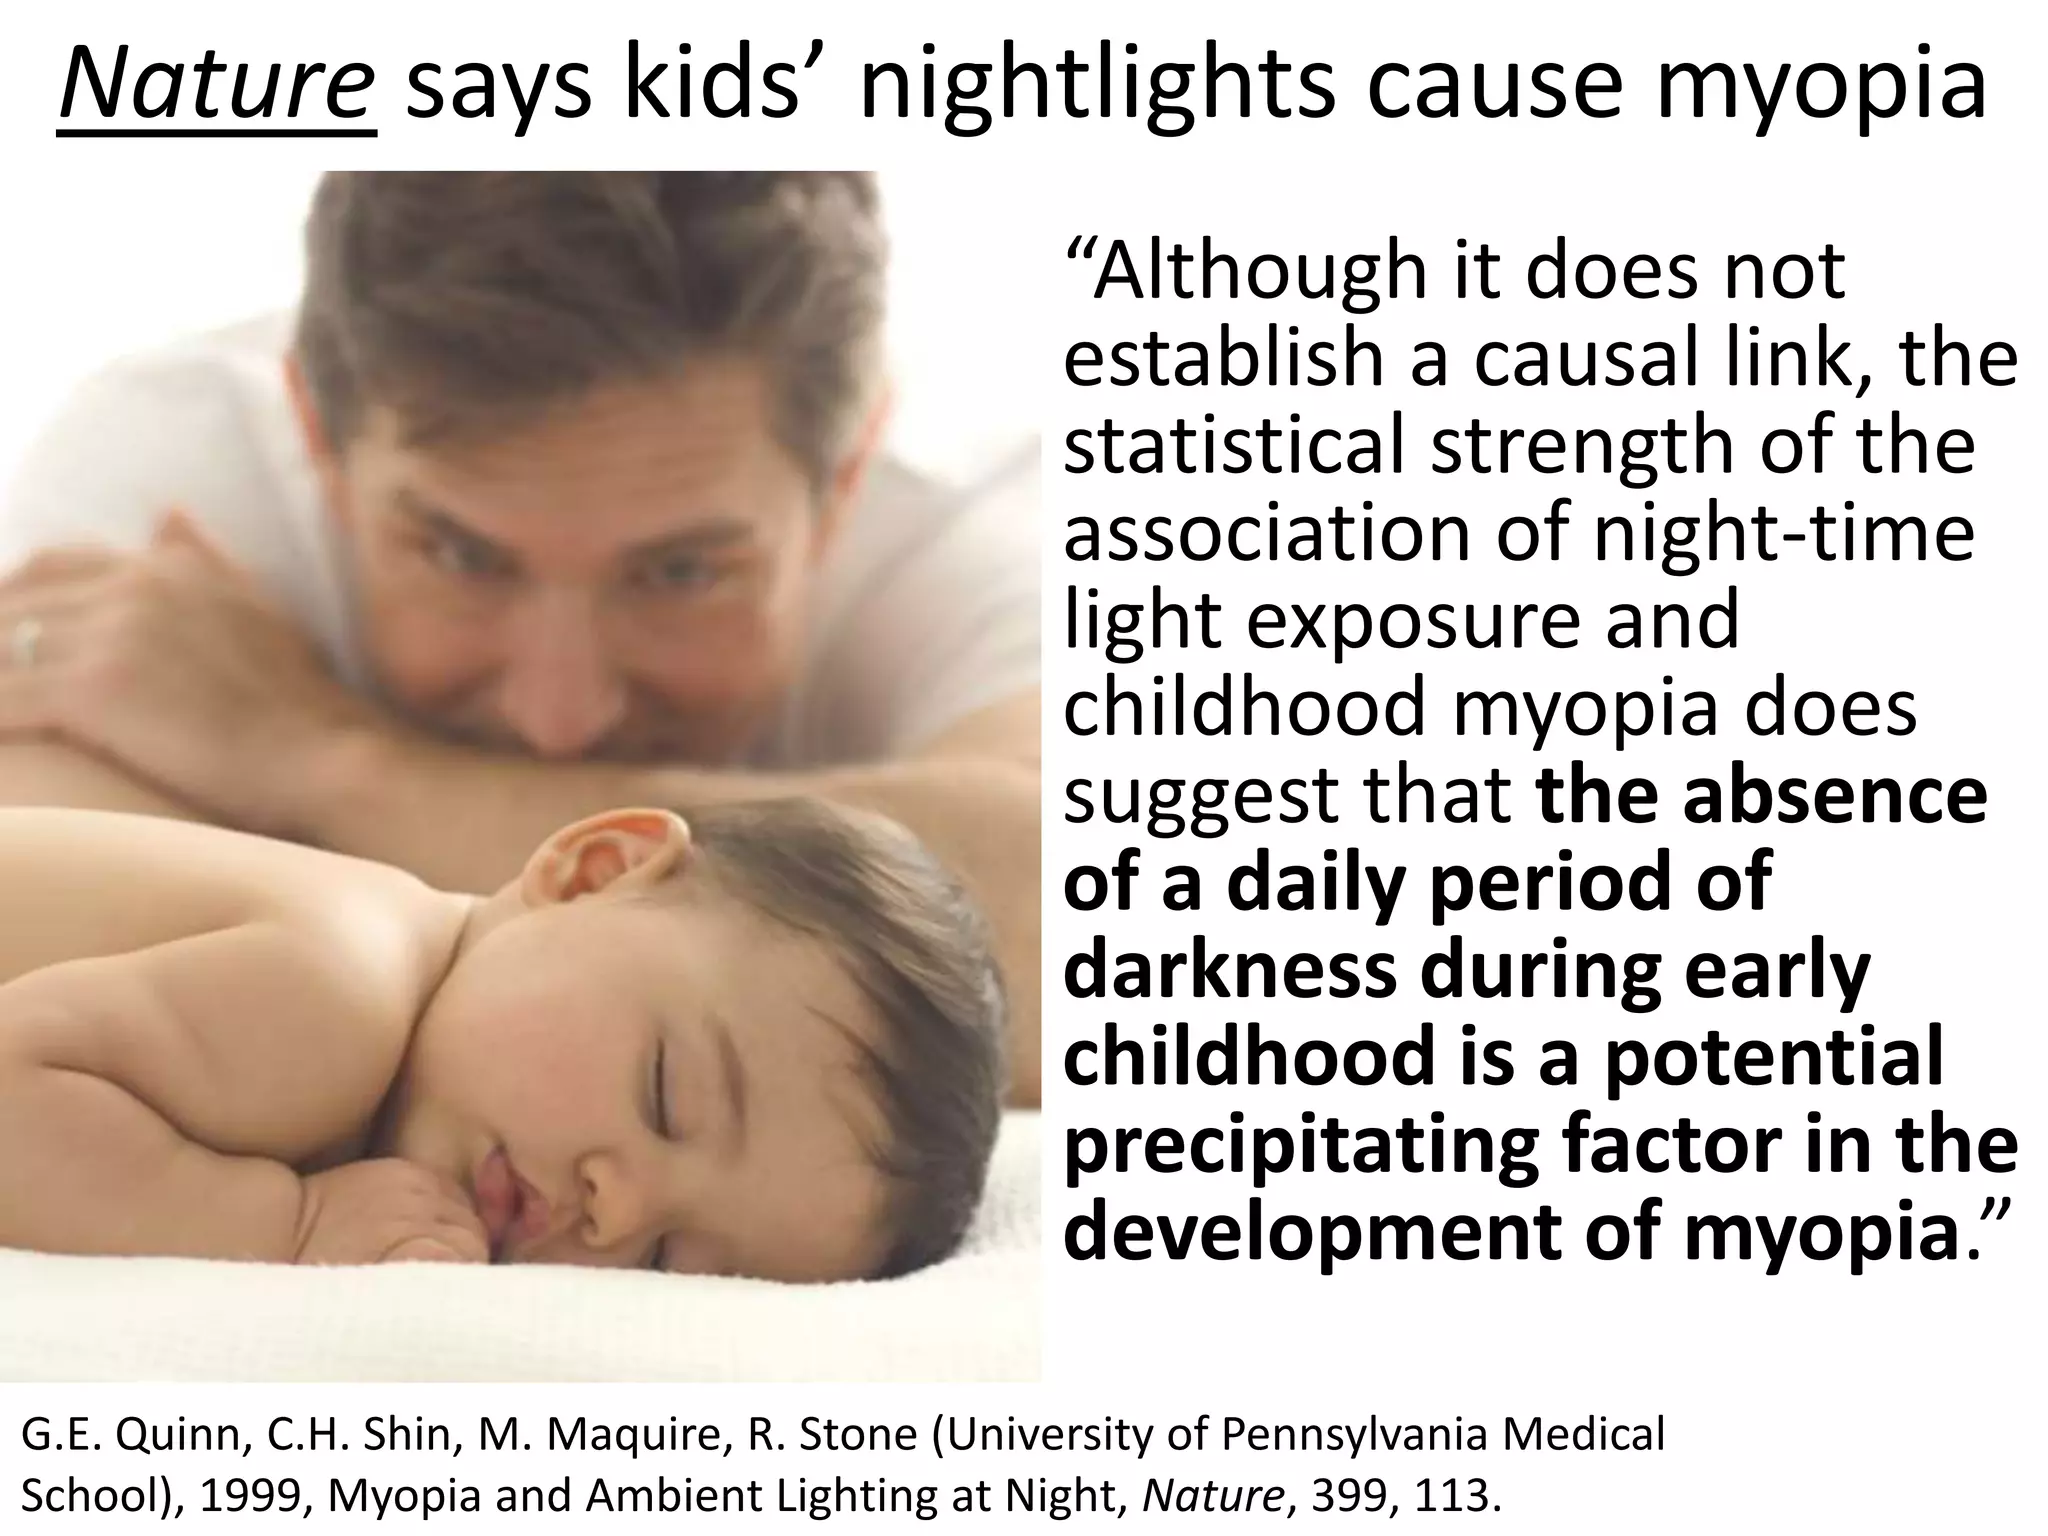
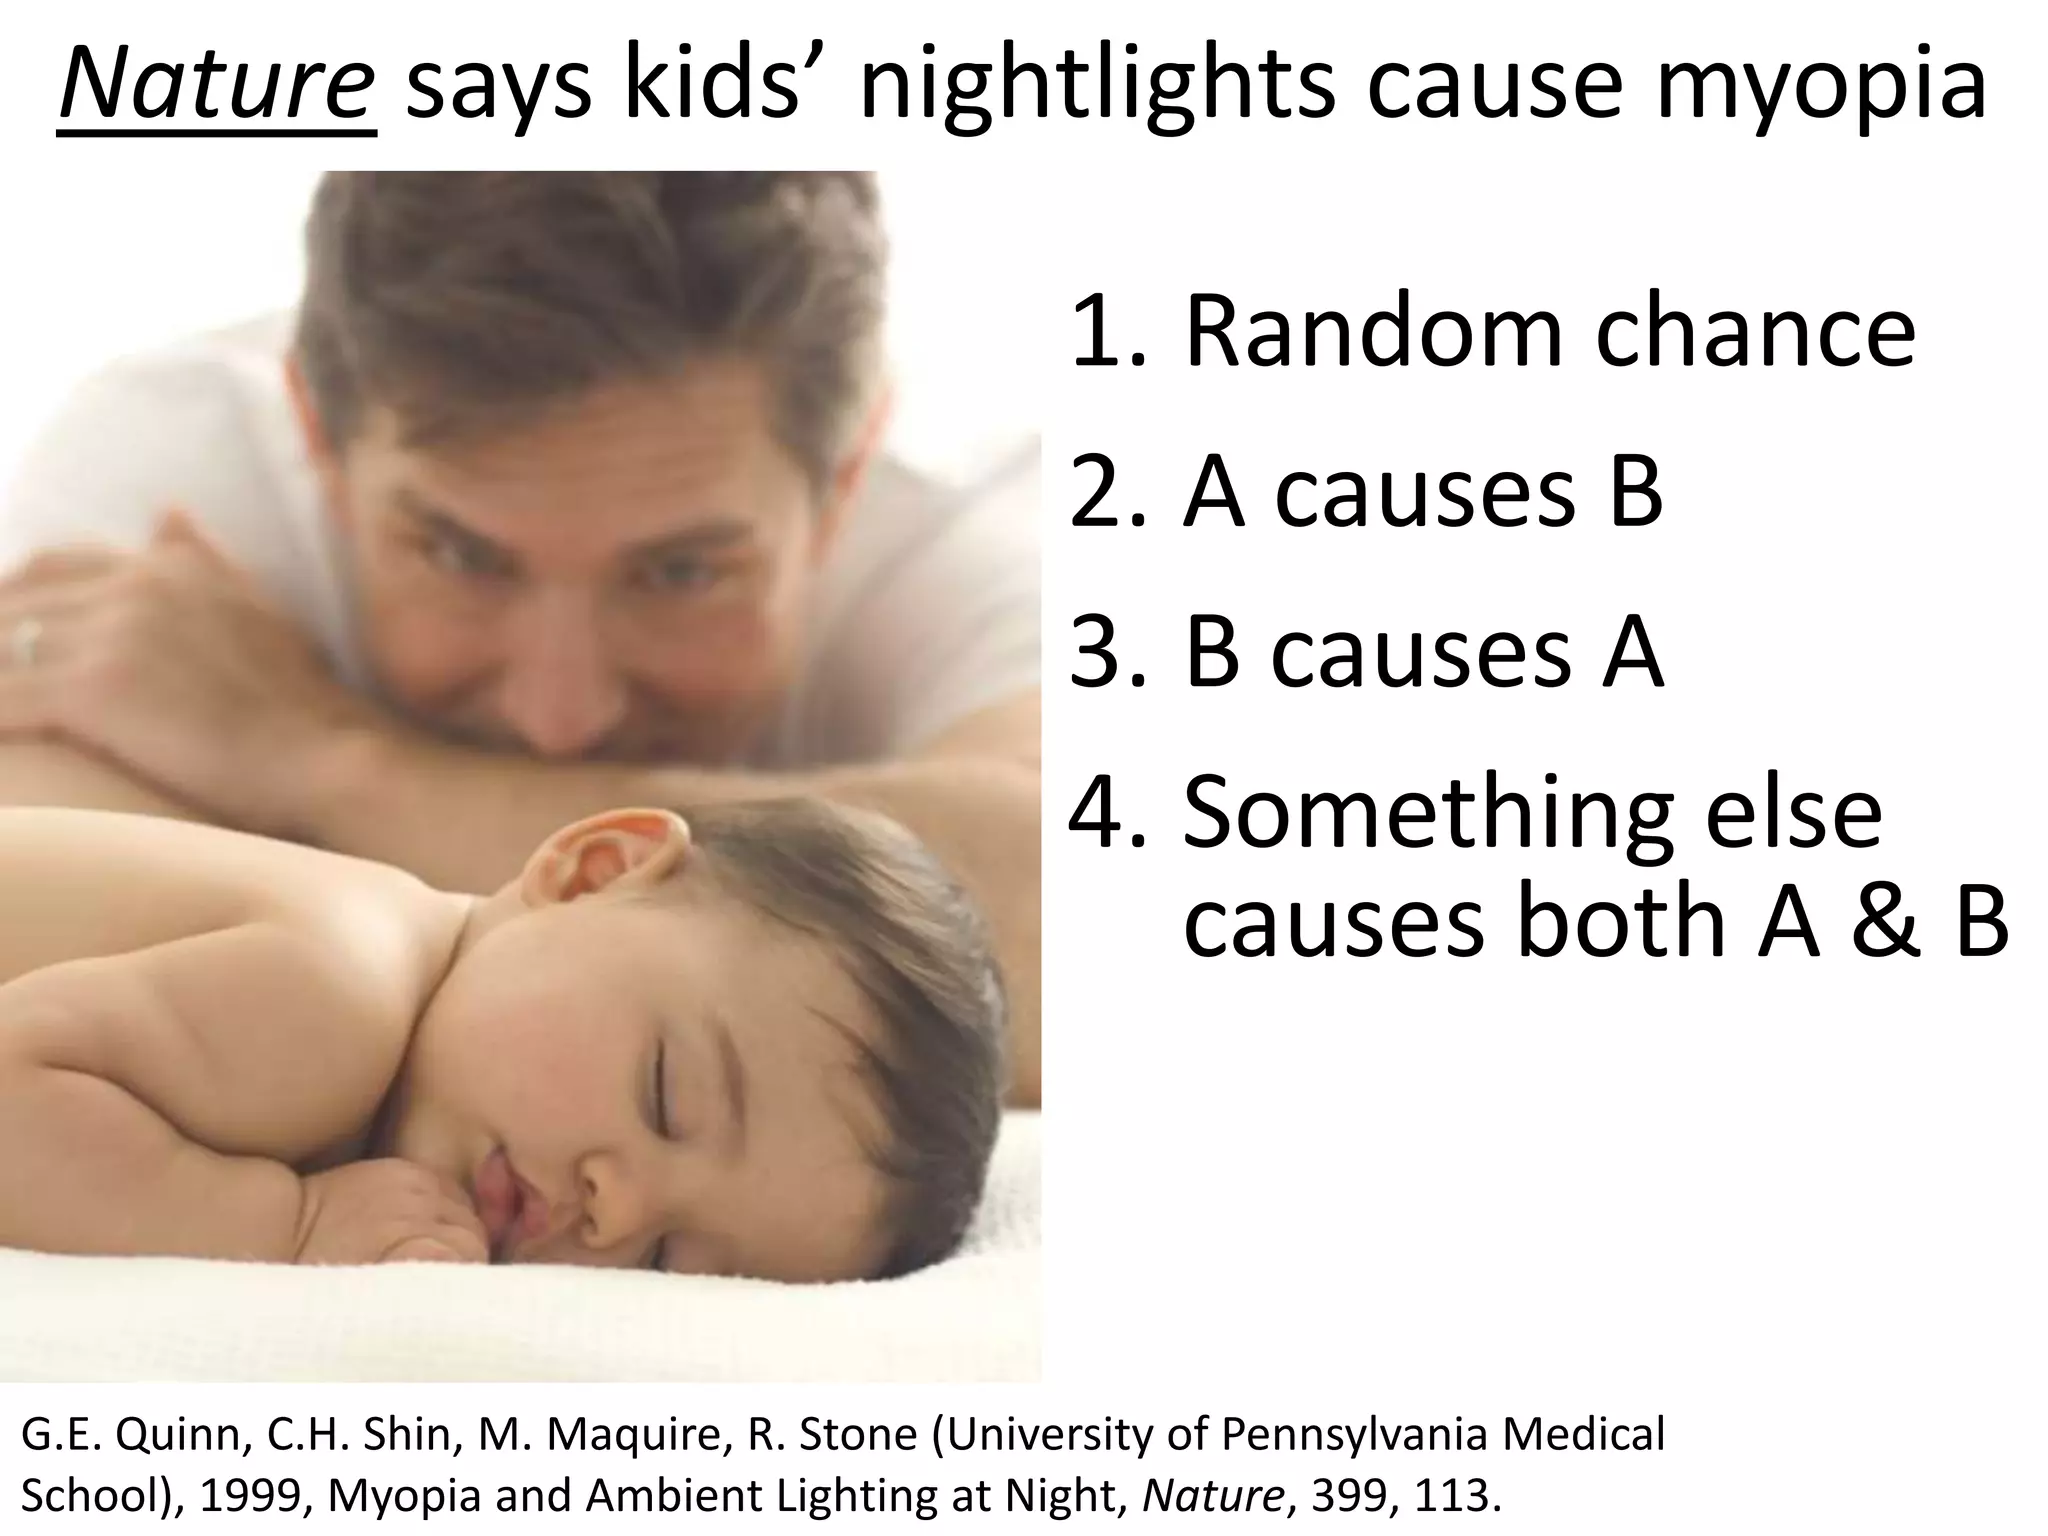
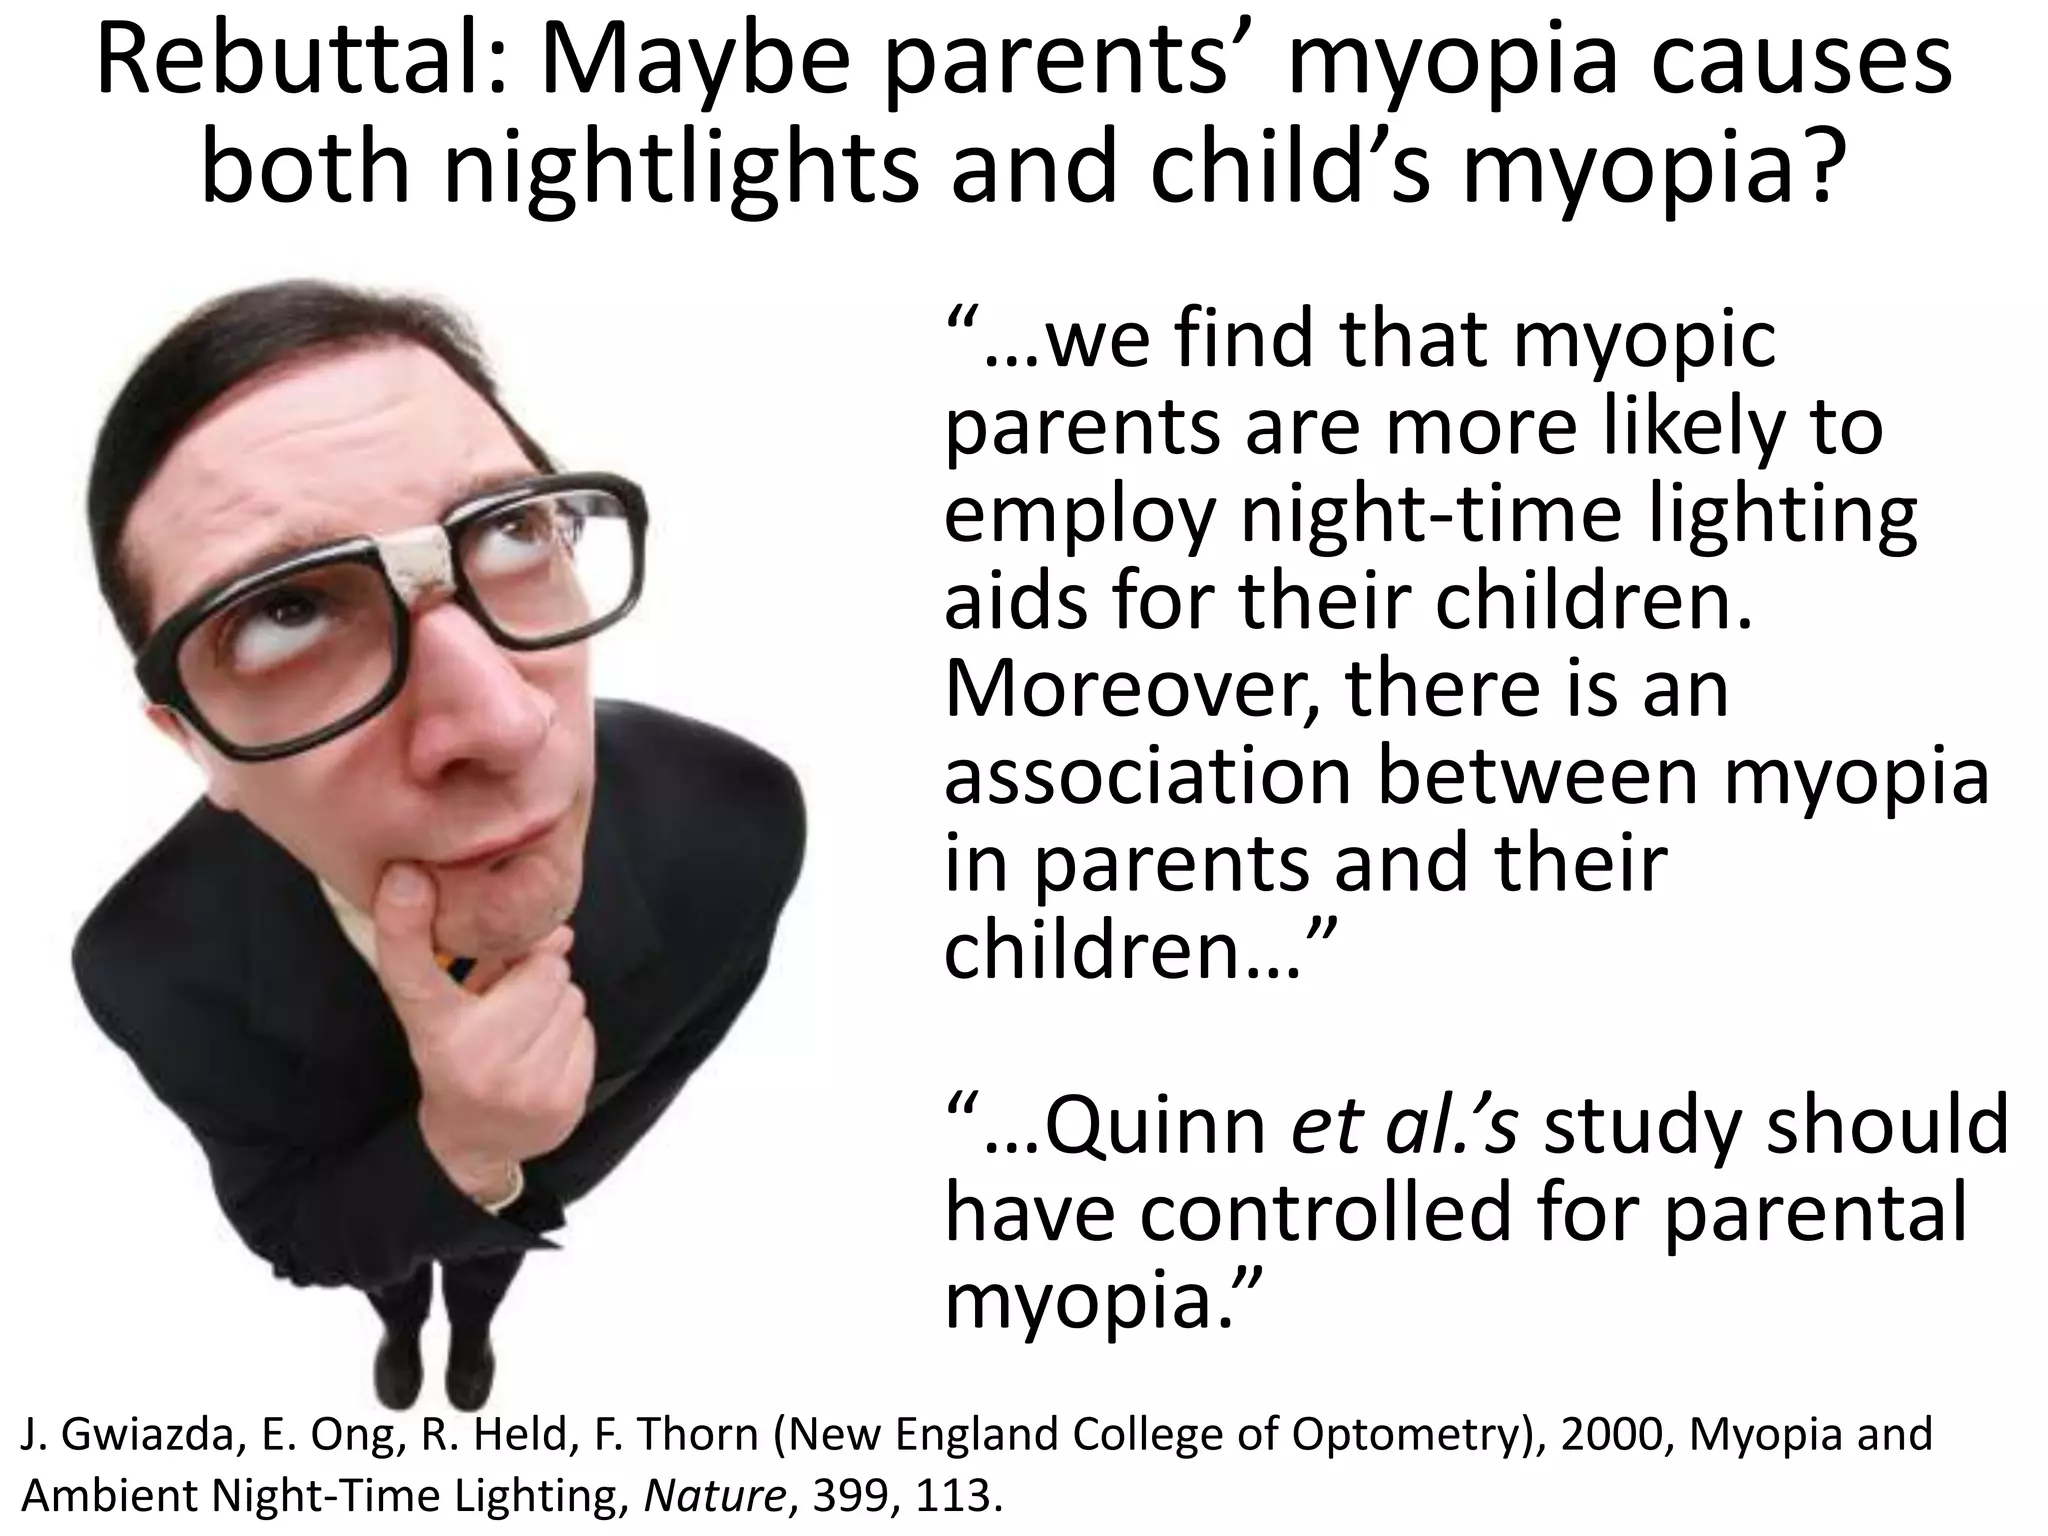

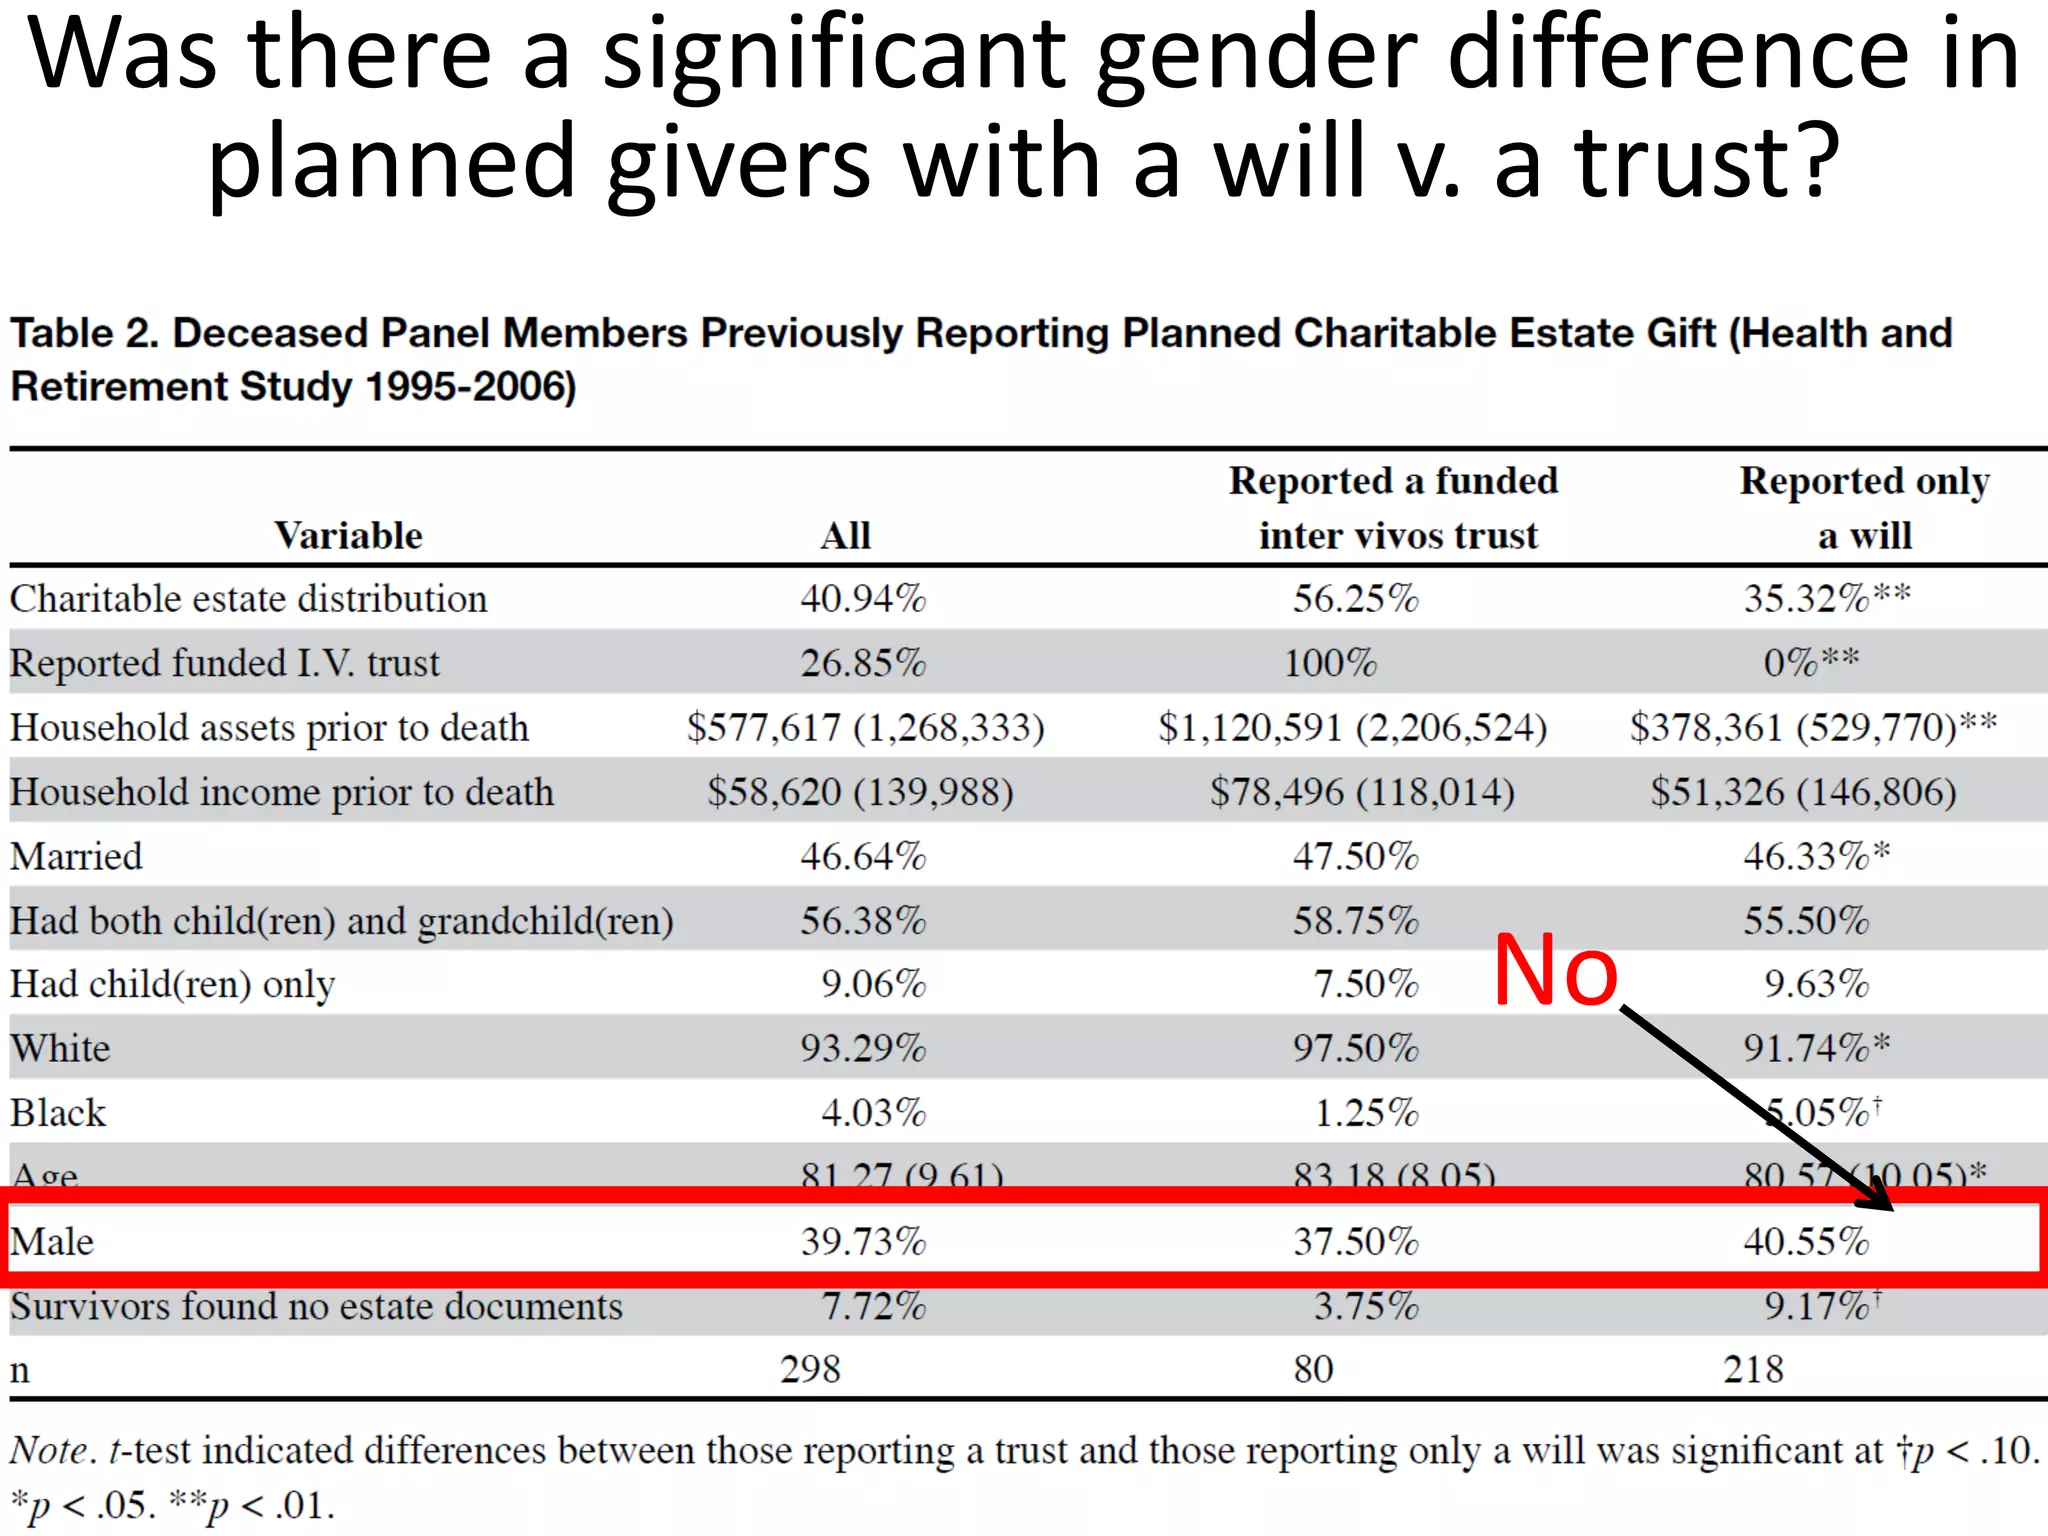
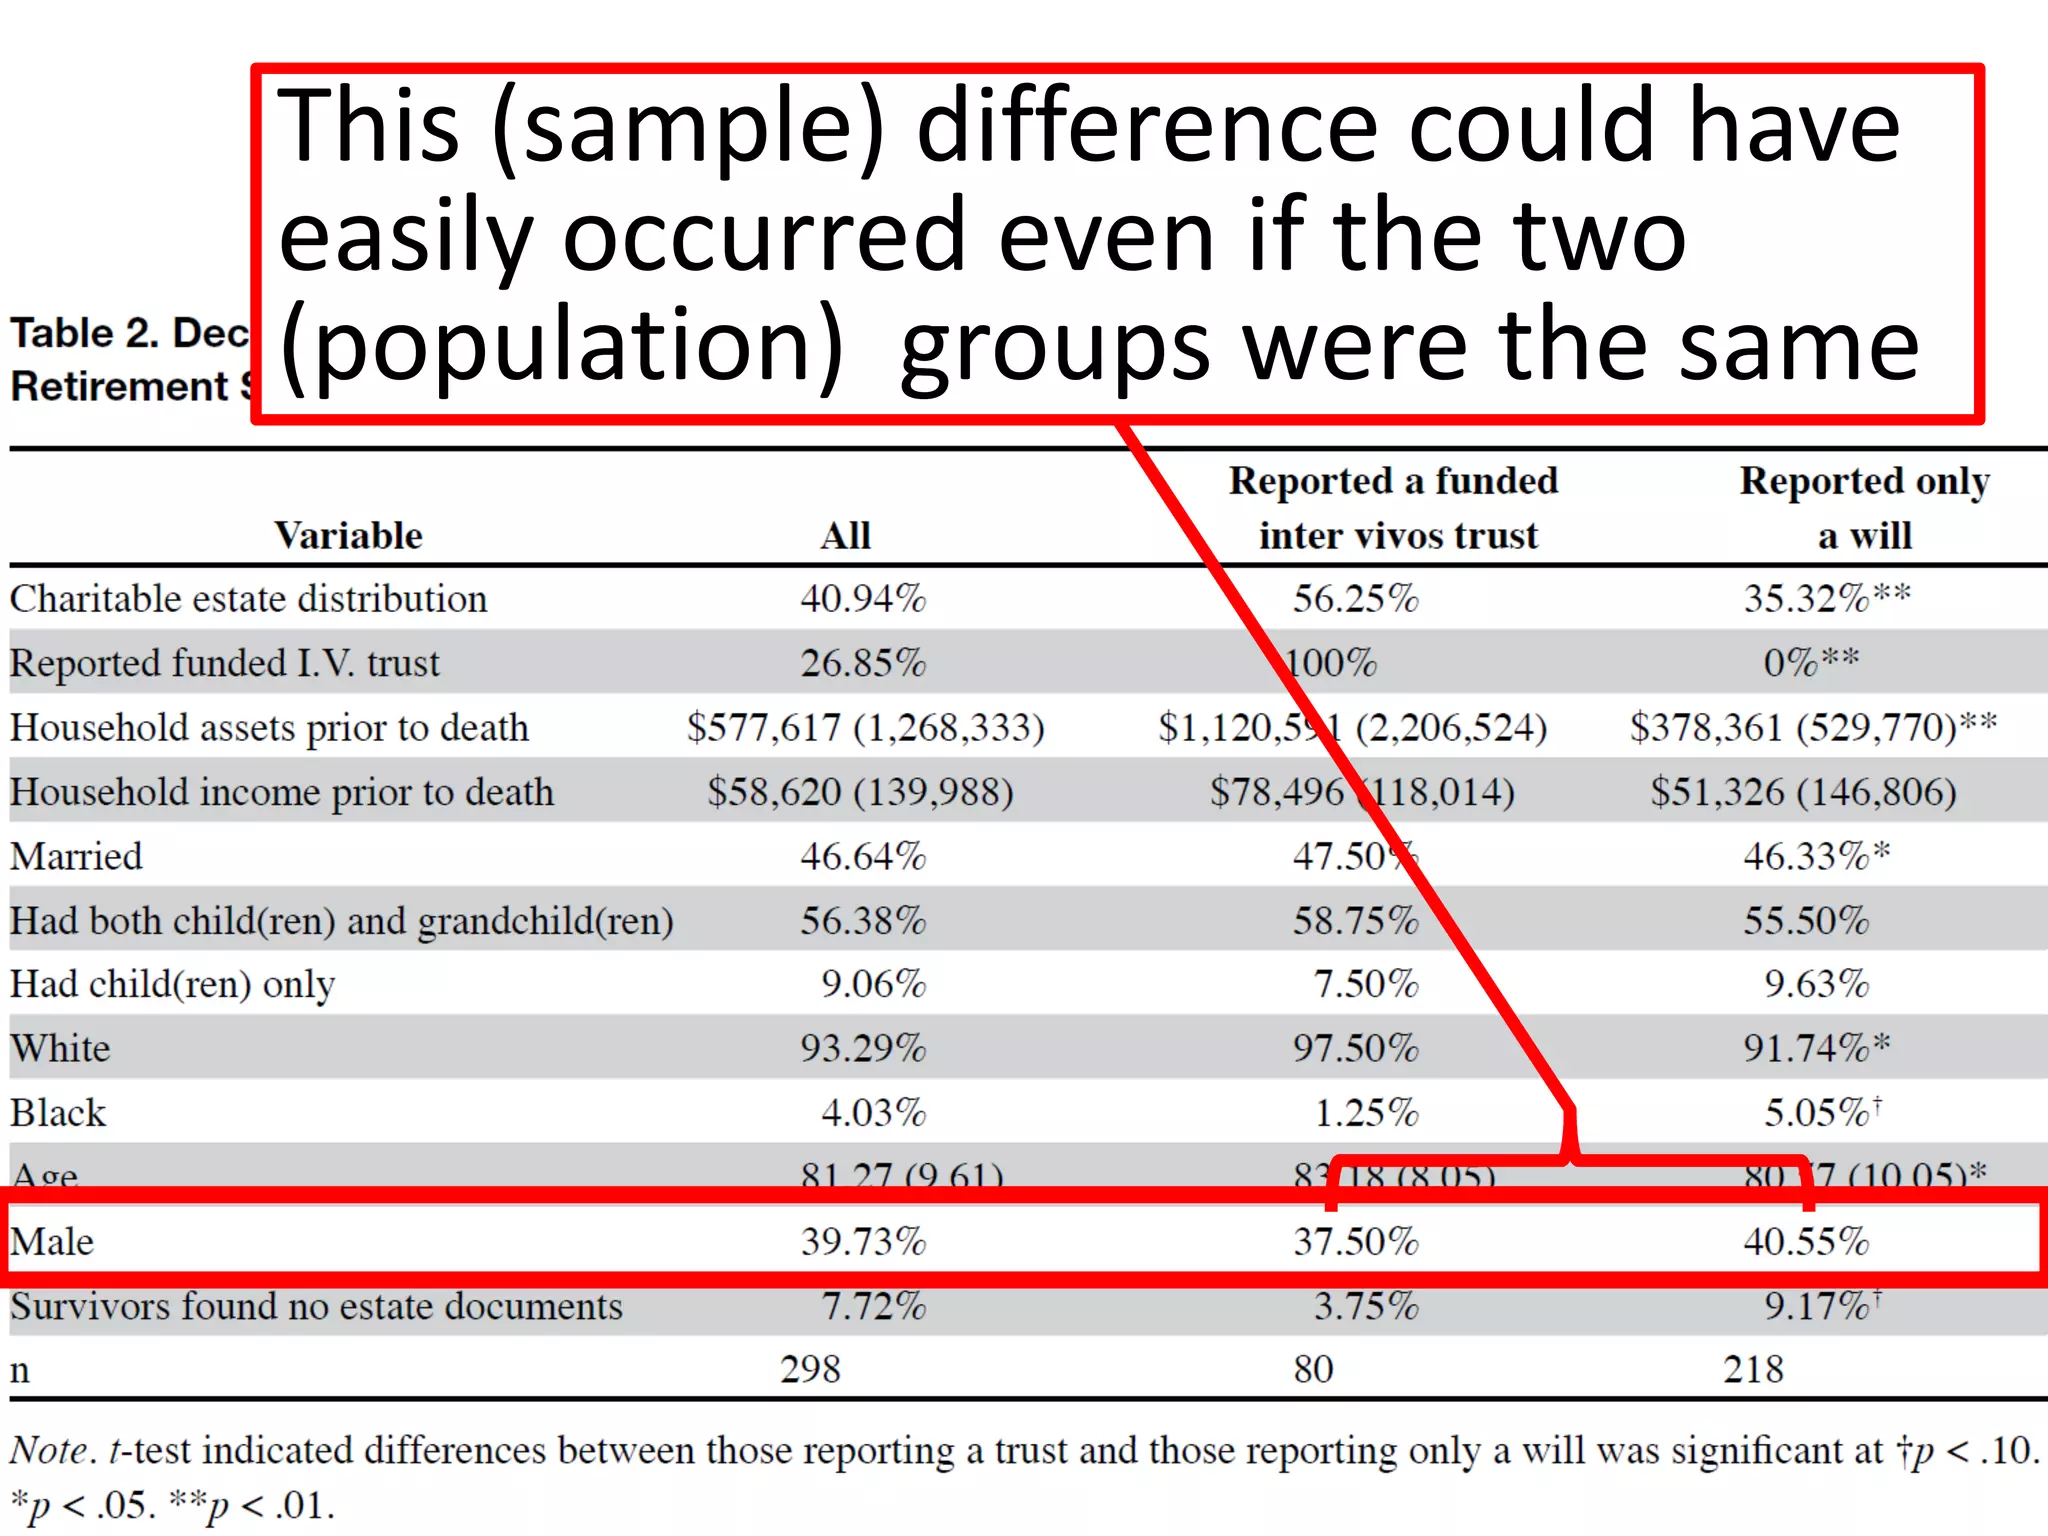
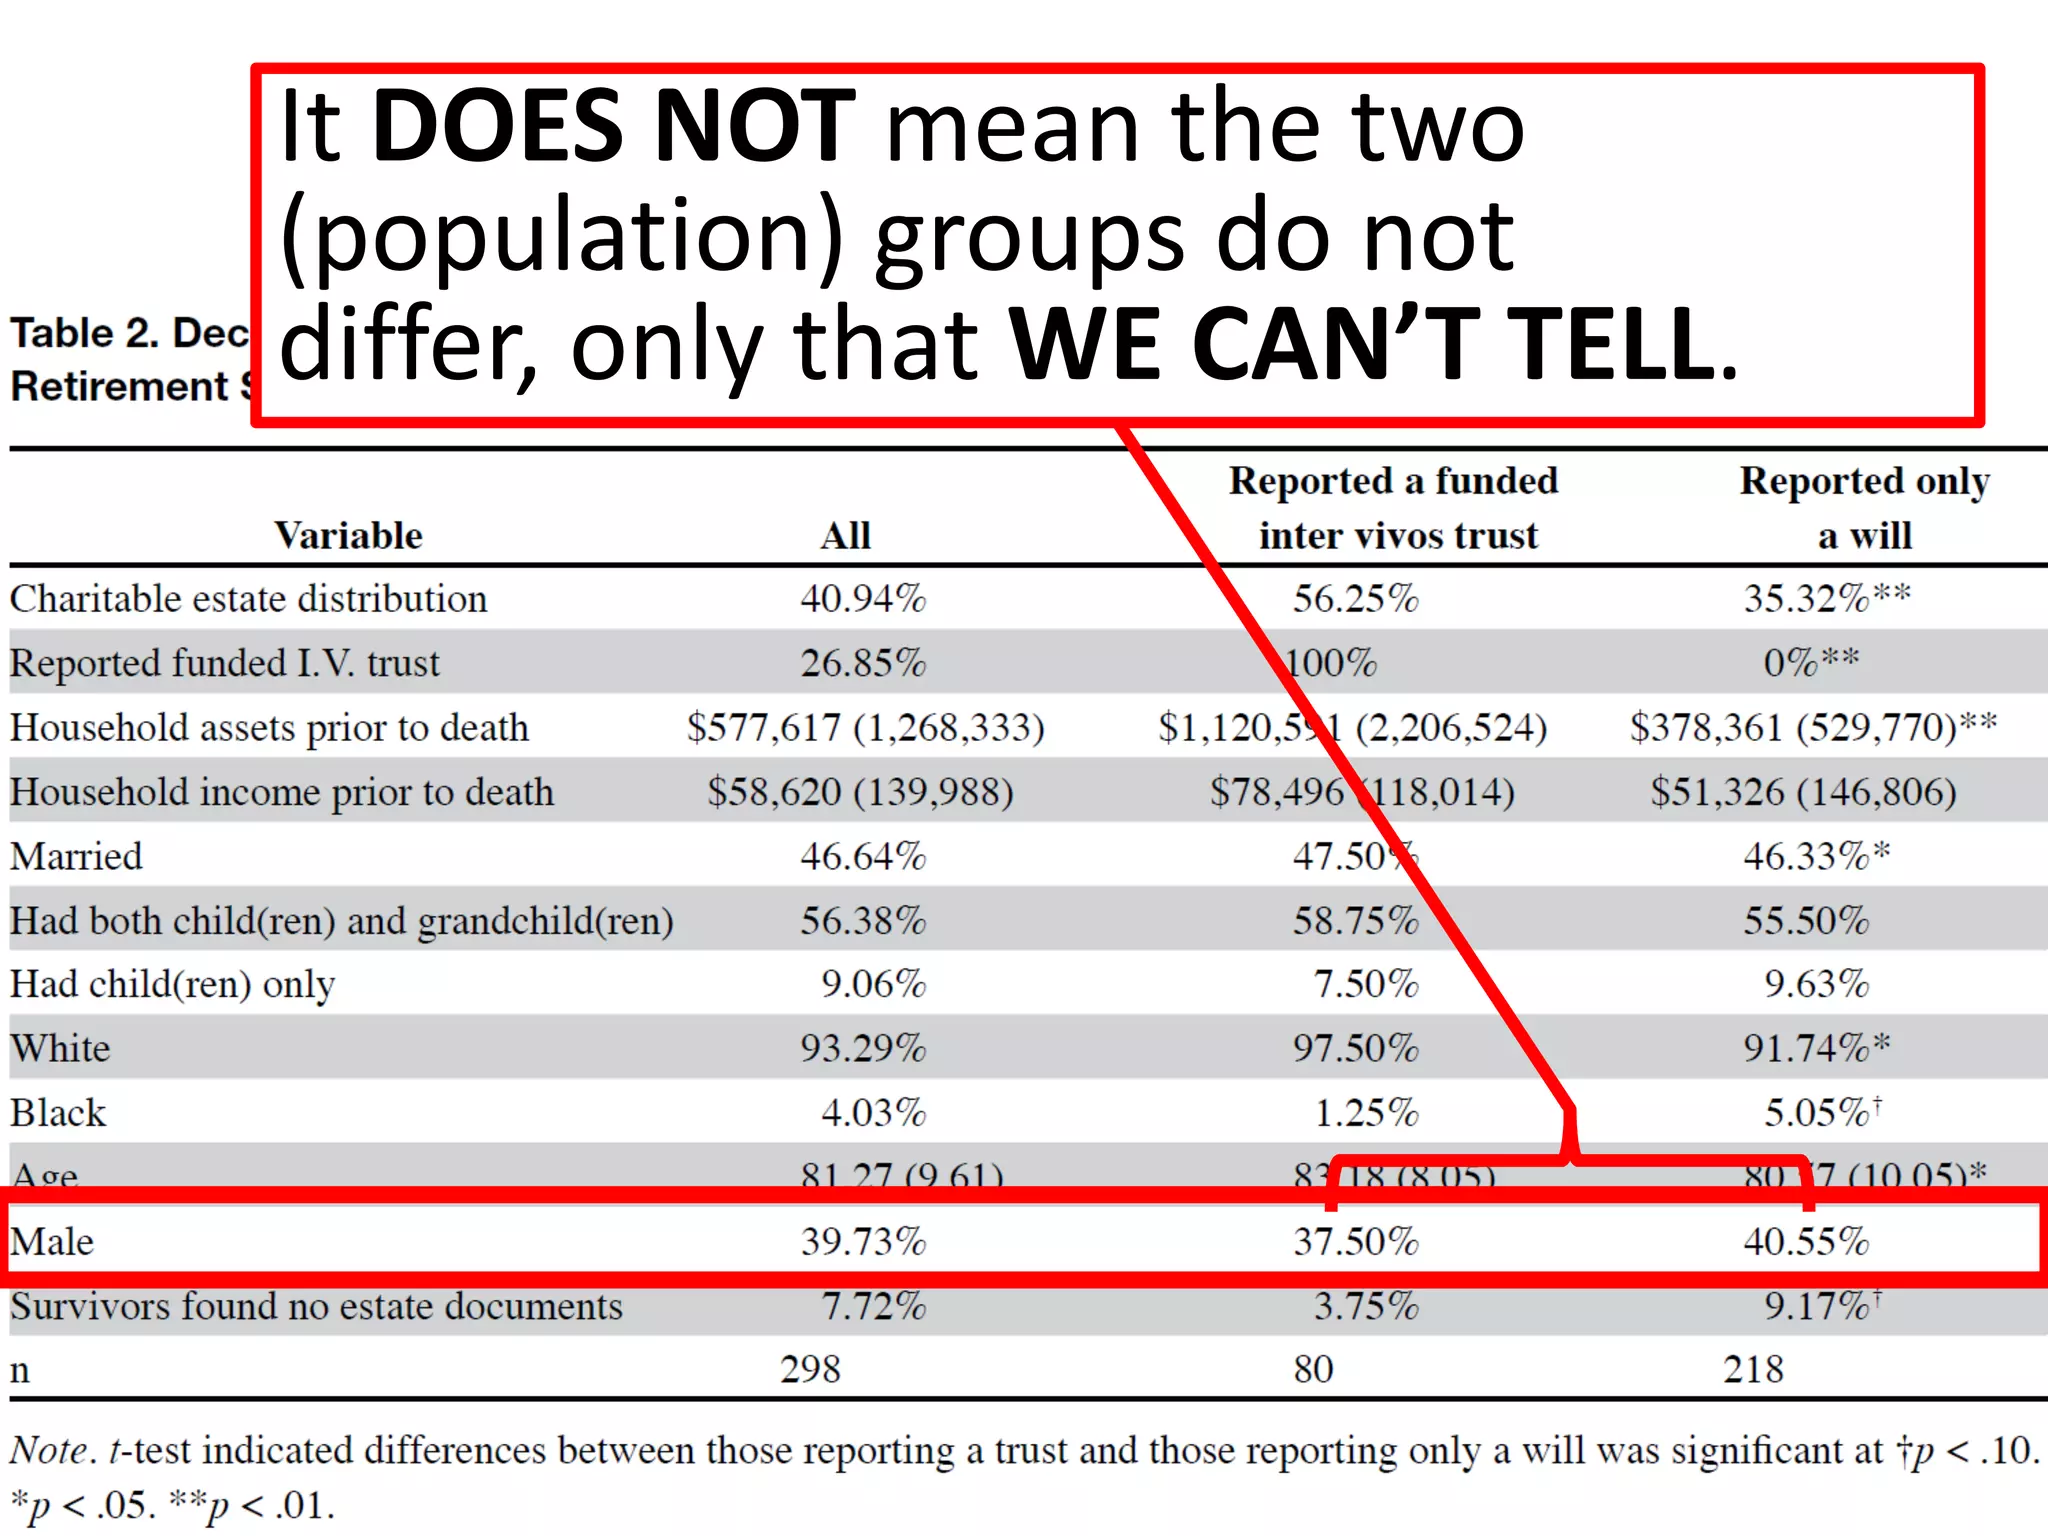
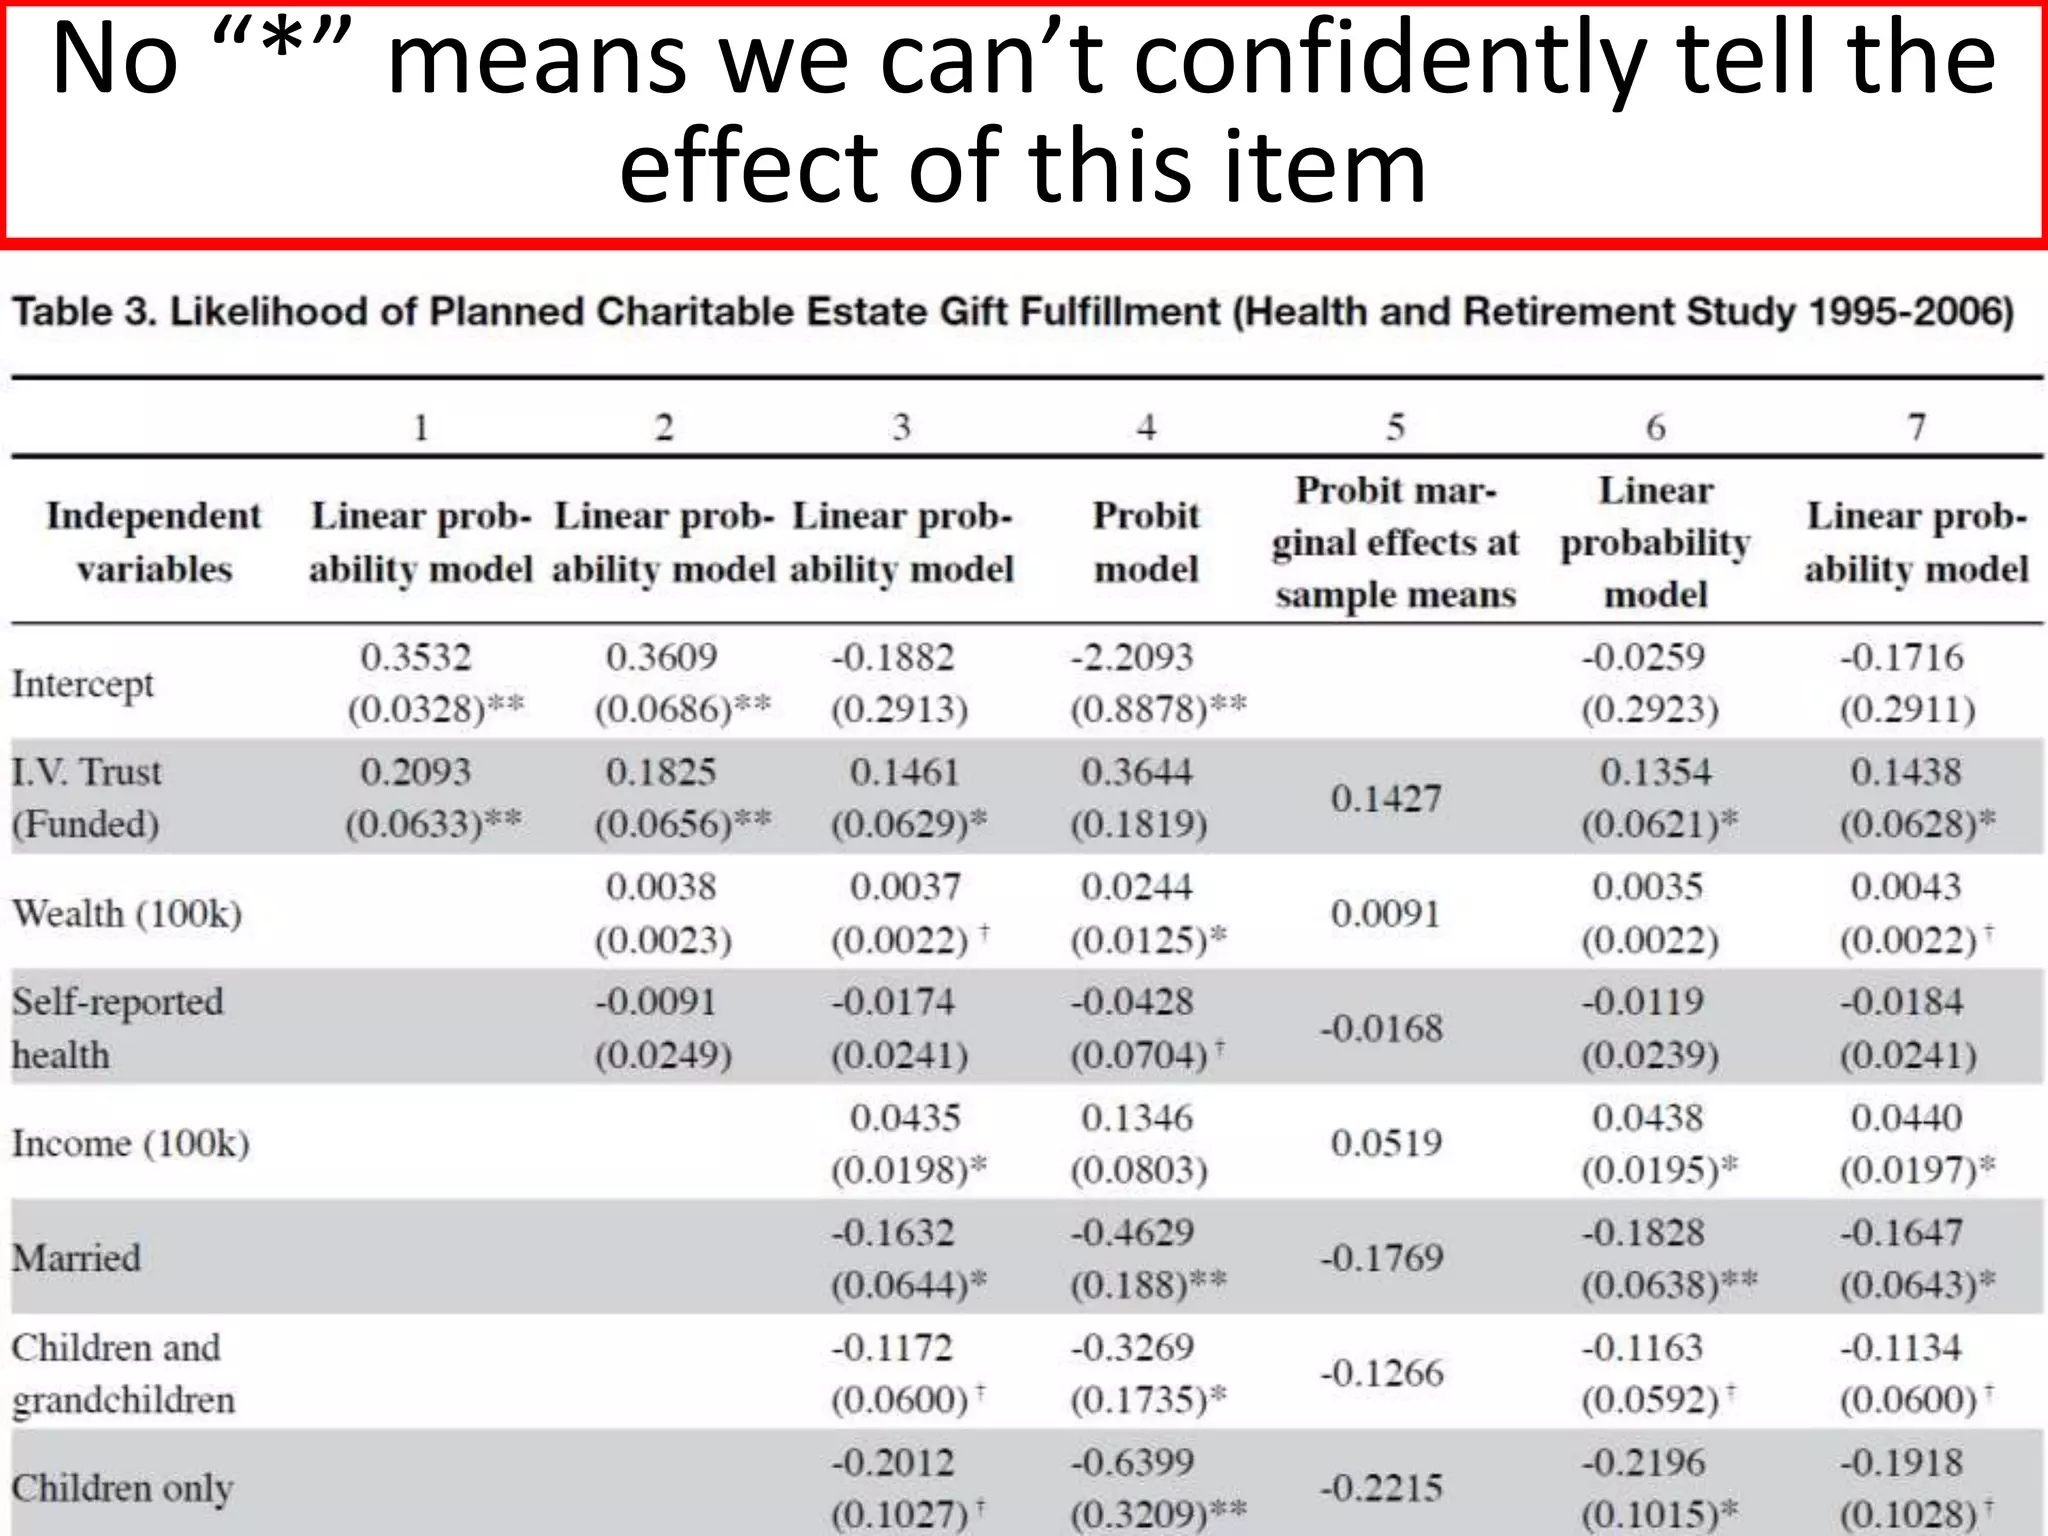
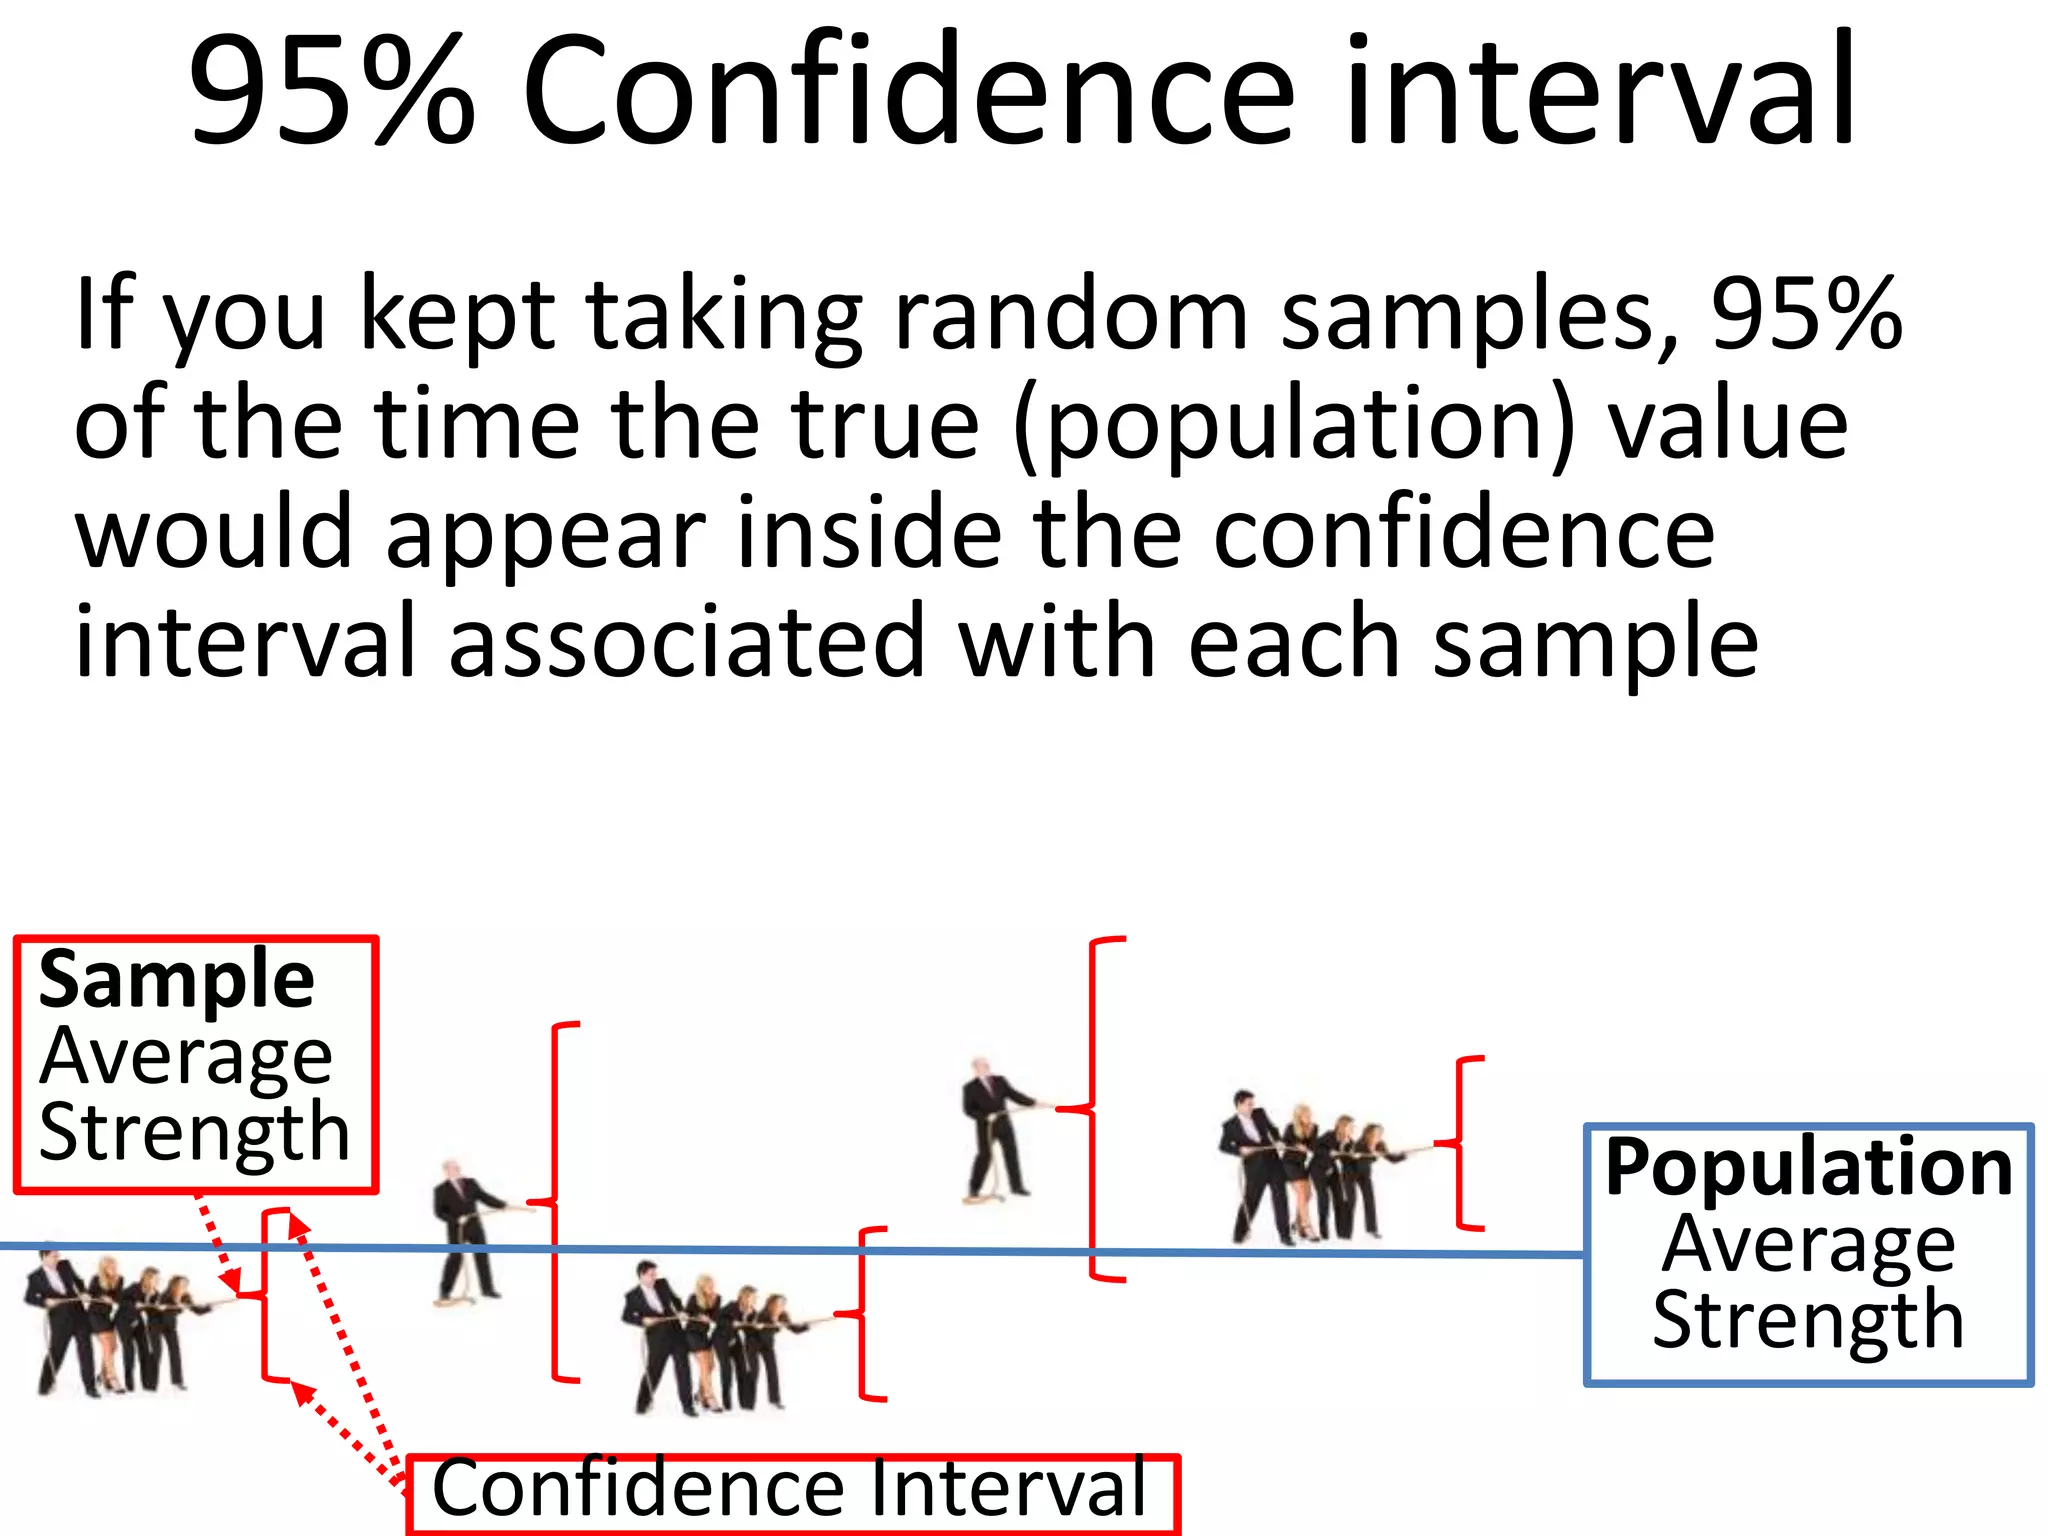
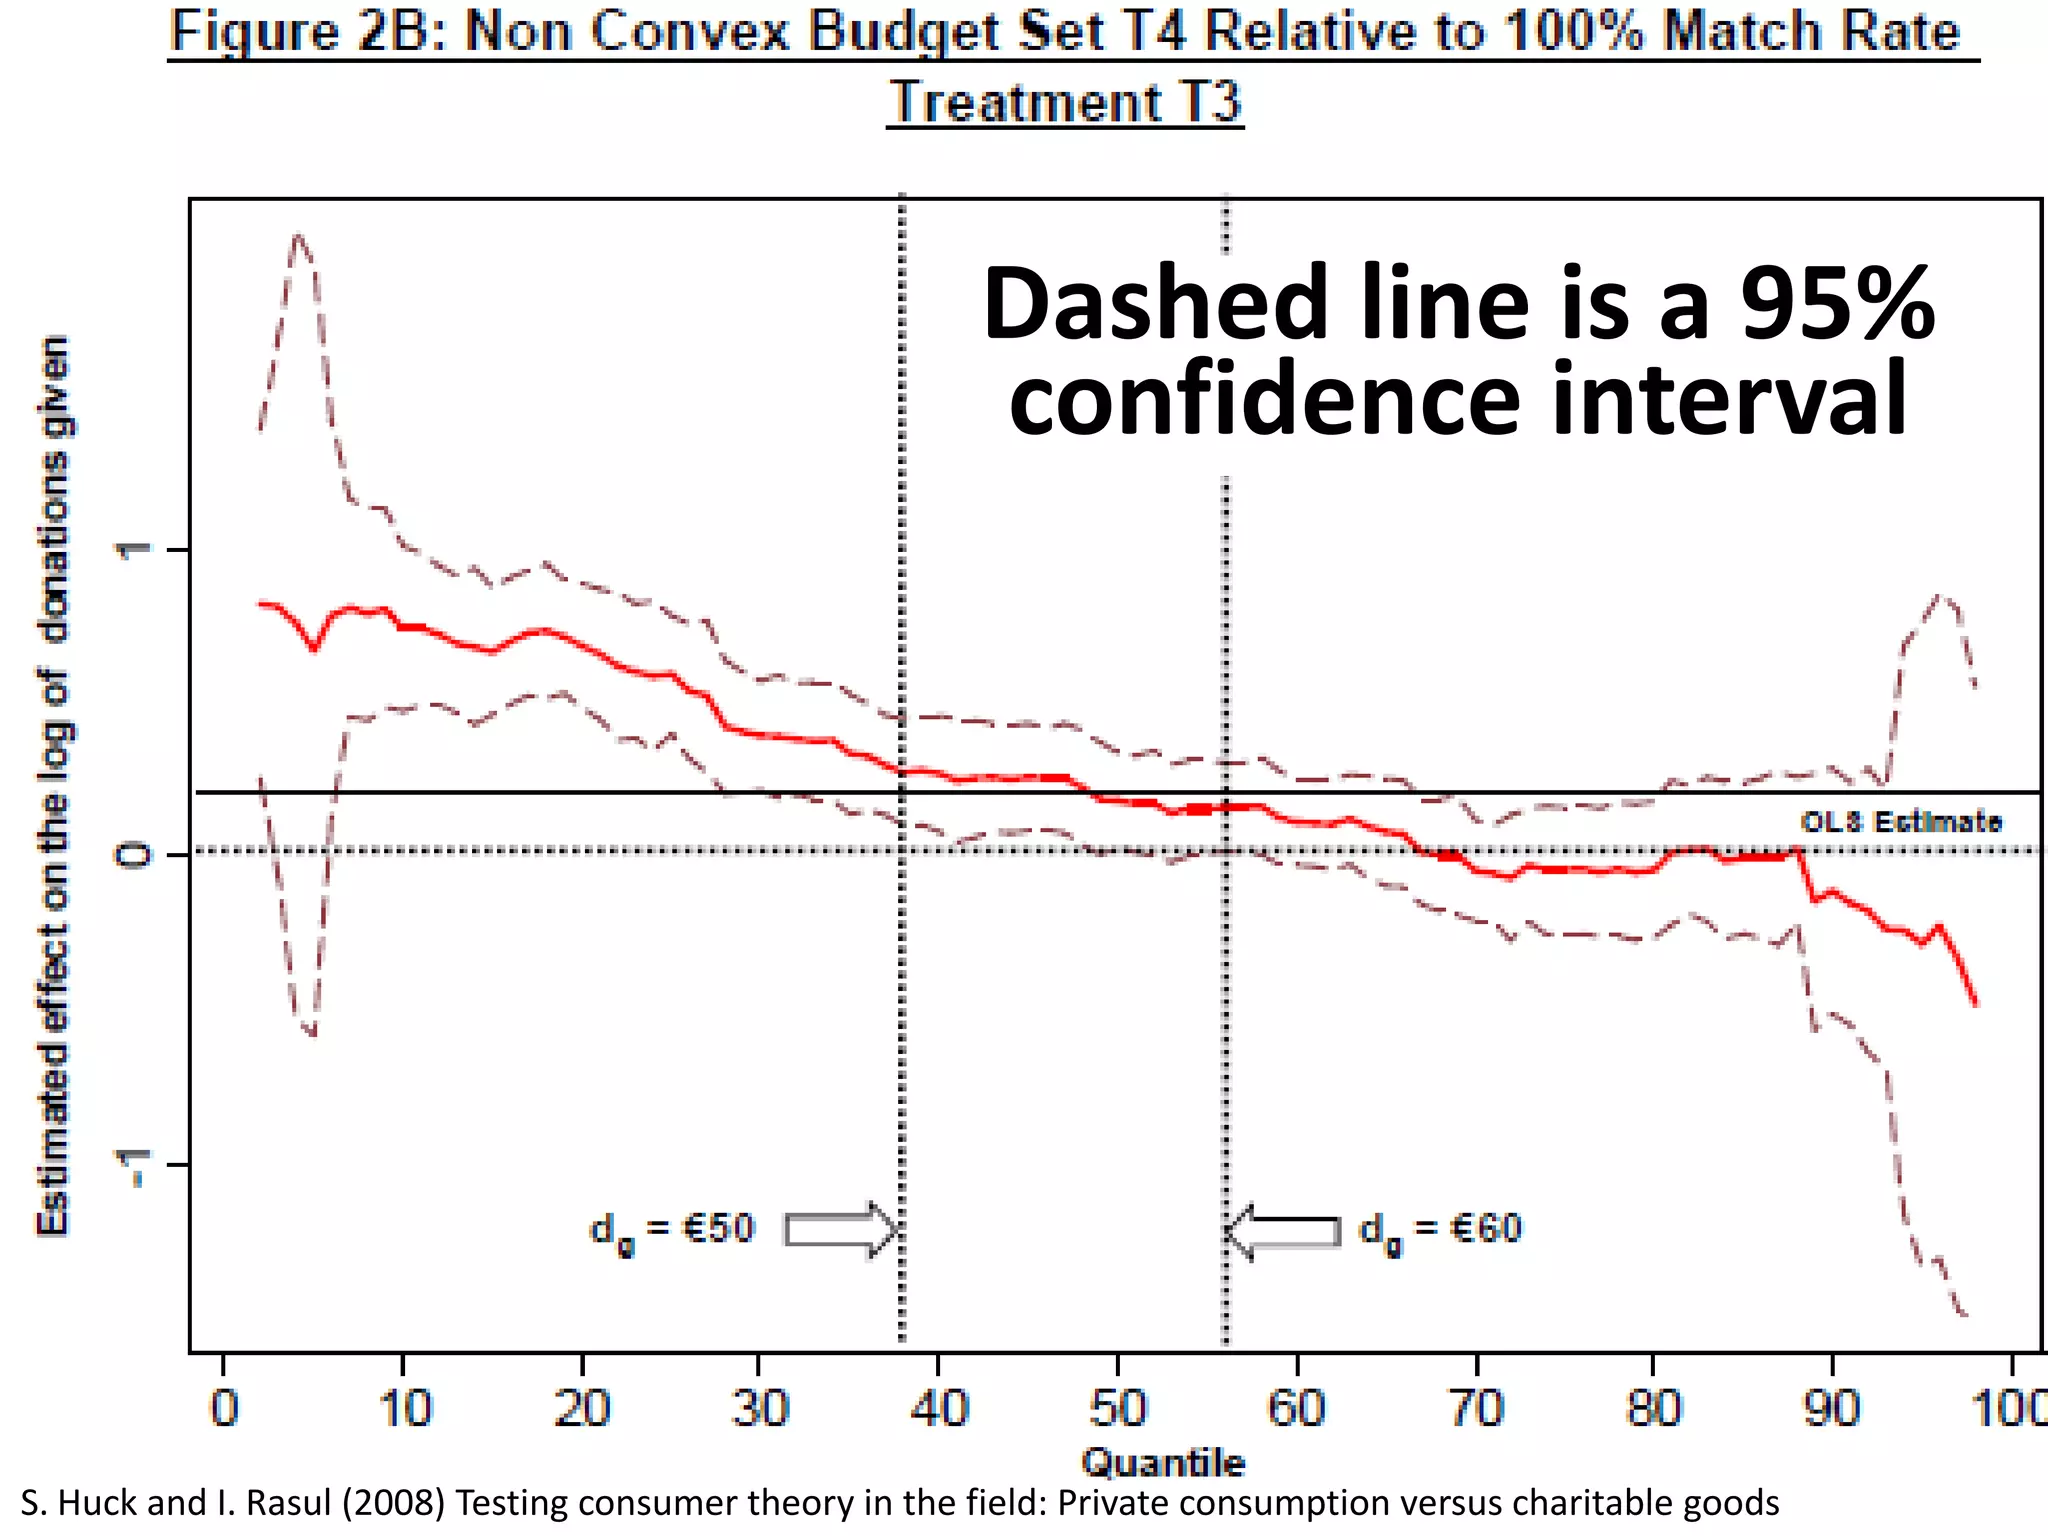
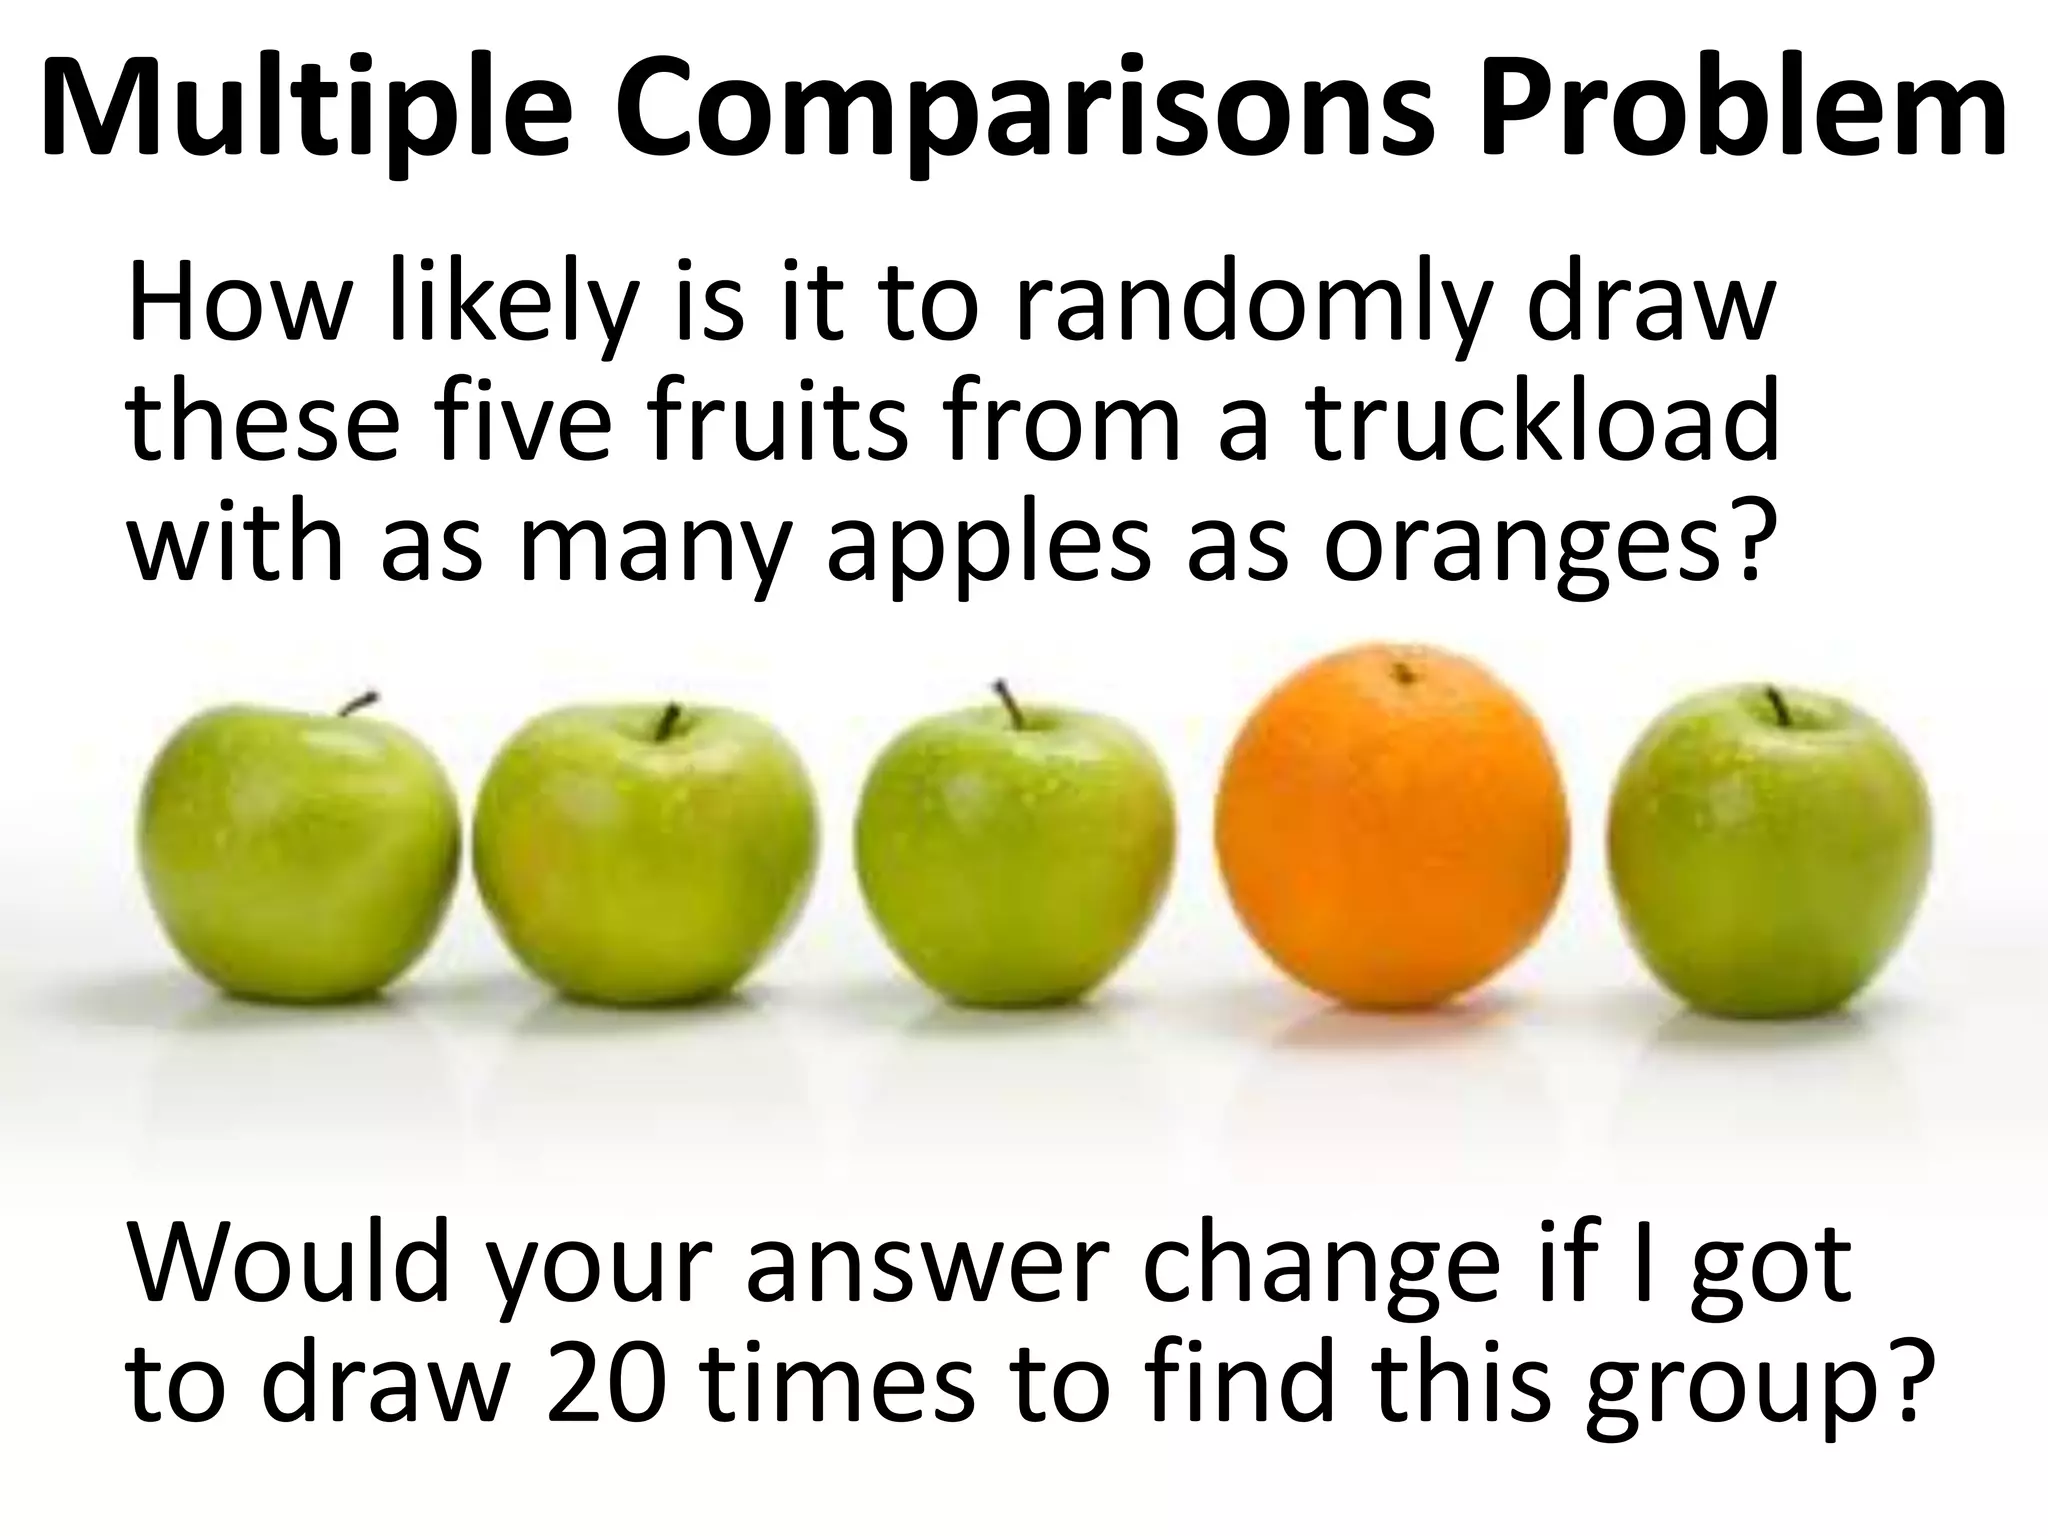


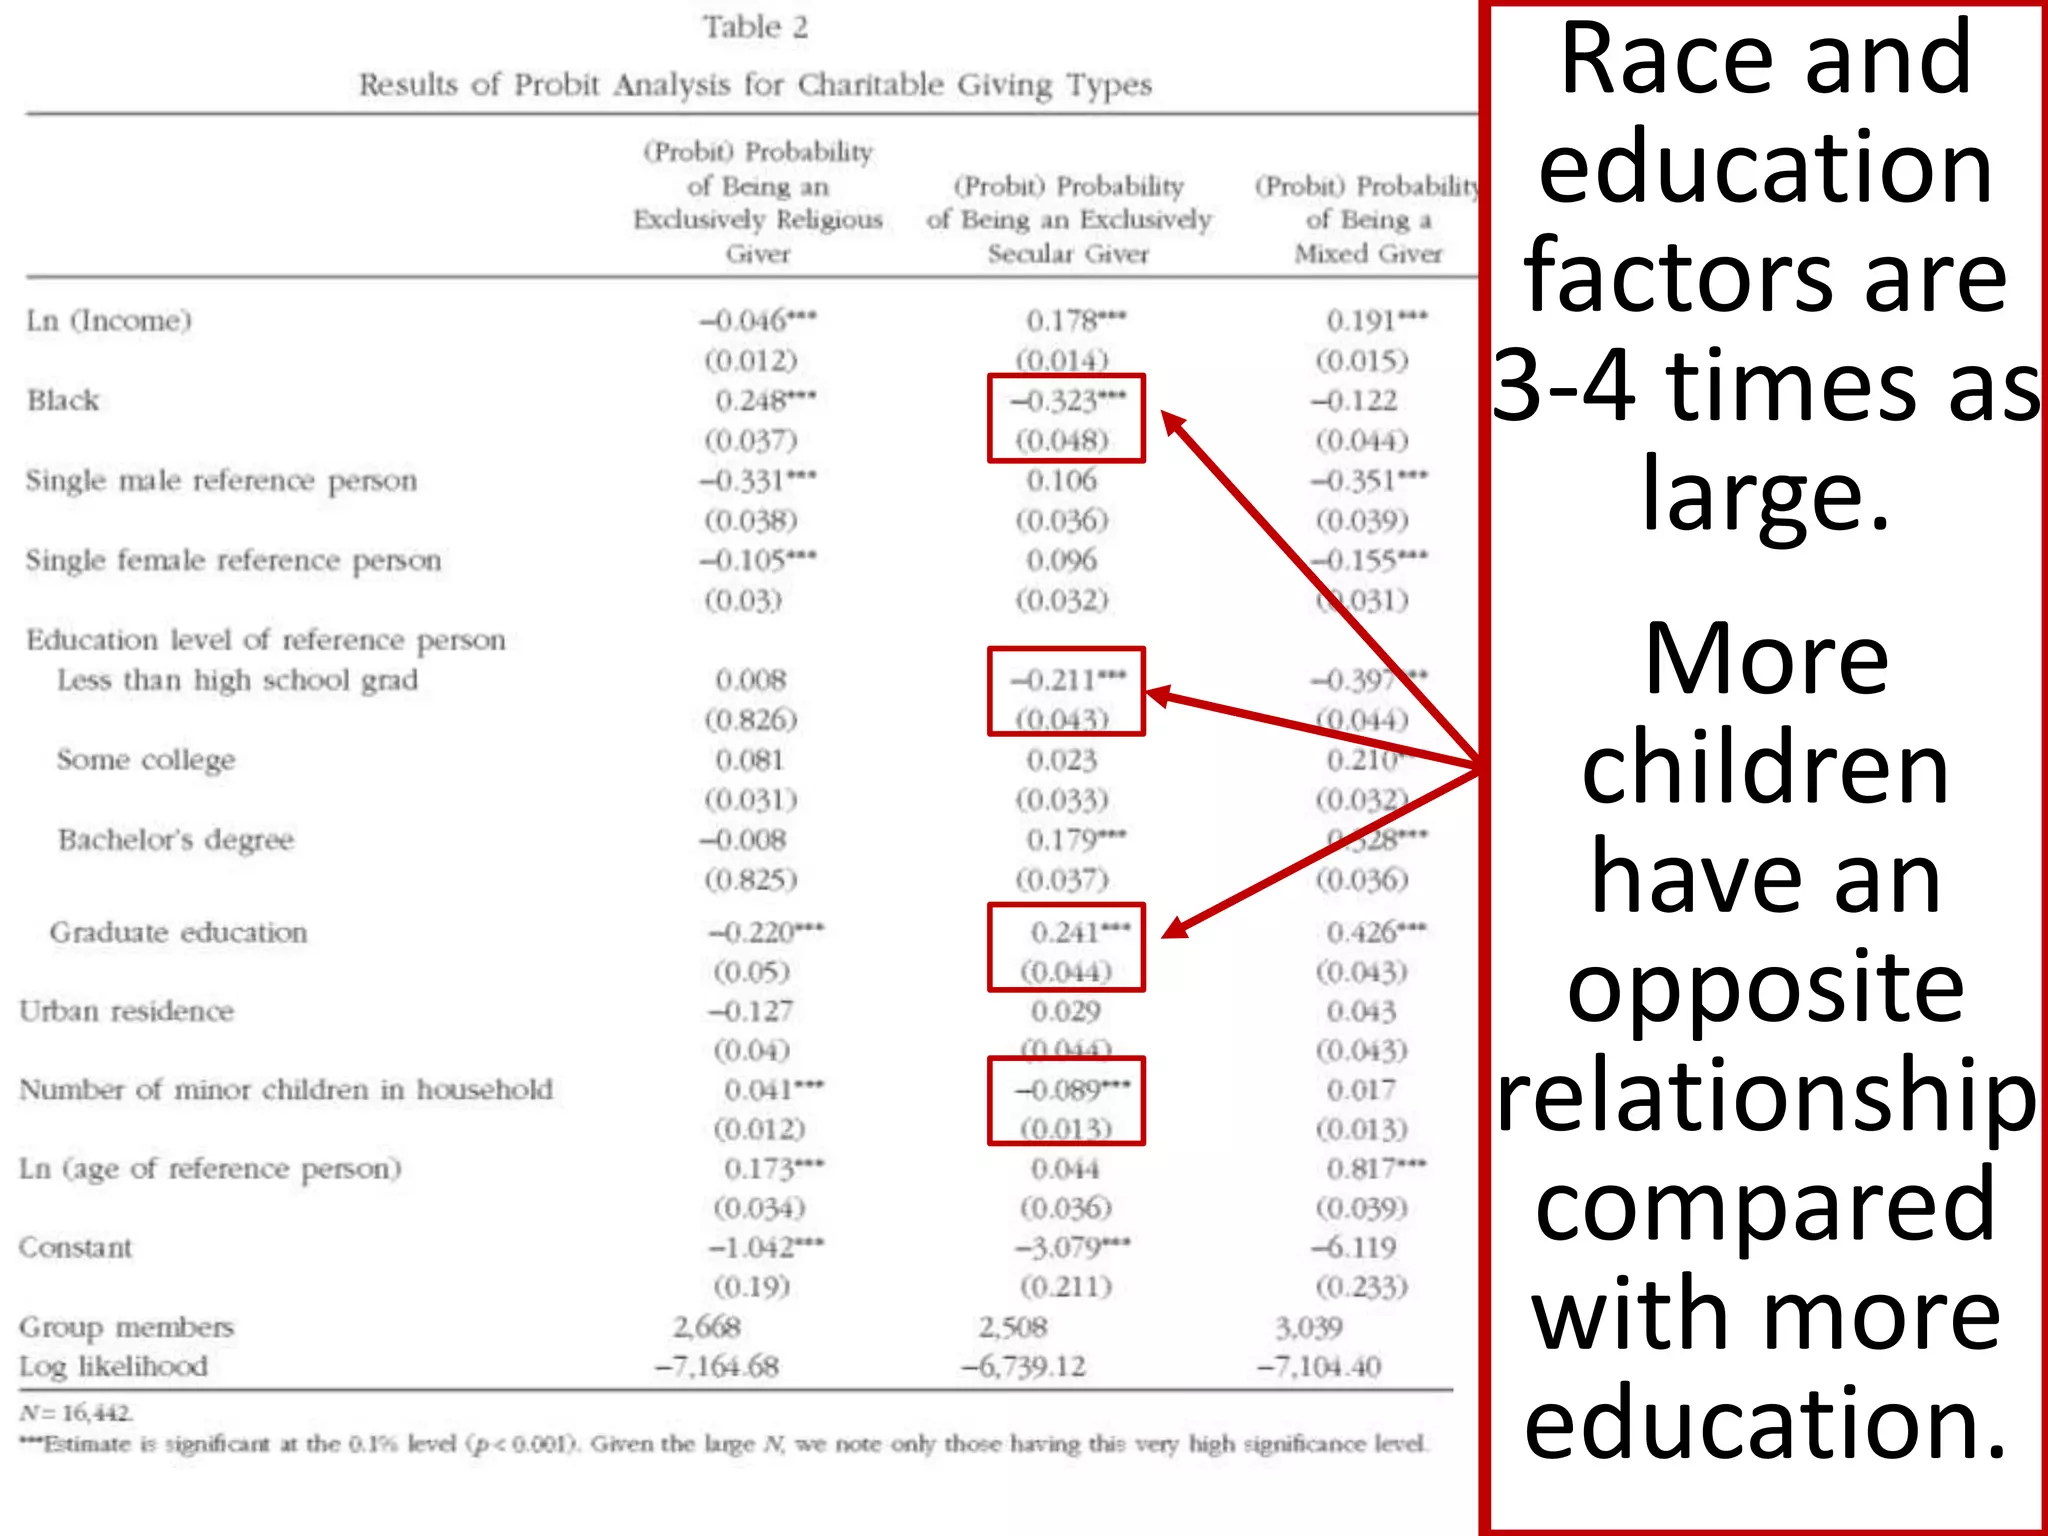
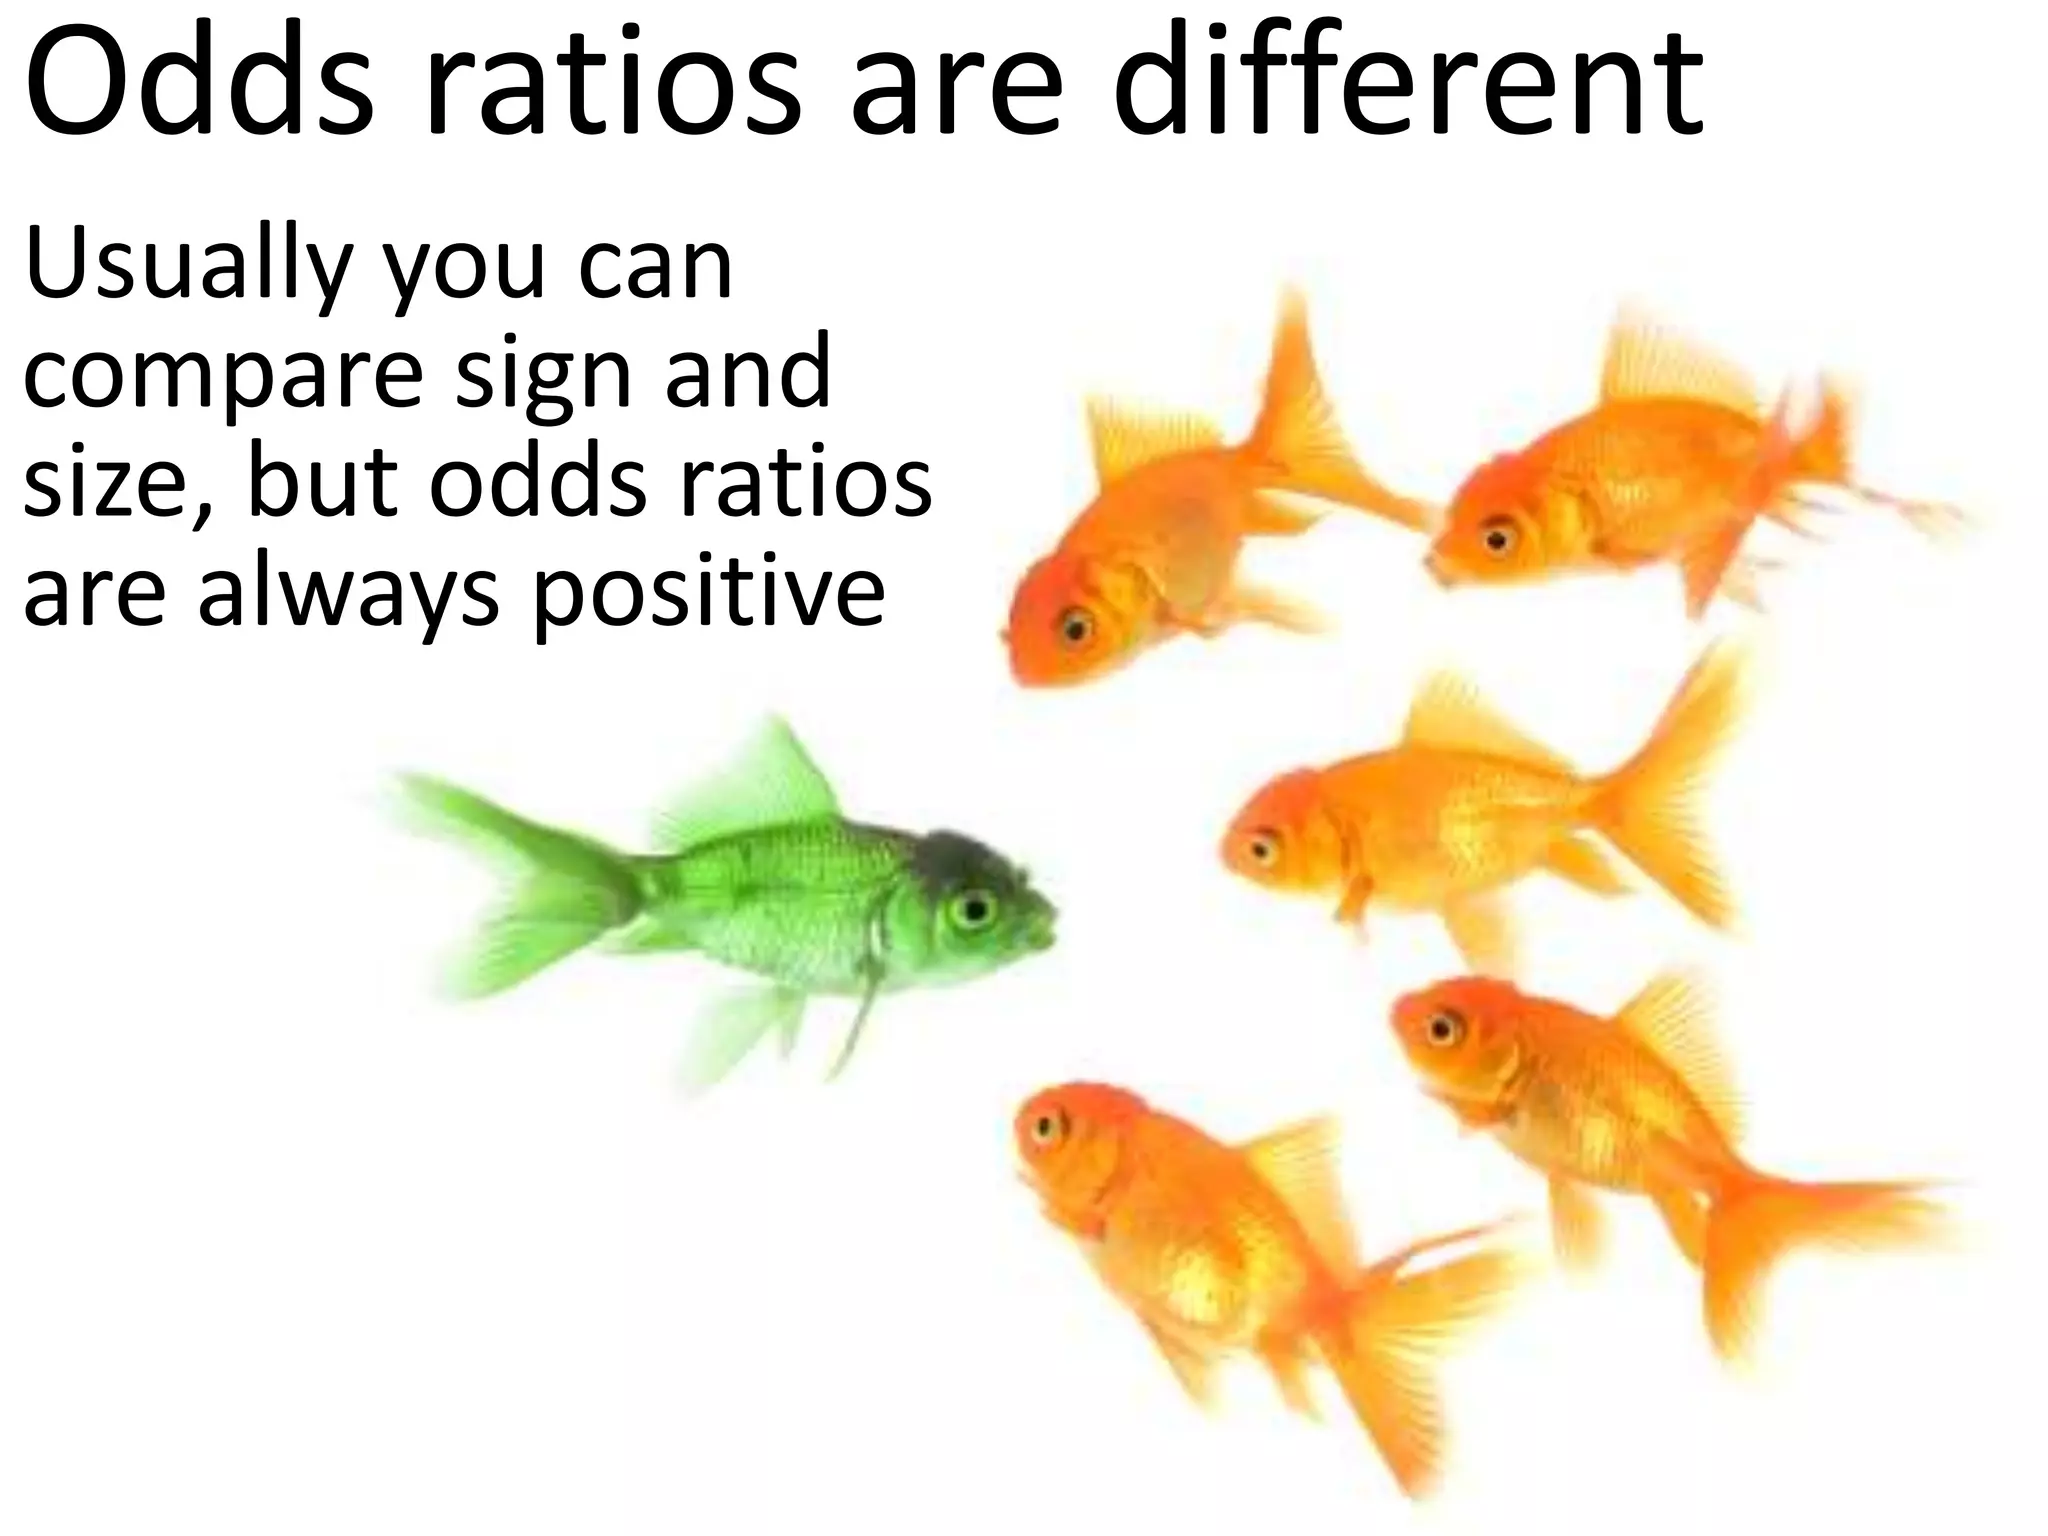
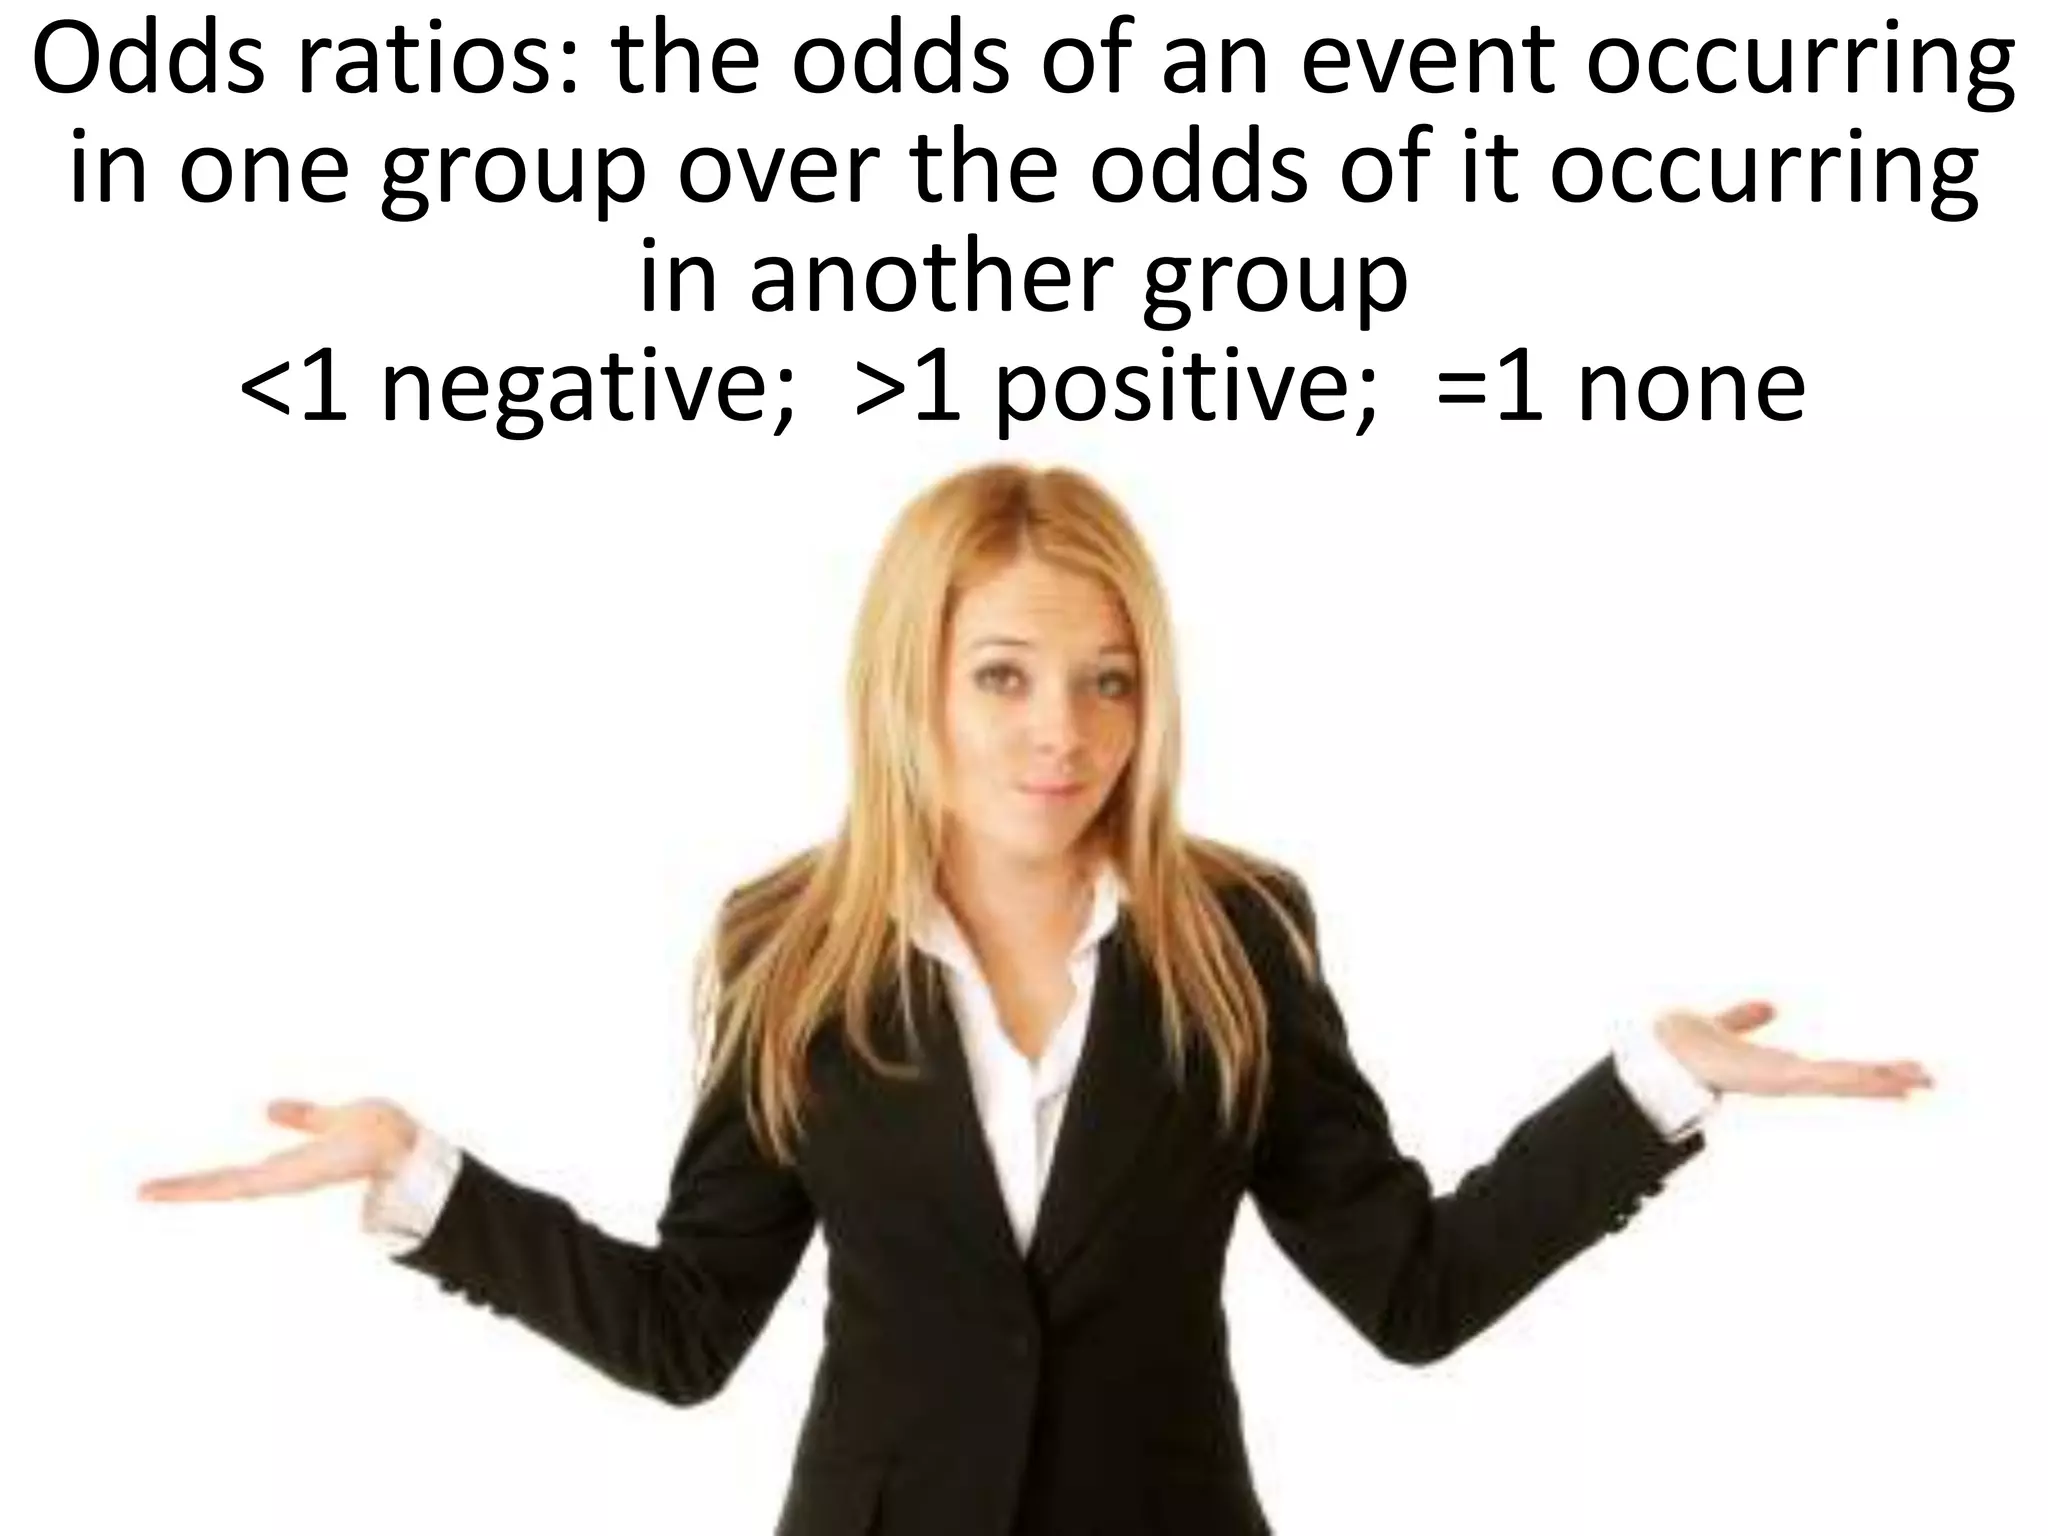
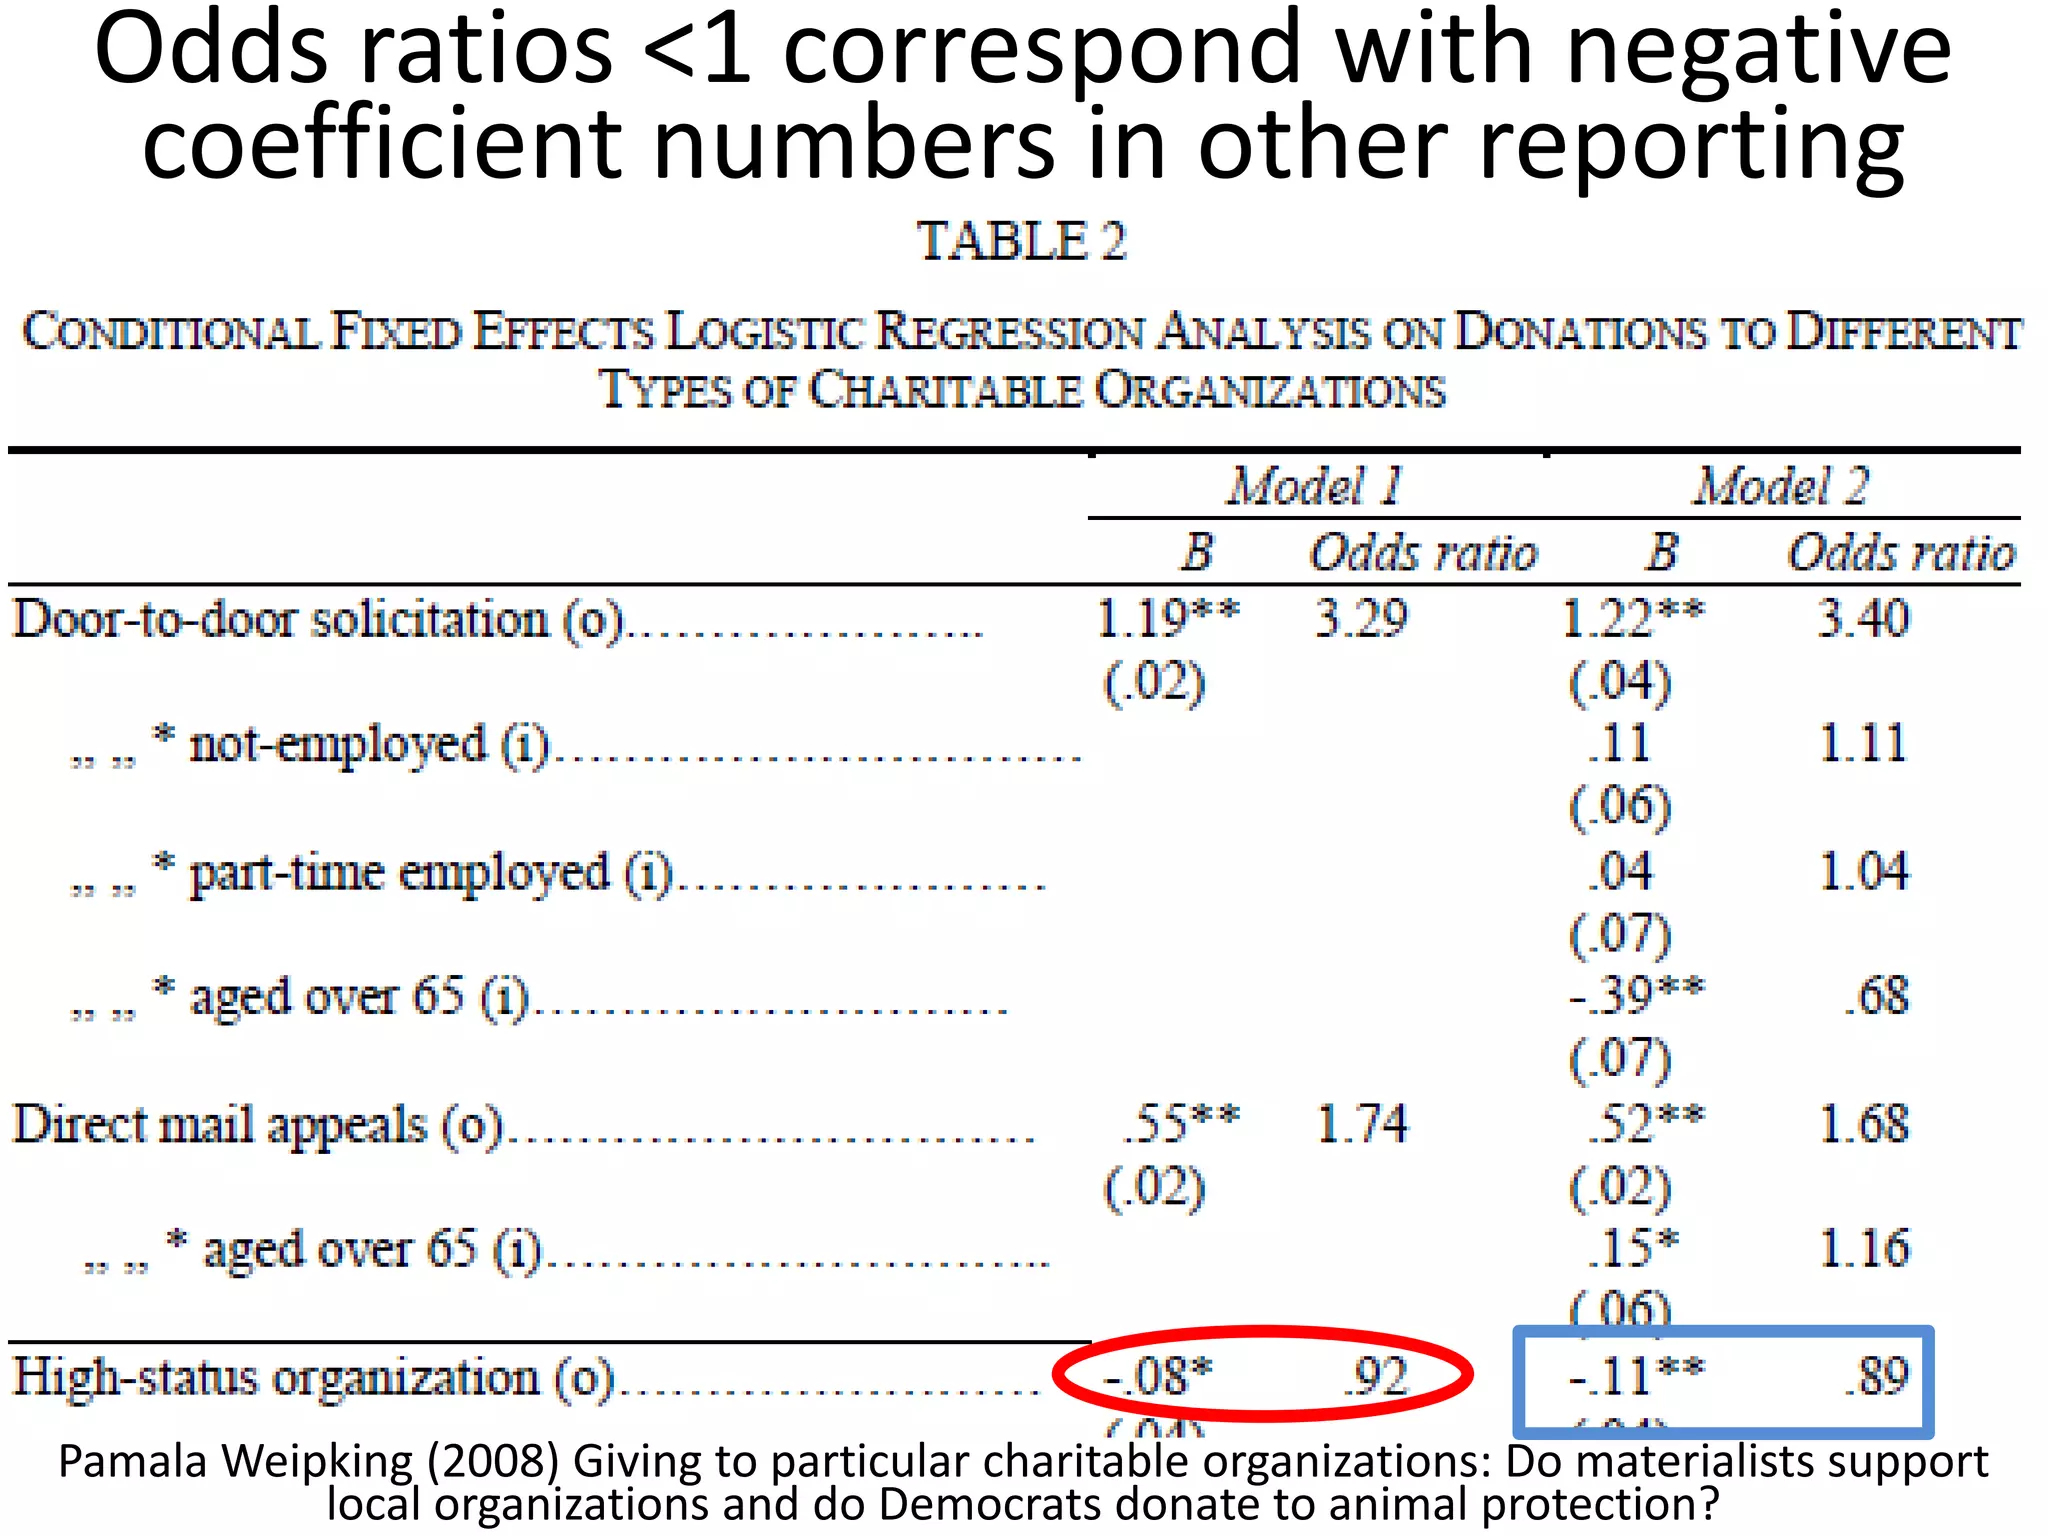

The document offers guidance on reading academic research effectively, especially for non-experts, emphasizing that one can extract key concepts without understanding every detail. It discusses statistical concepts such as association versus causation, significance versus magnitude, and correlation versus multiple regression, highlighting the importance of critical assessment of research findings. Additionally, it stresses the messy nature of research and the need for careful evaluation of results to distinguish strong findings from weak ones.