Downloaded 330 times
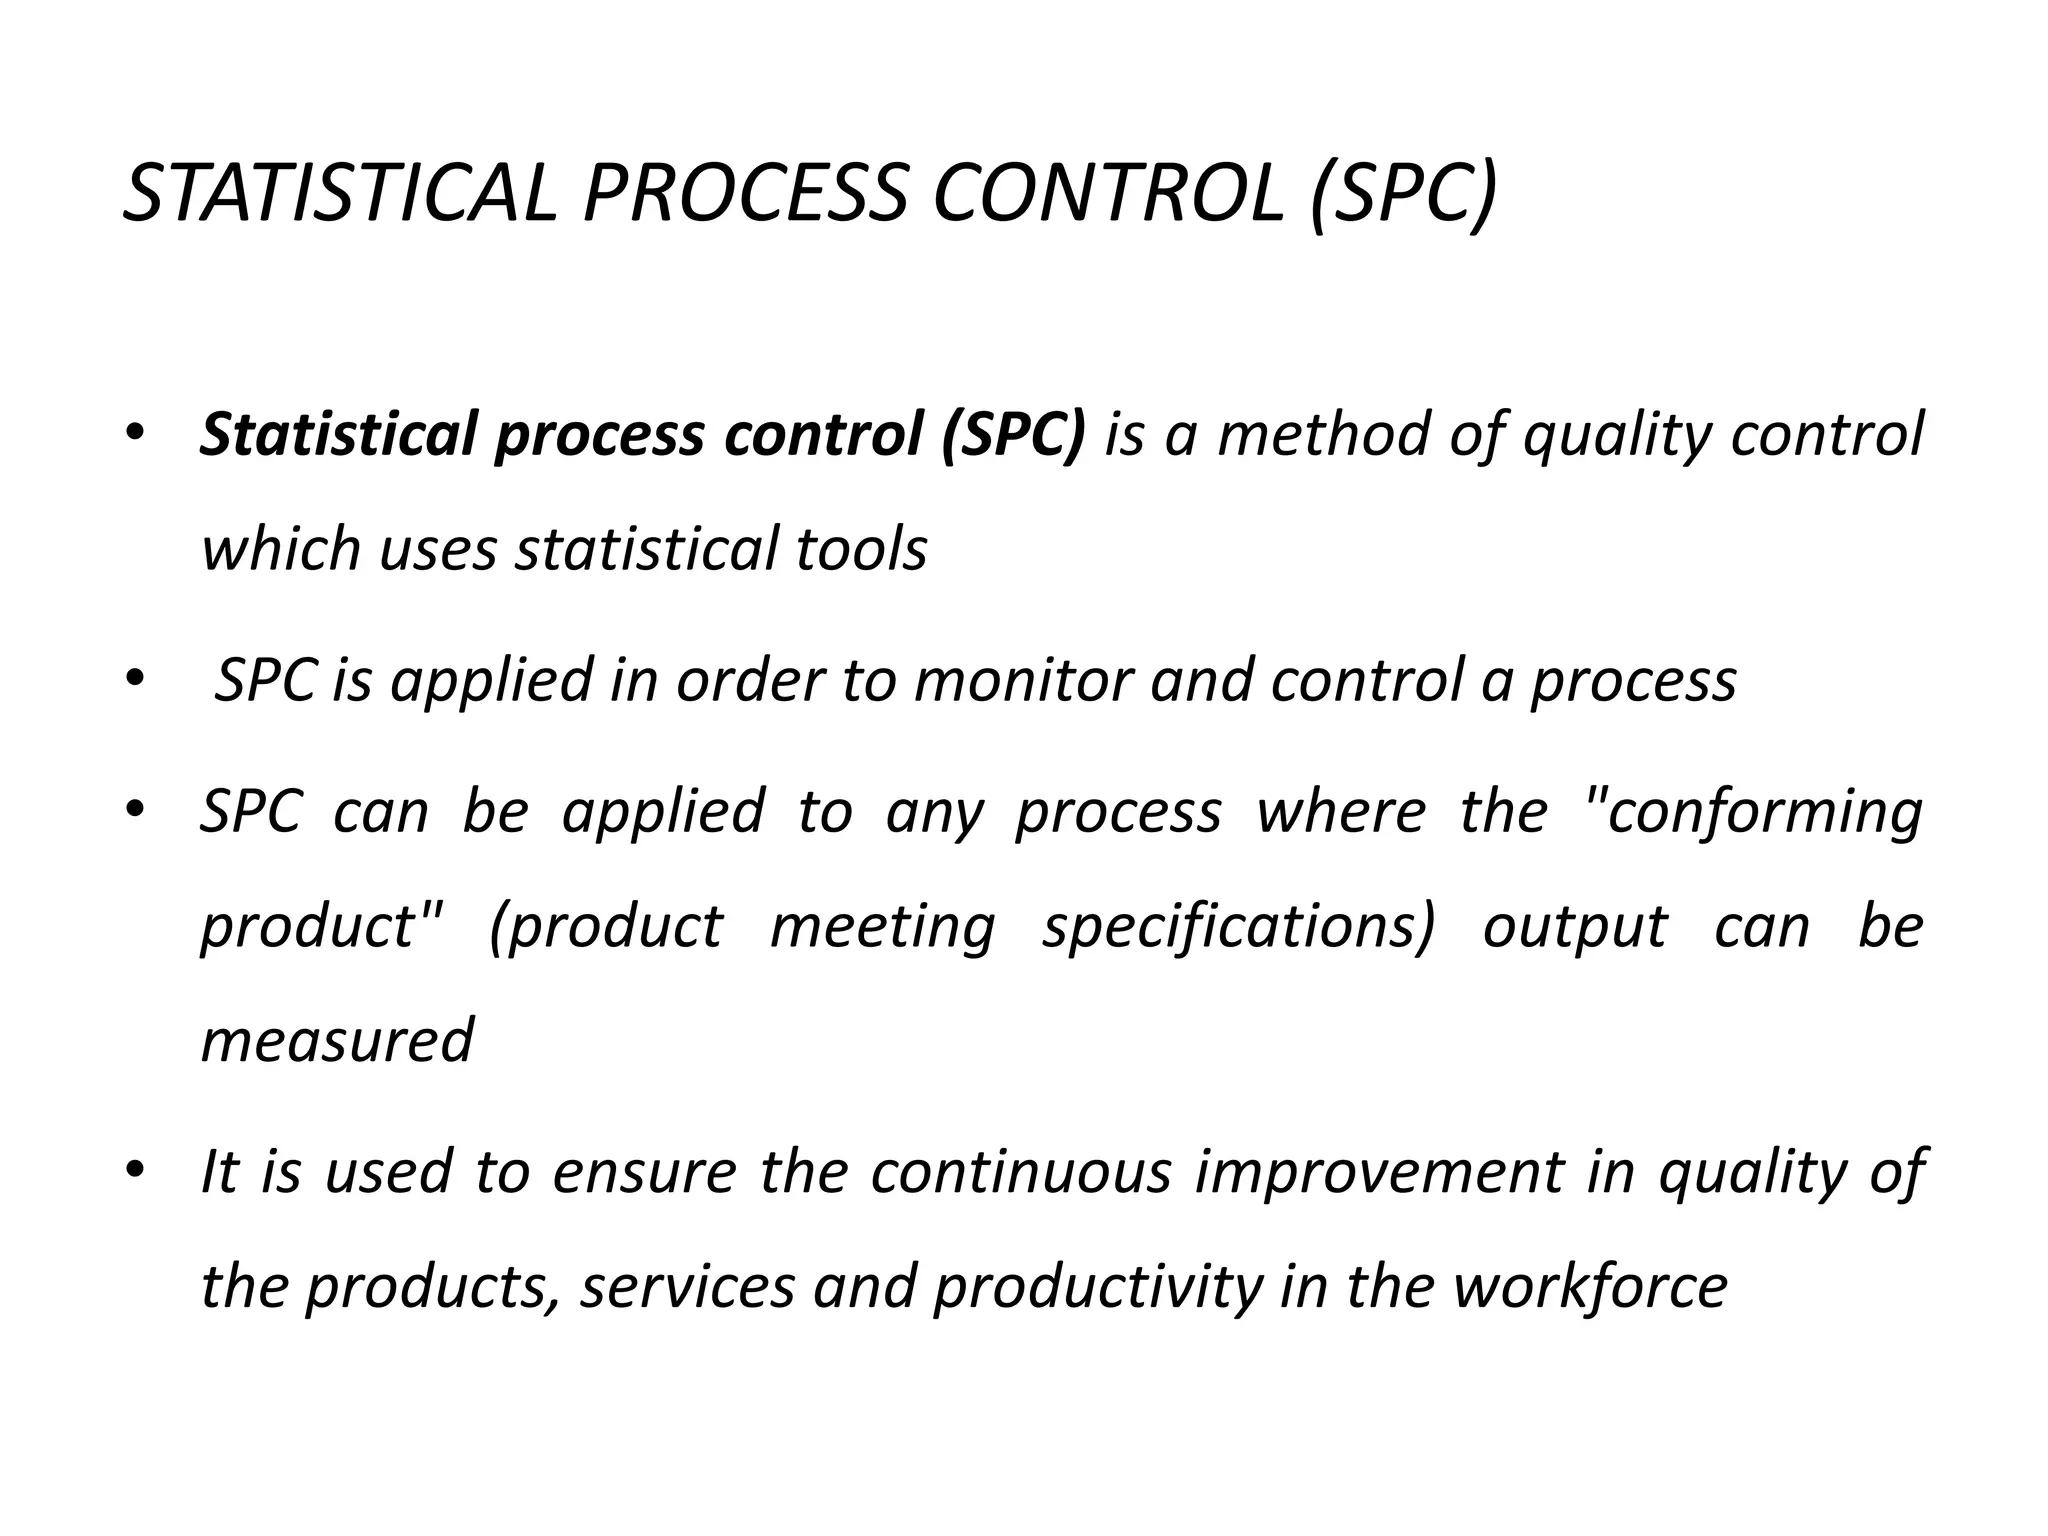
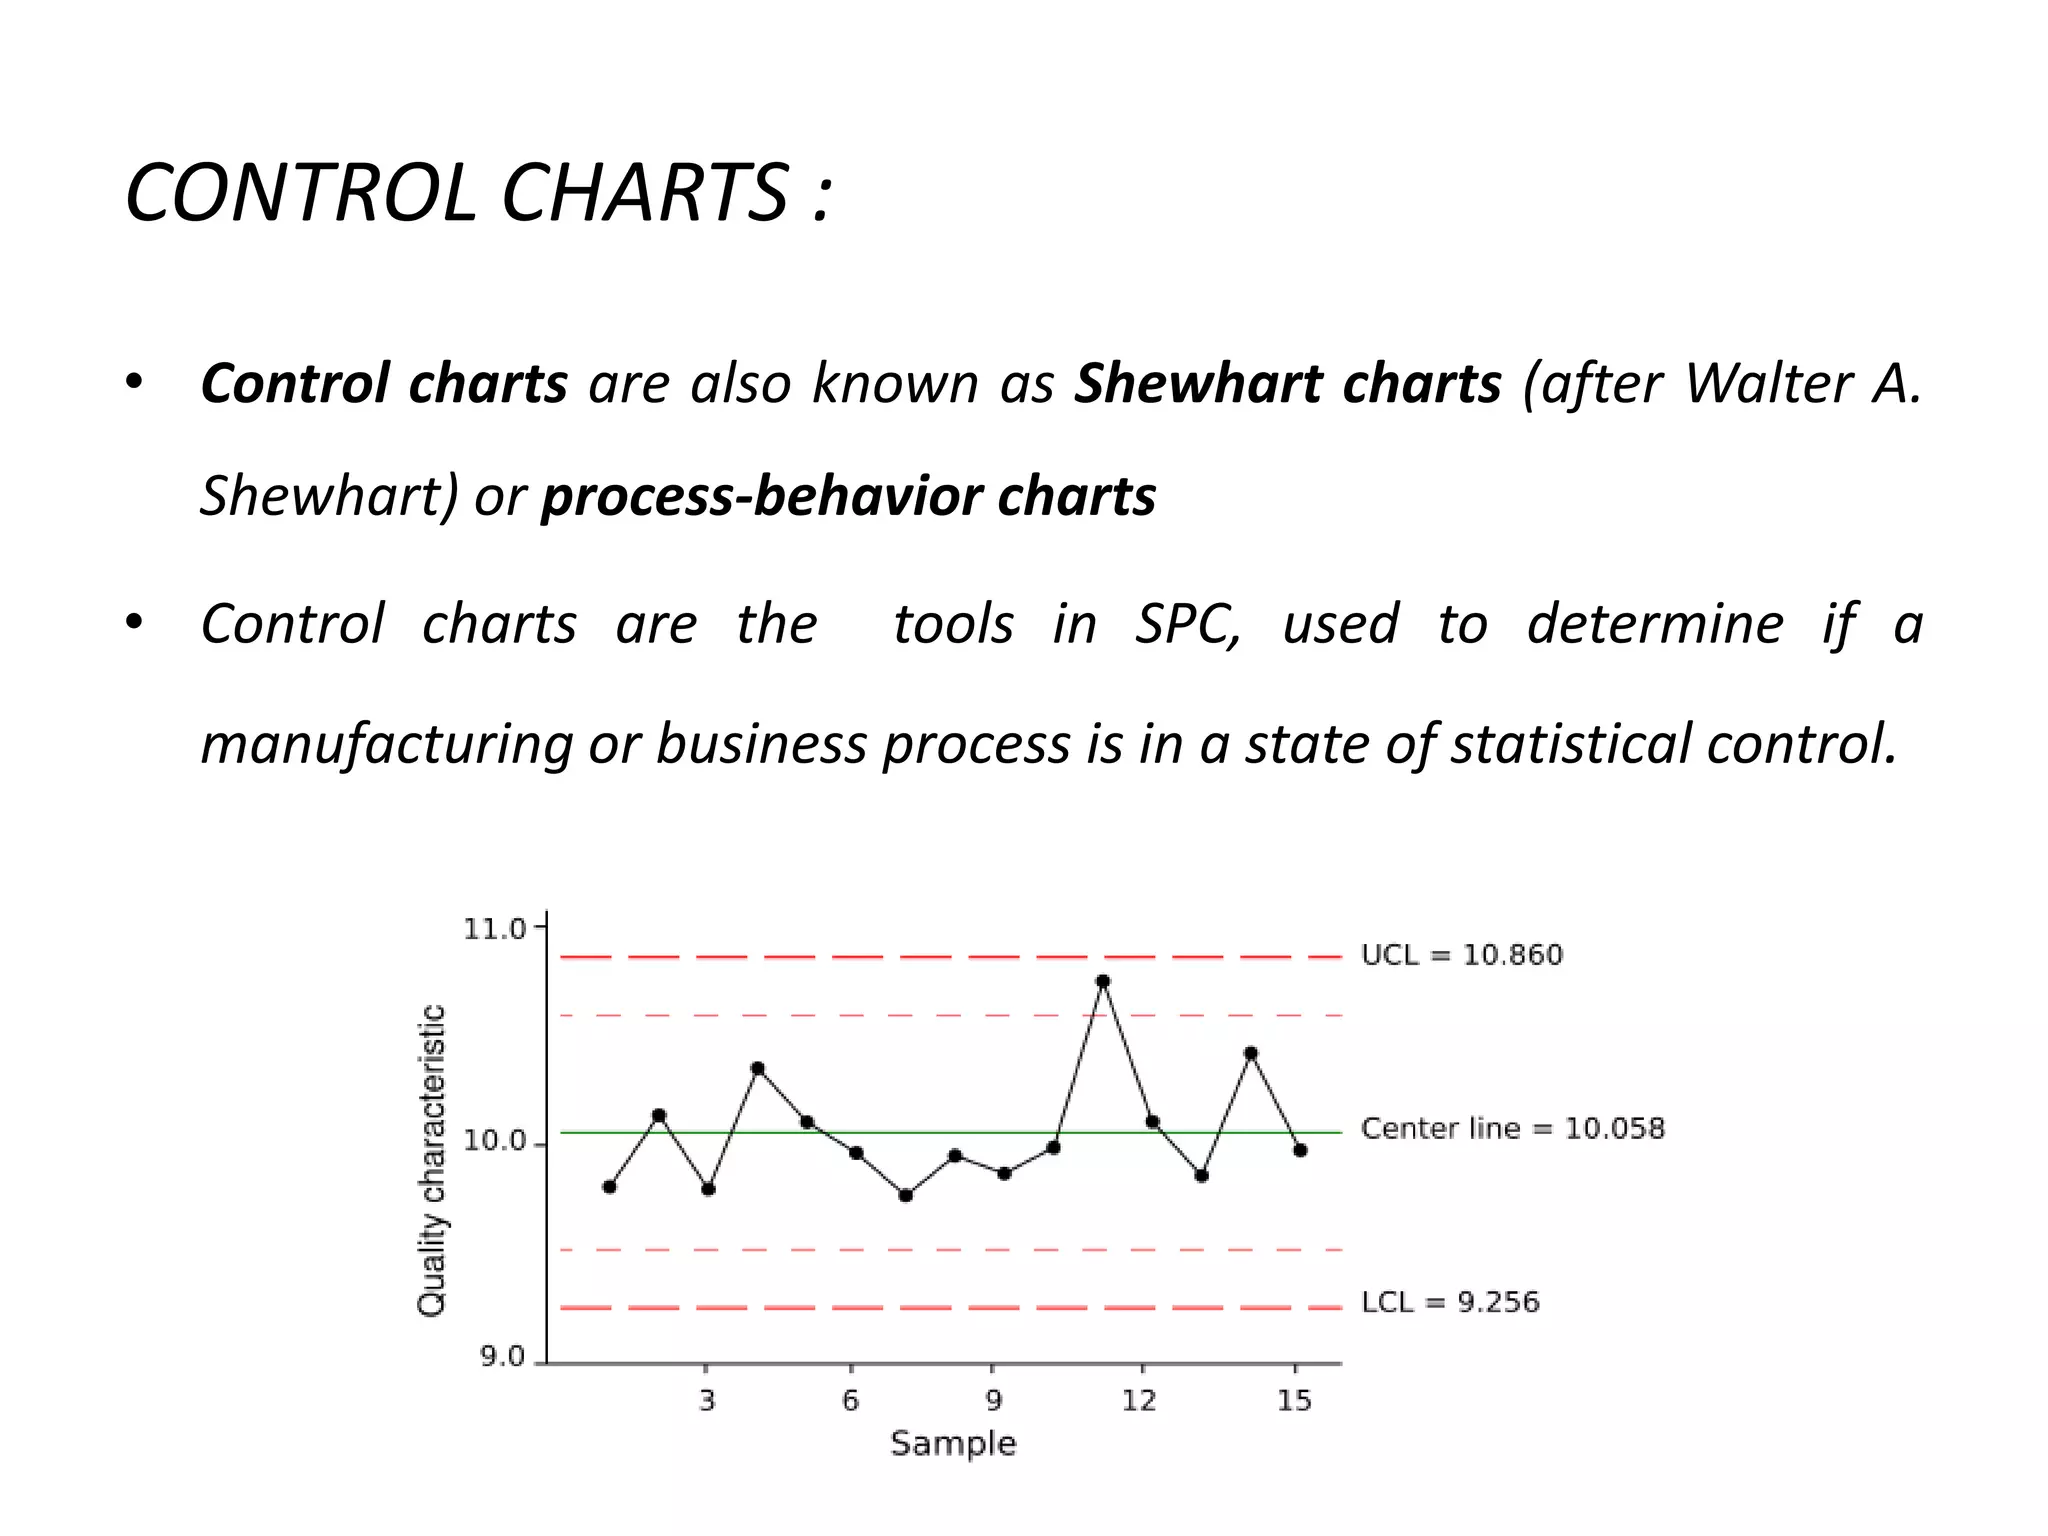
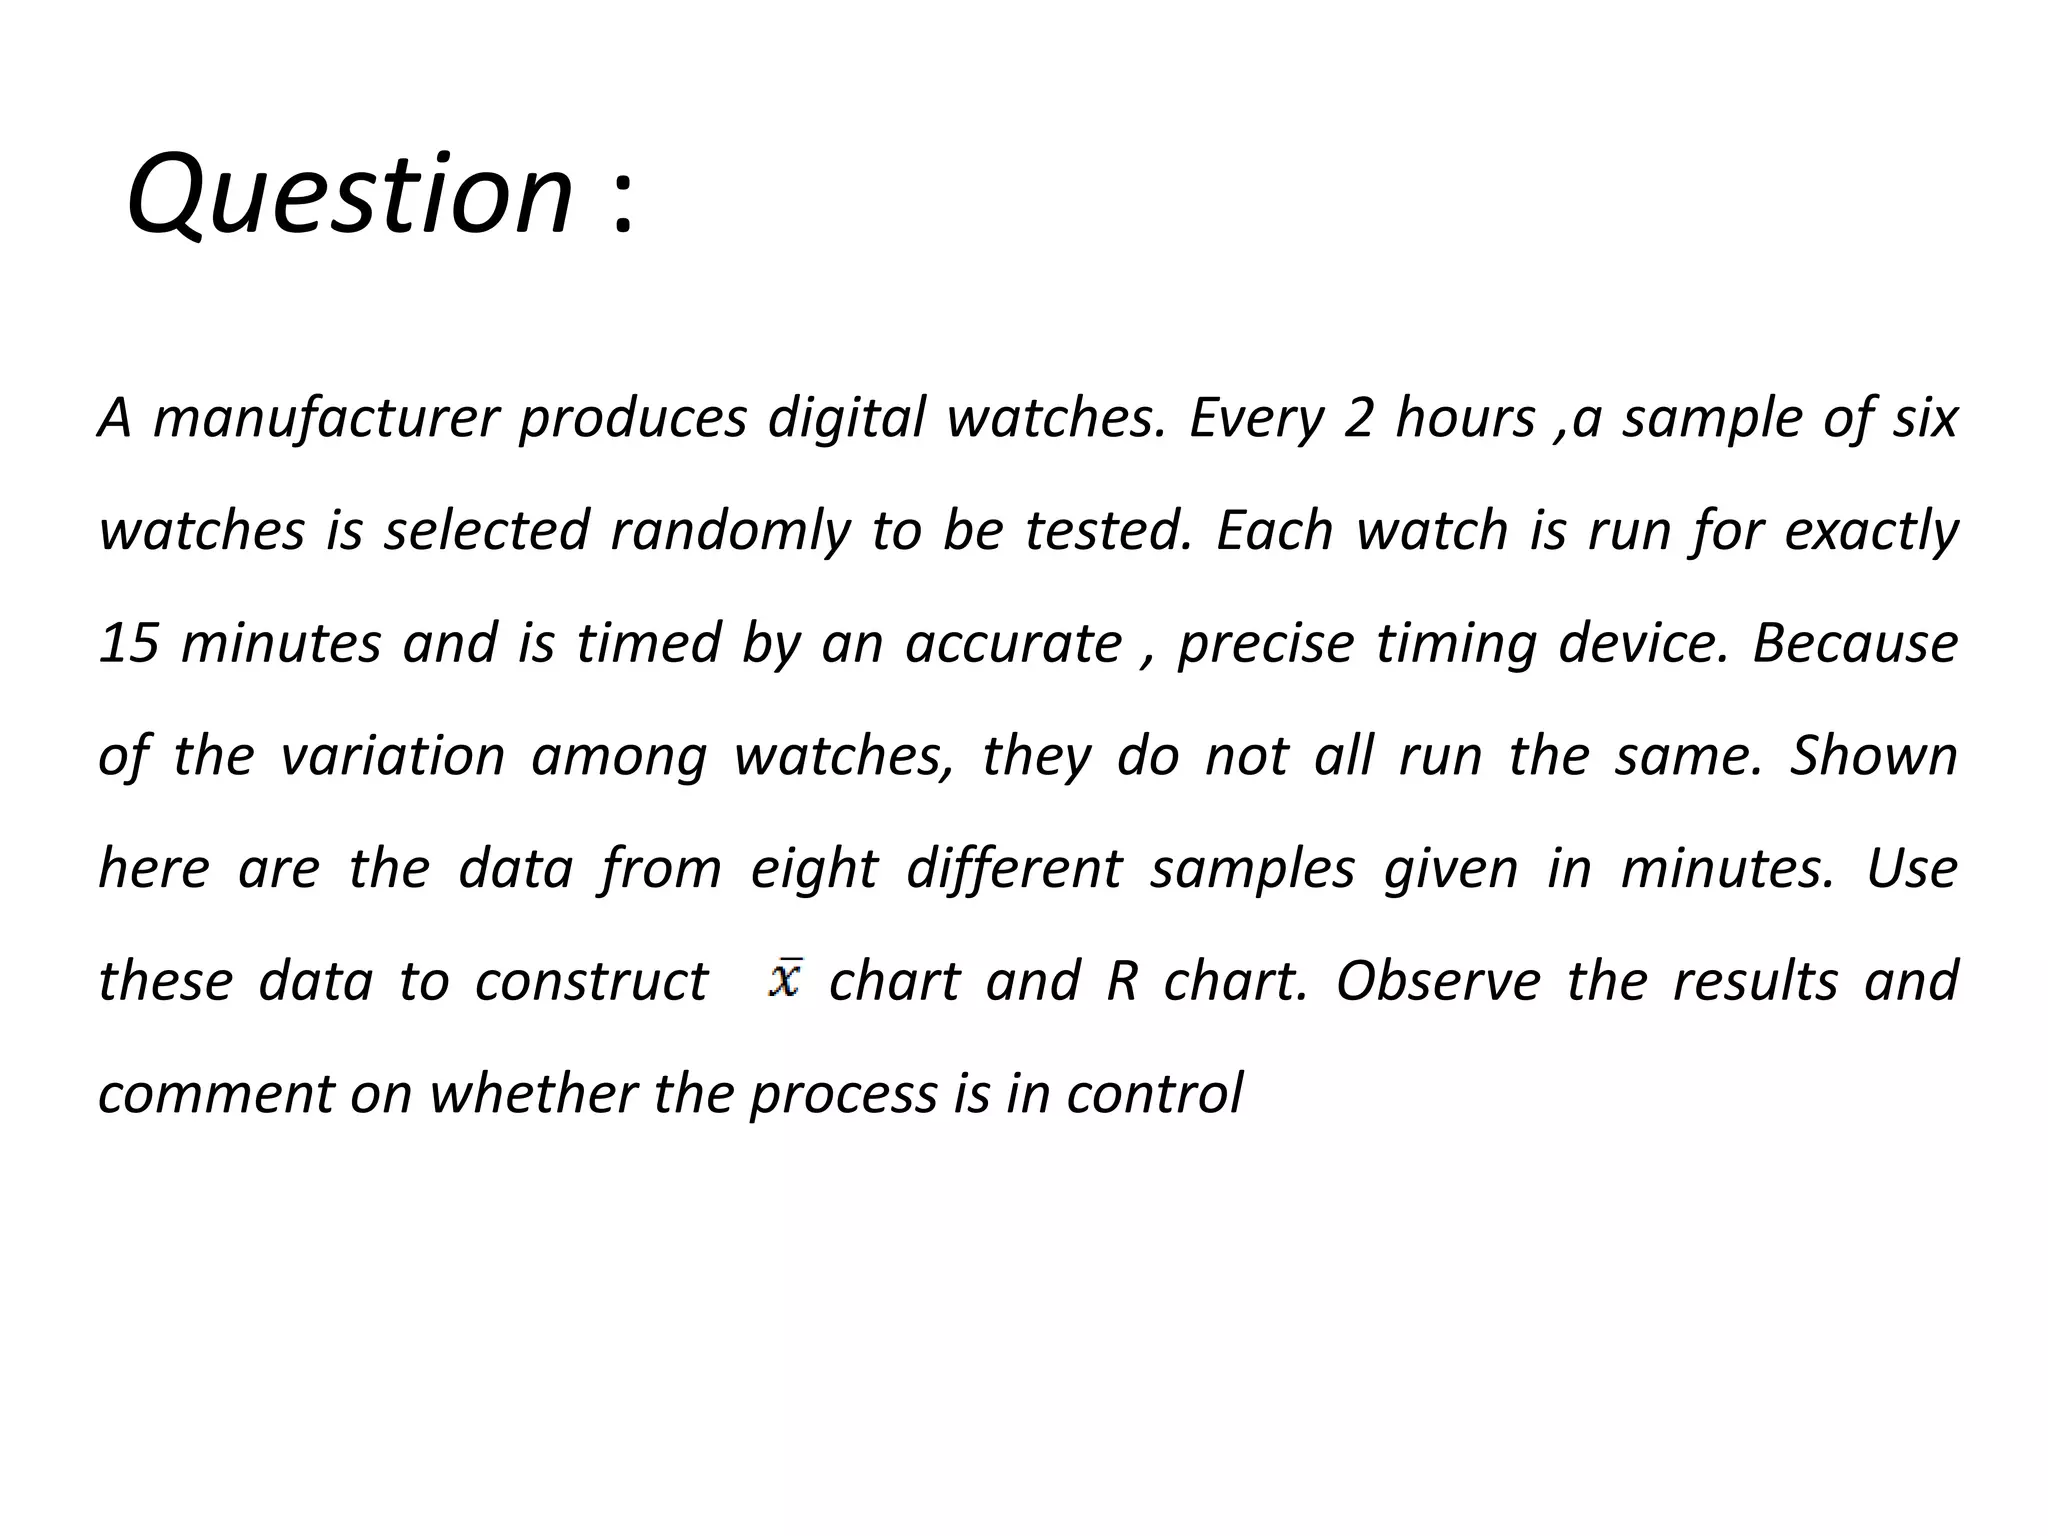


Statistical process control (SPC) uses statistical tools like control charts to monitor and control processes and ensure continuous quality improvement. Control charts, also called Shewhart charts, are tools used in SPC to determine if a process is statistically in control. The document presents data from samples of digital watches tested over eight periods. X-bar and R charts are constructed from the data and show that the process is in a state of statistical control.
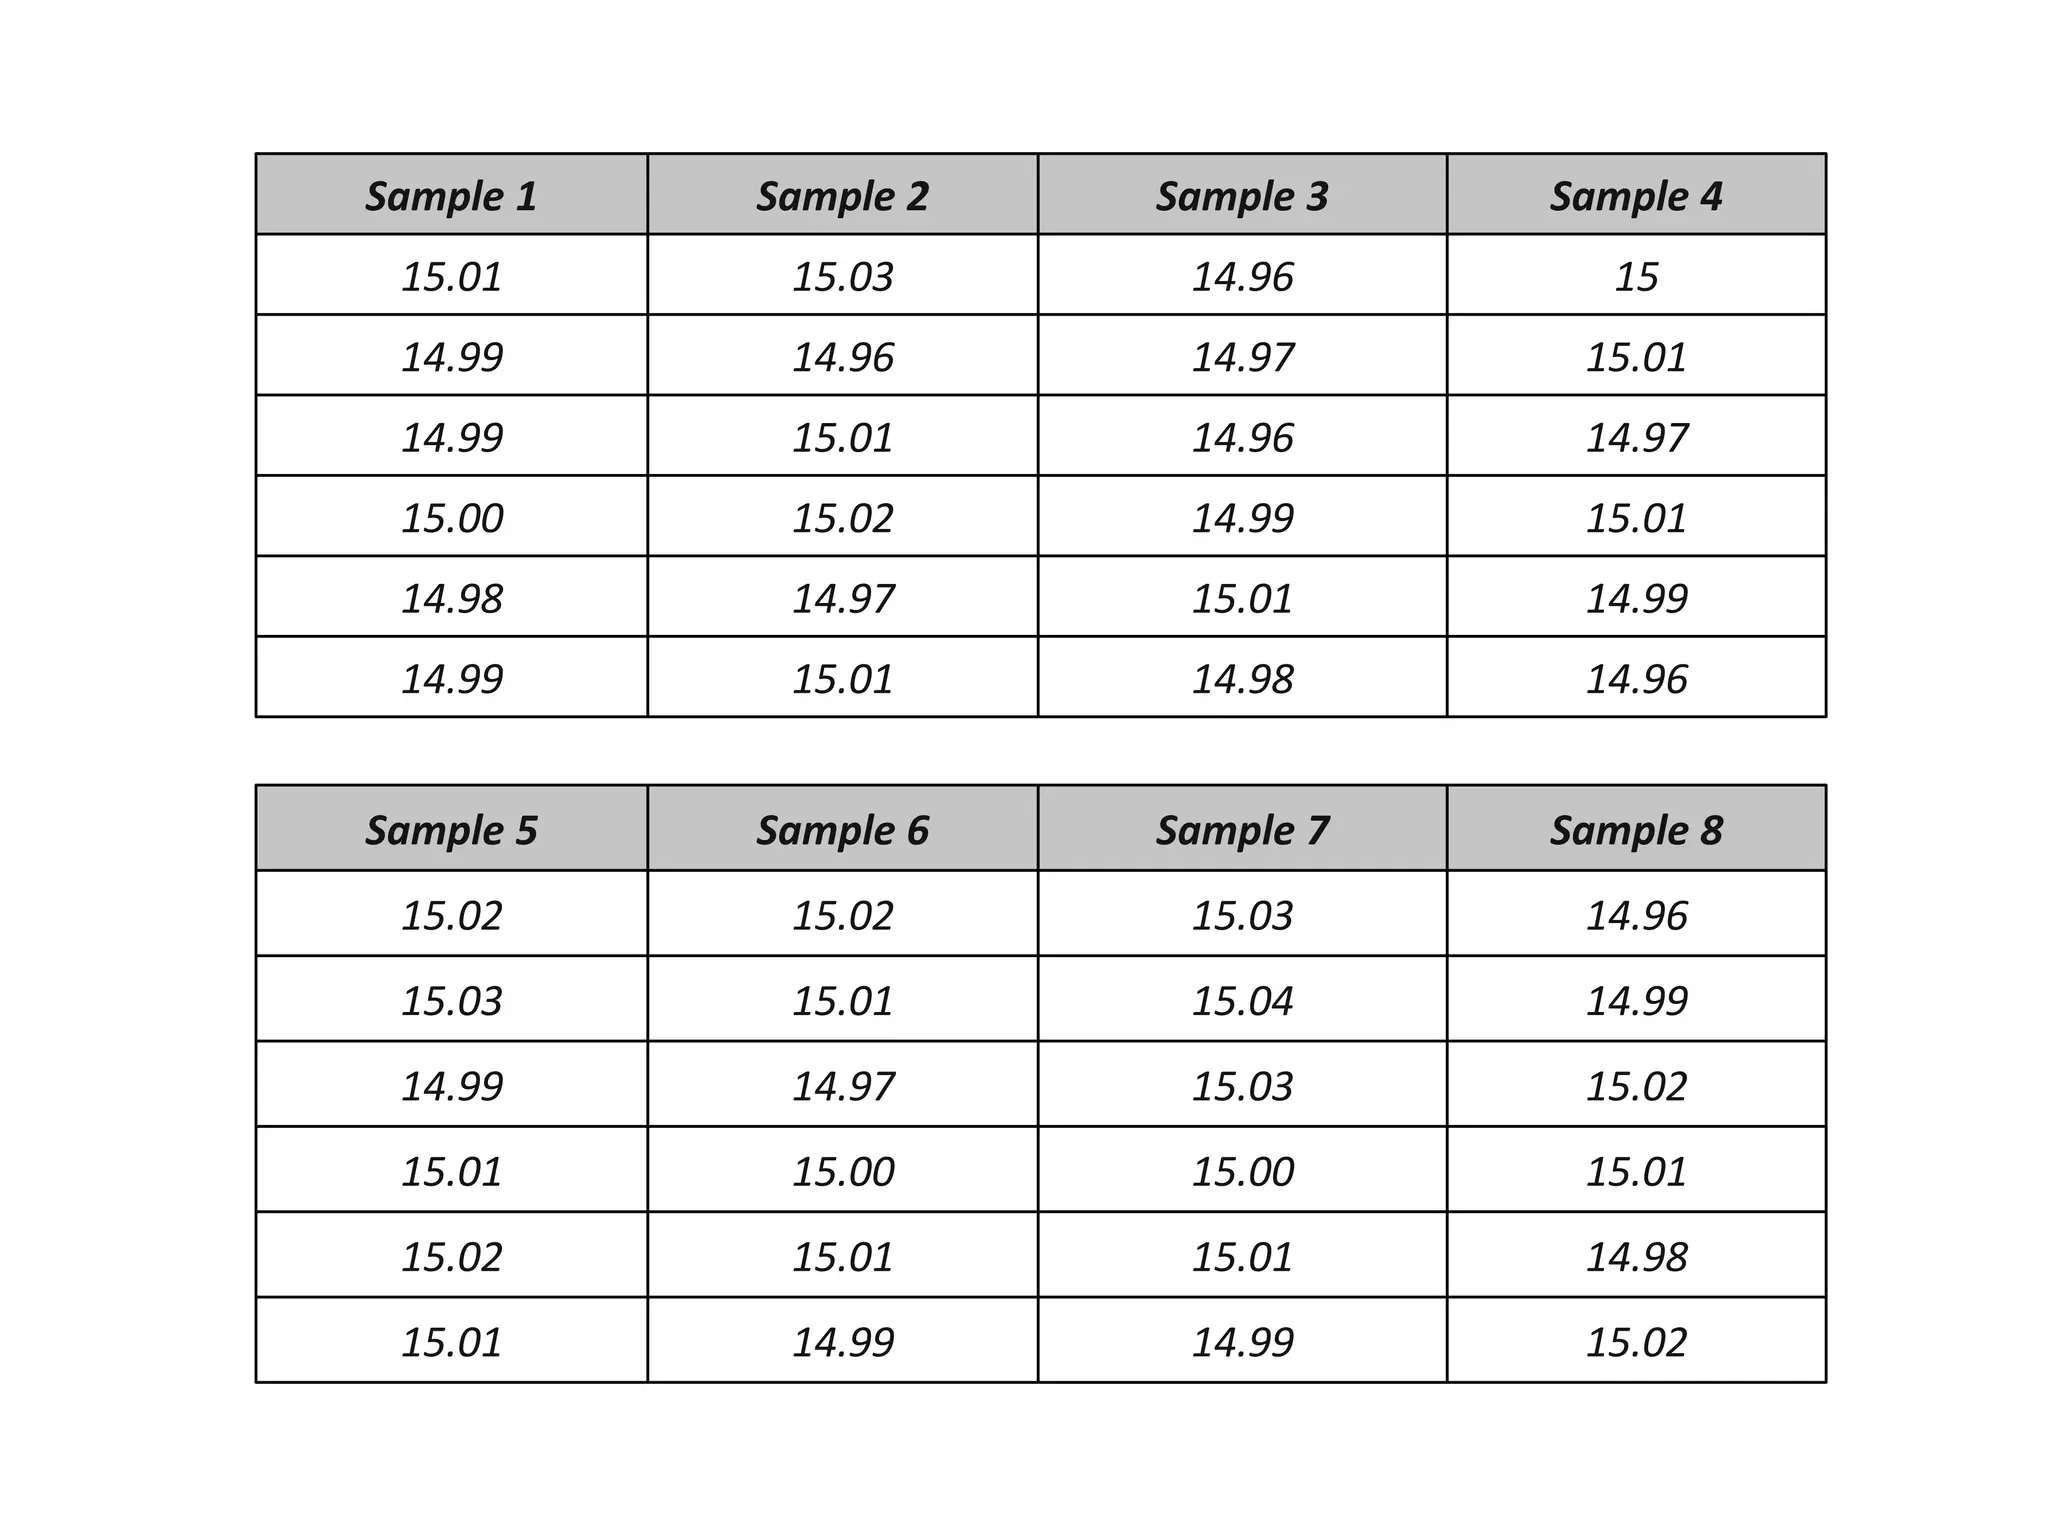
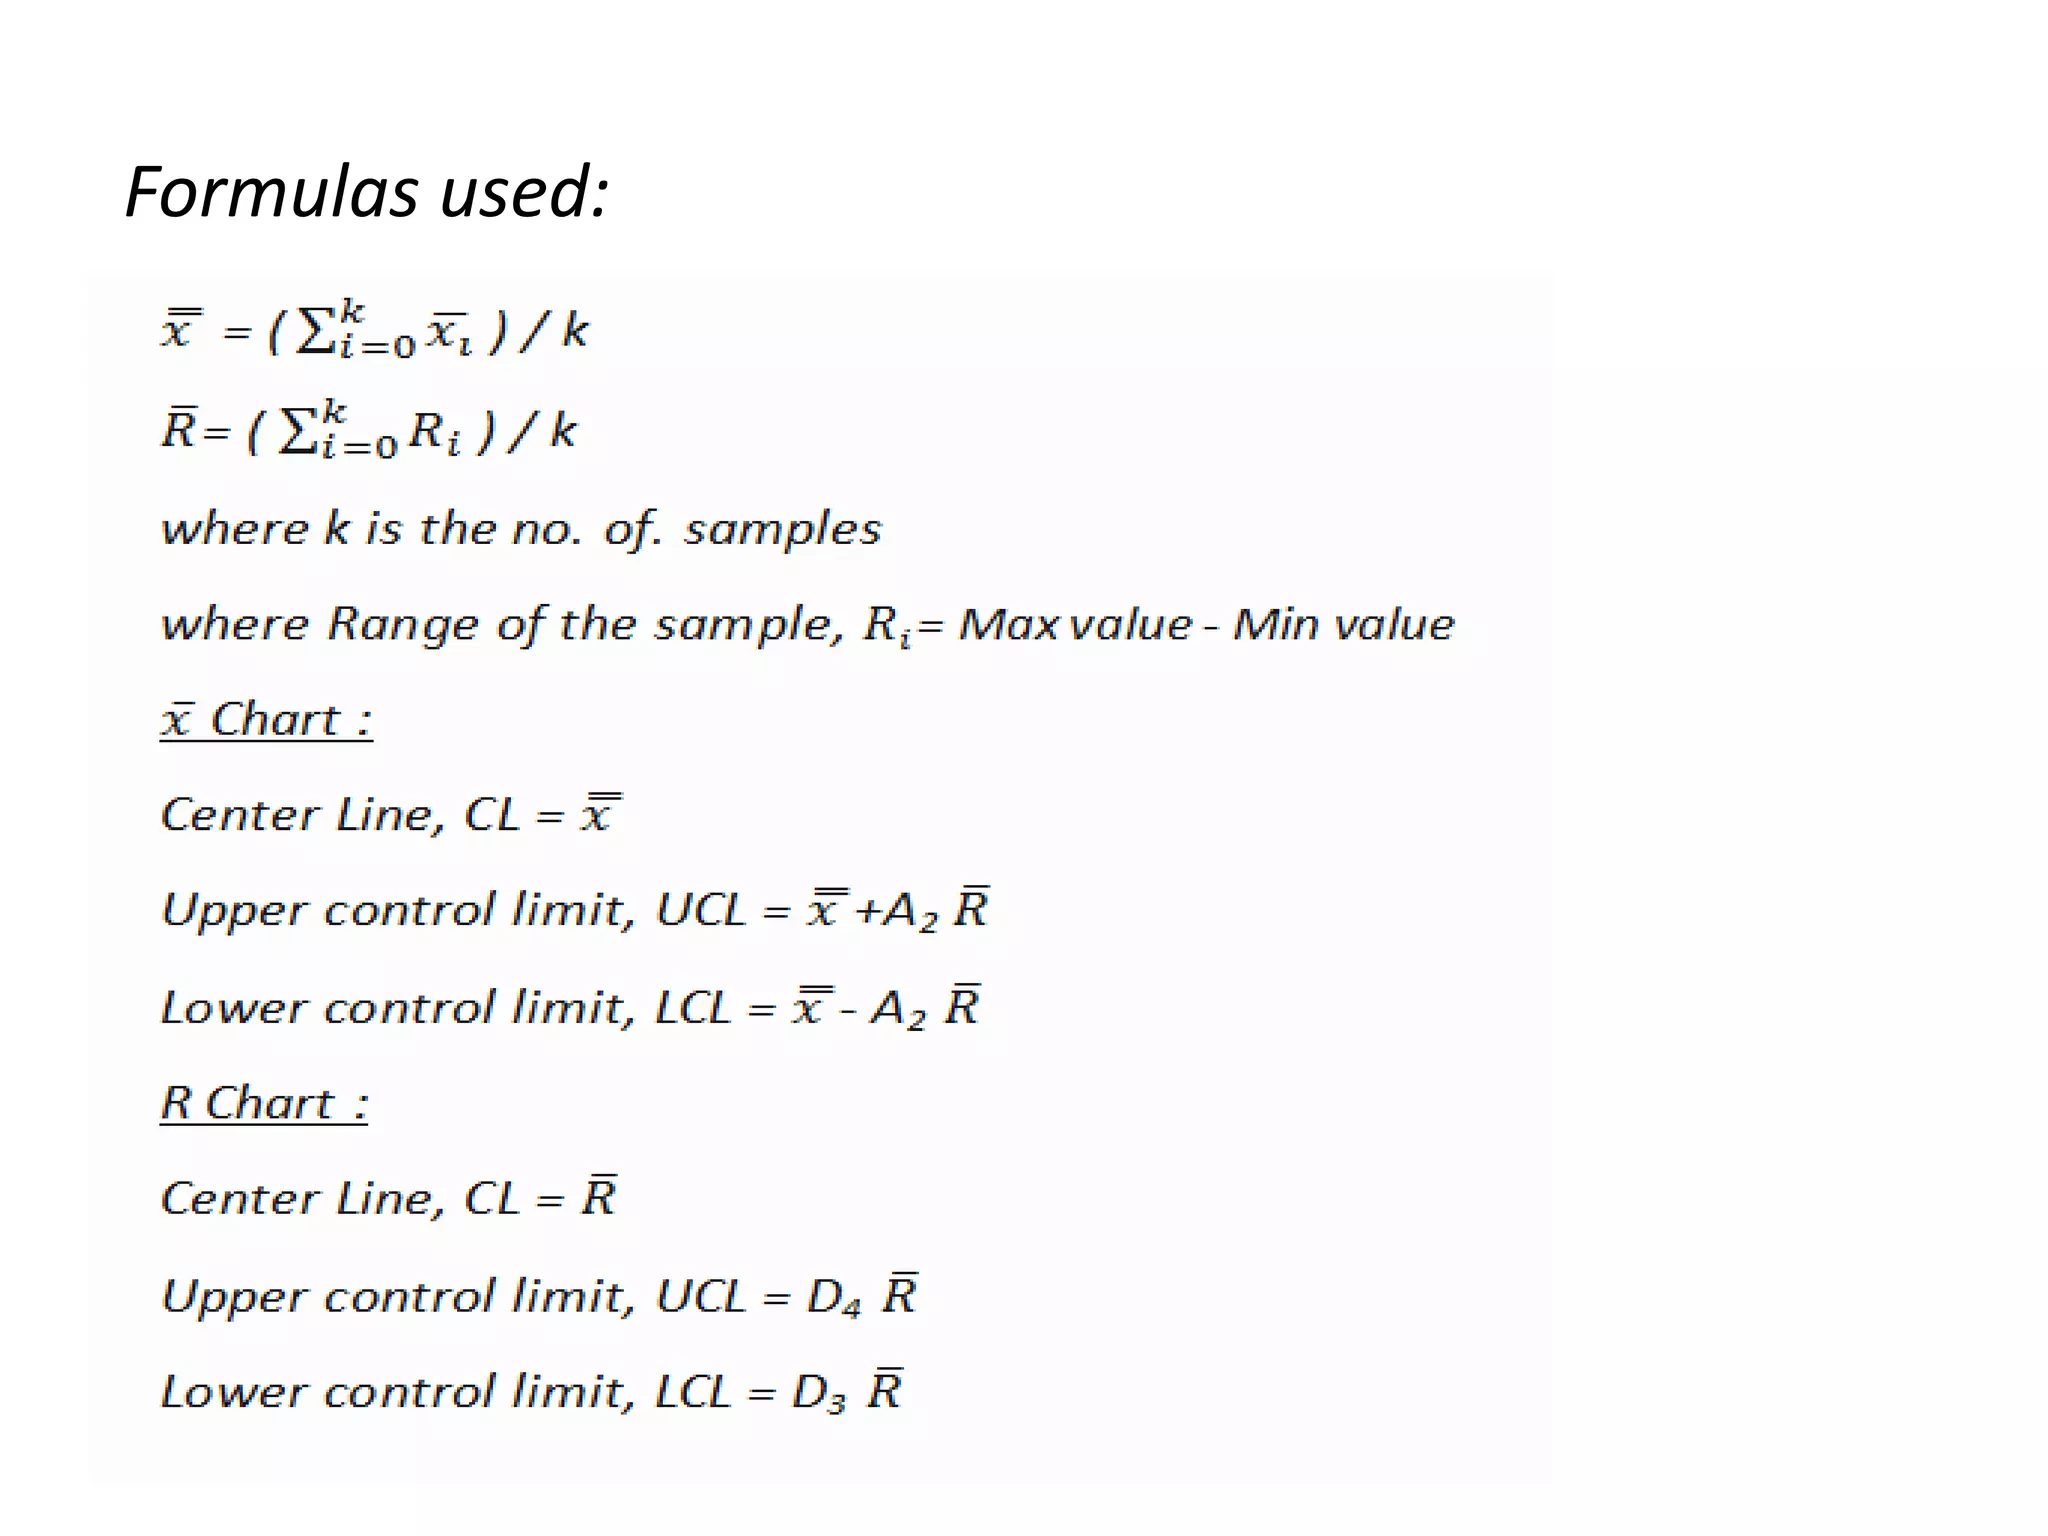
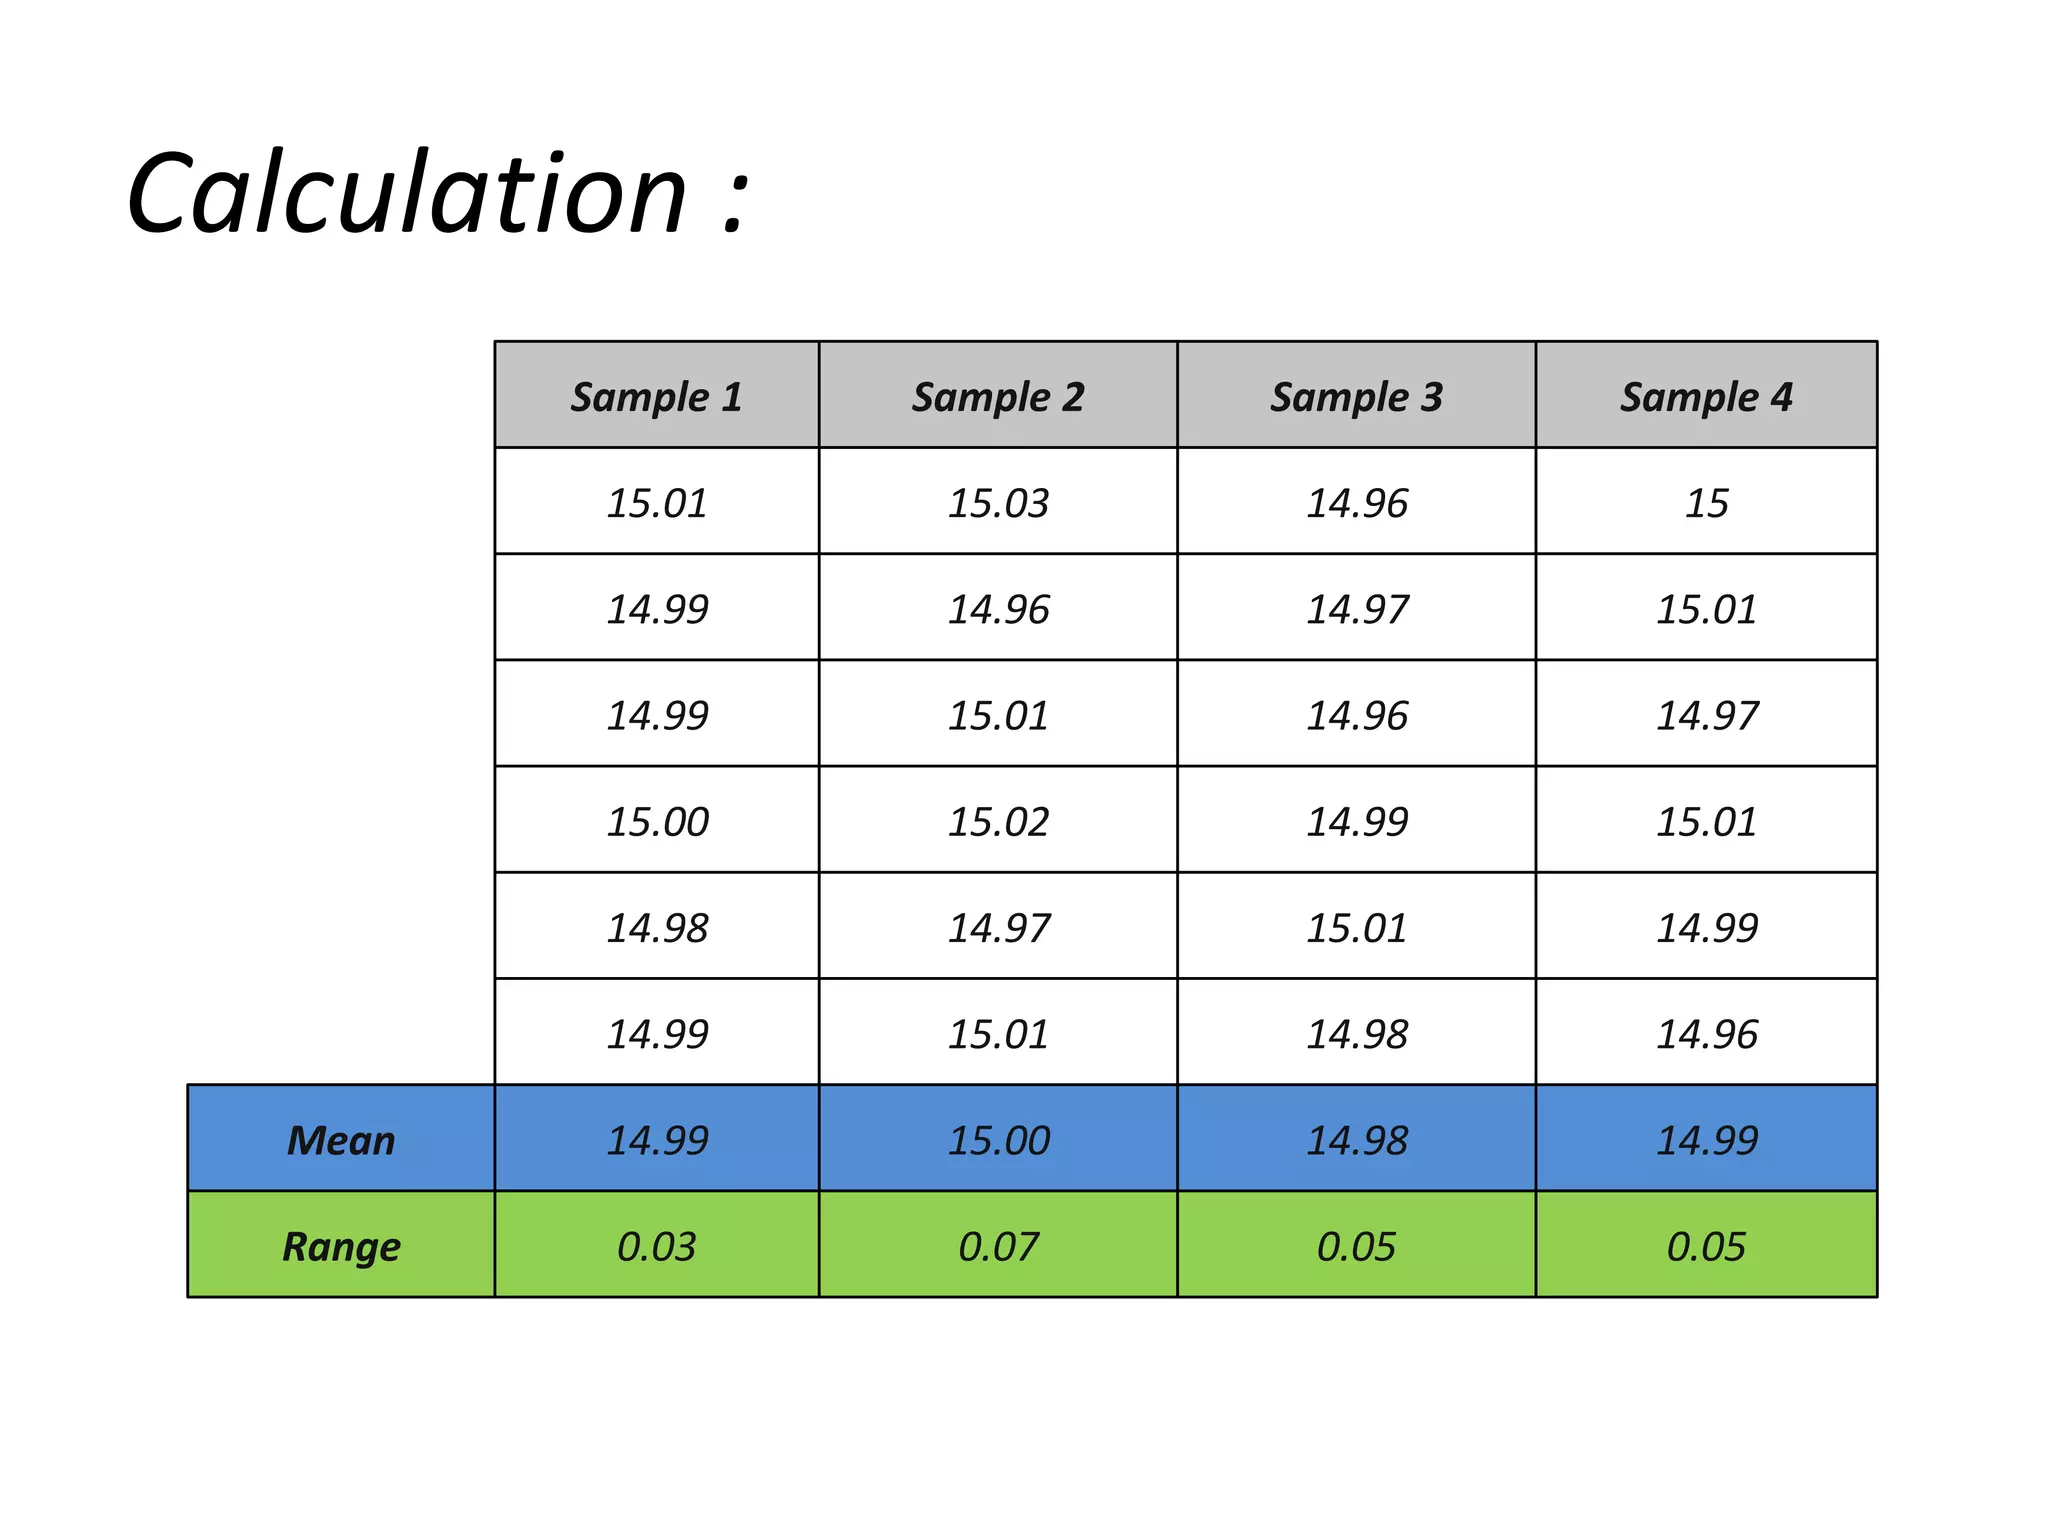
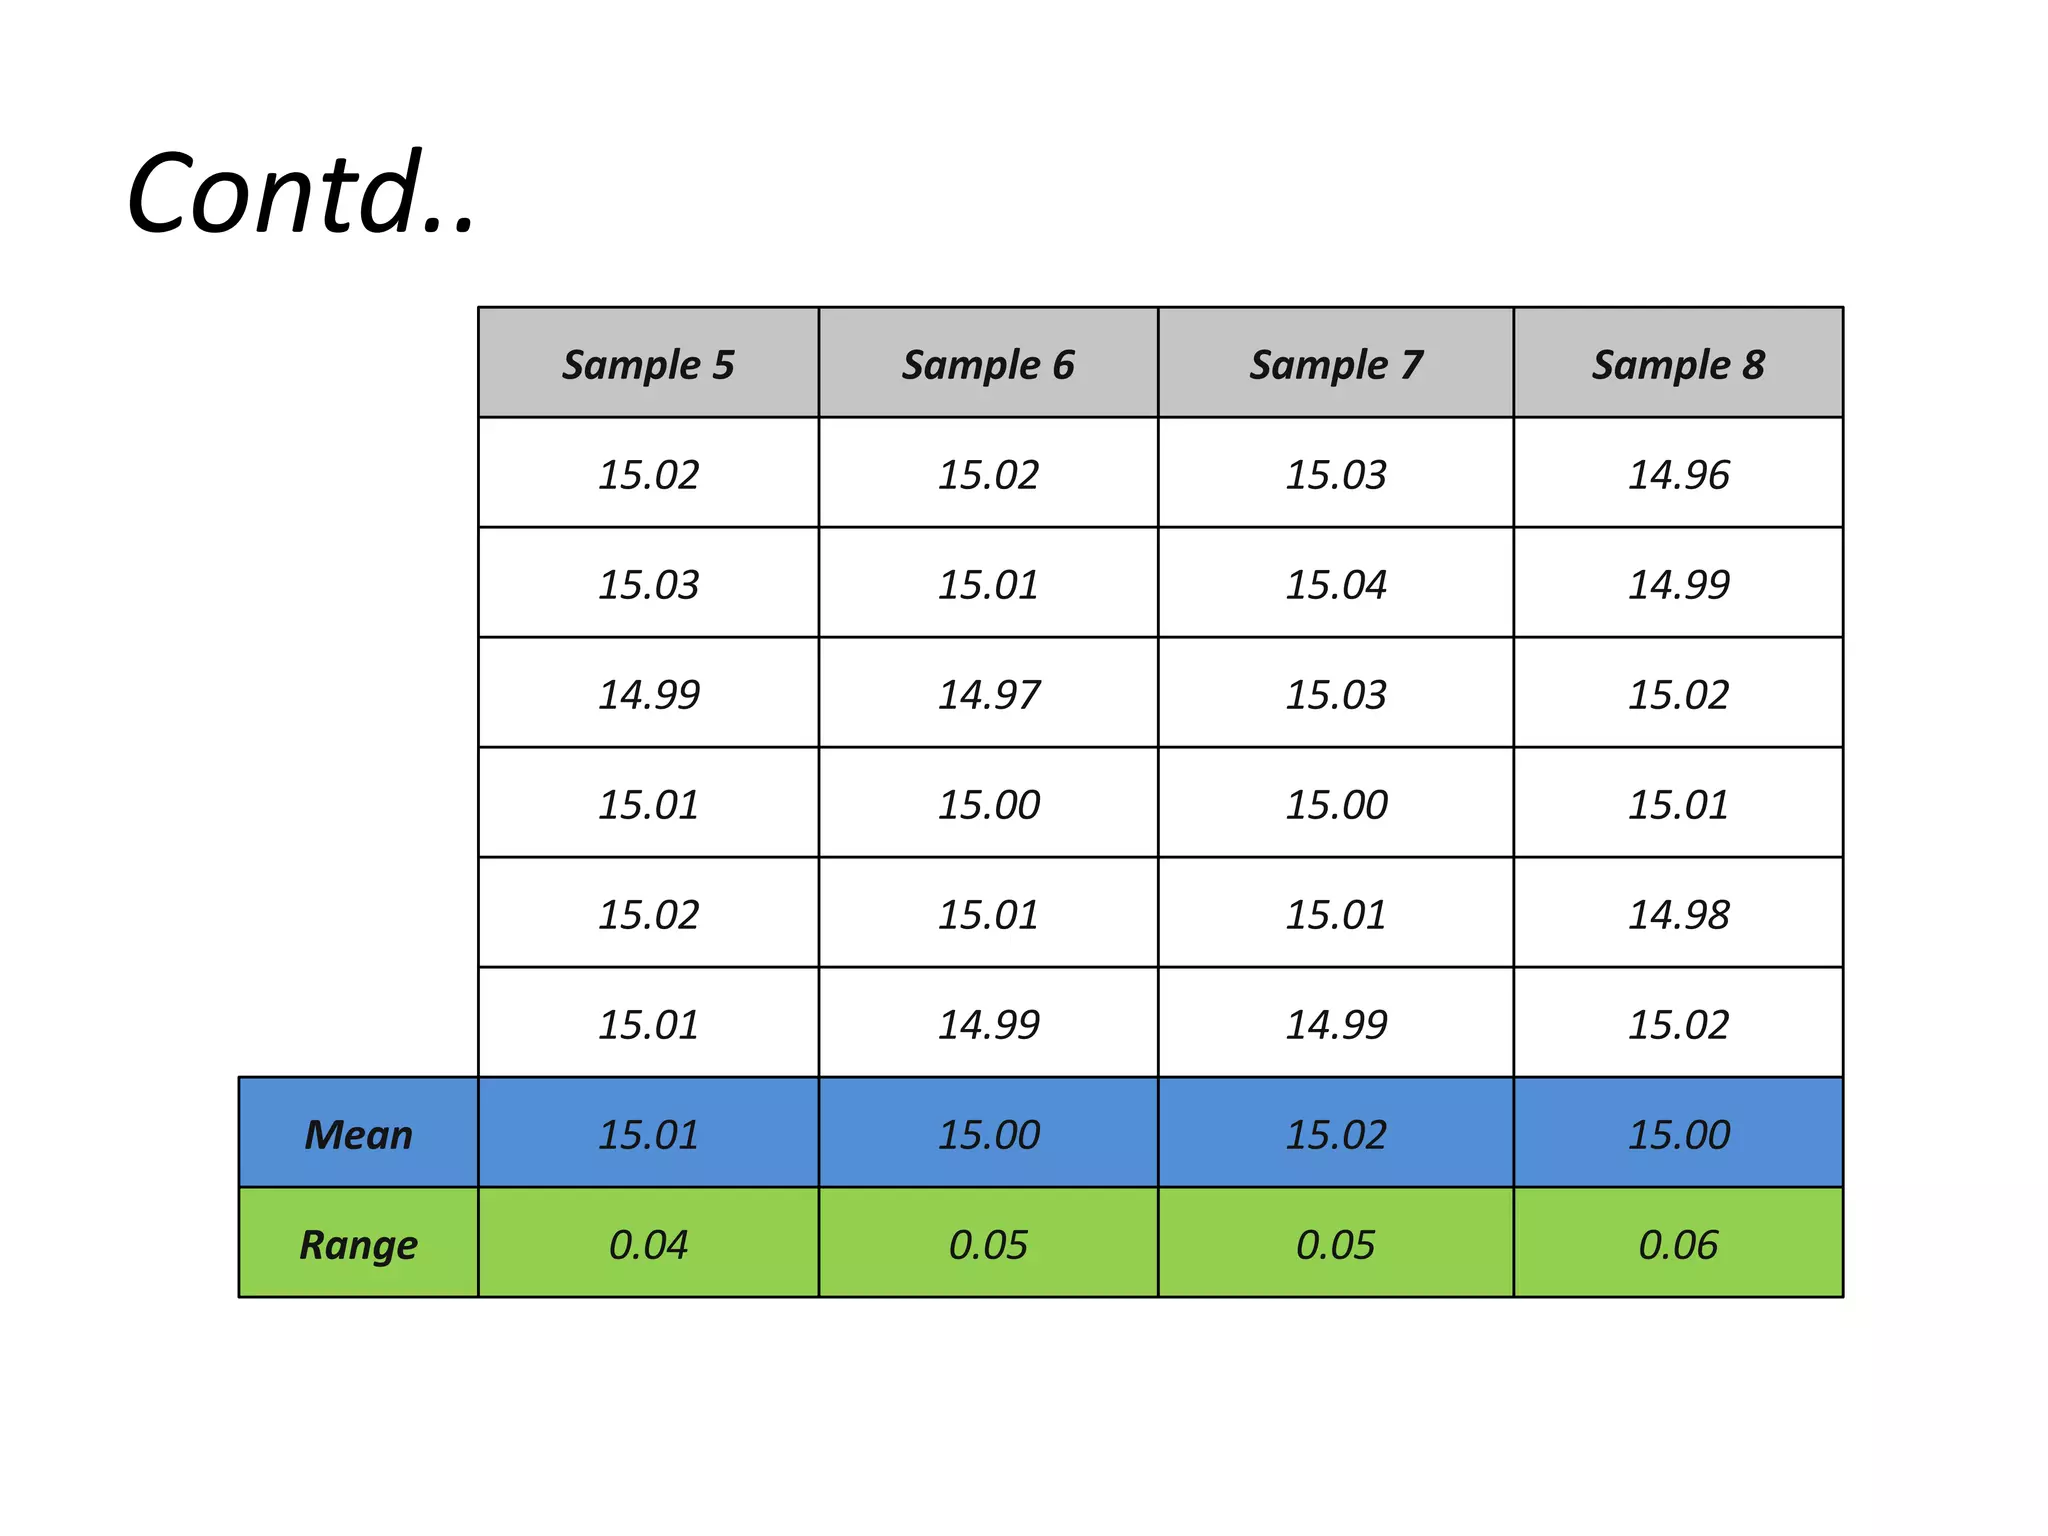
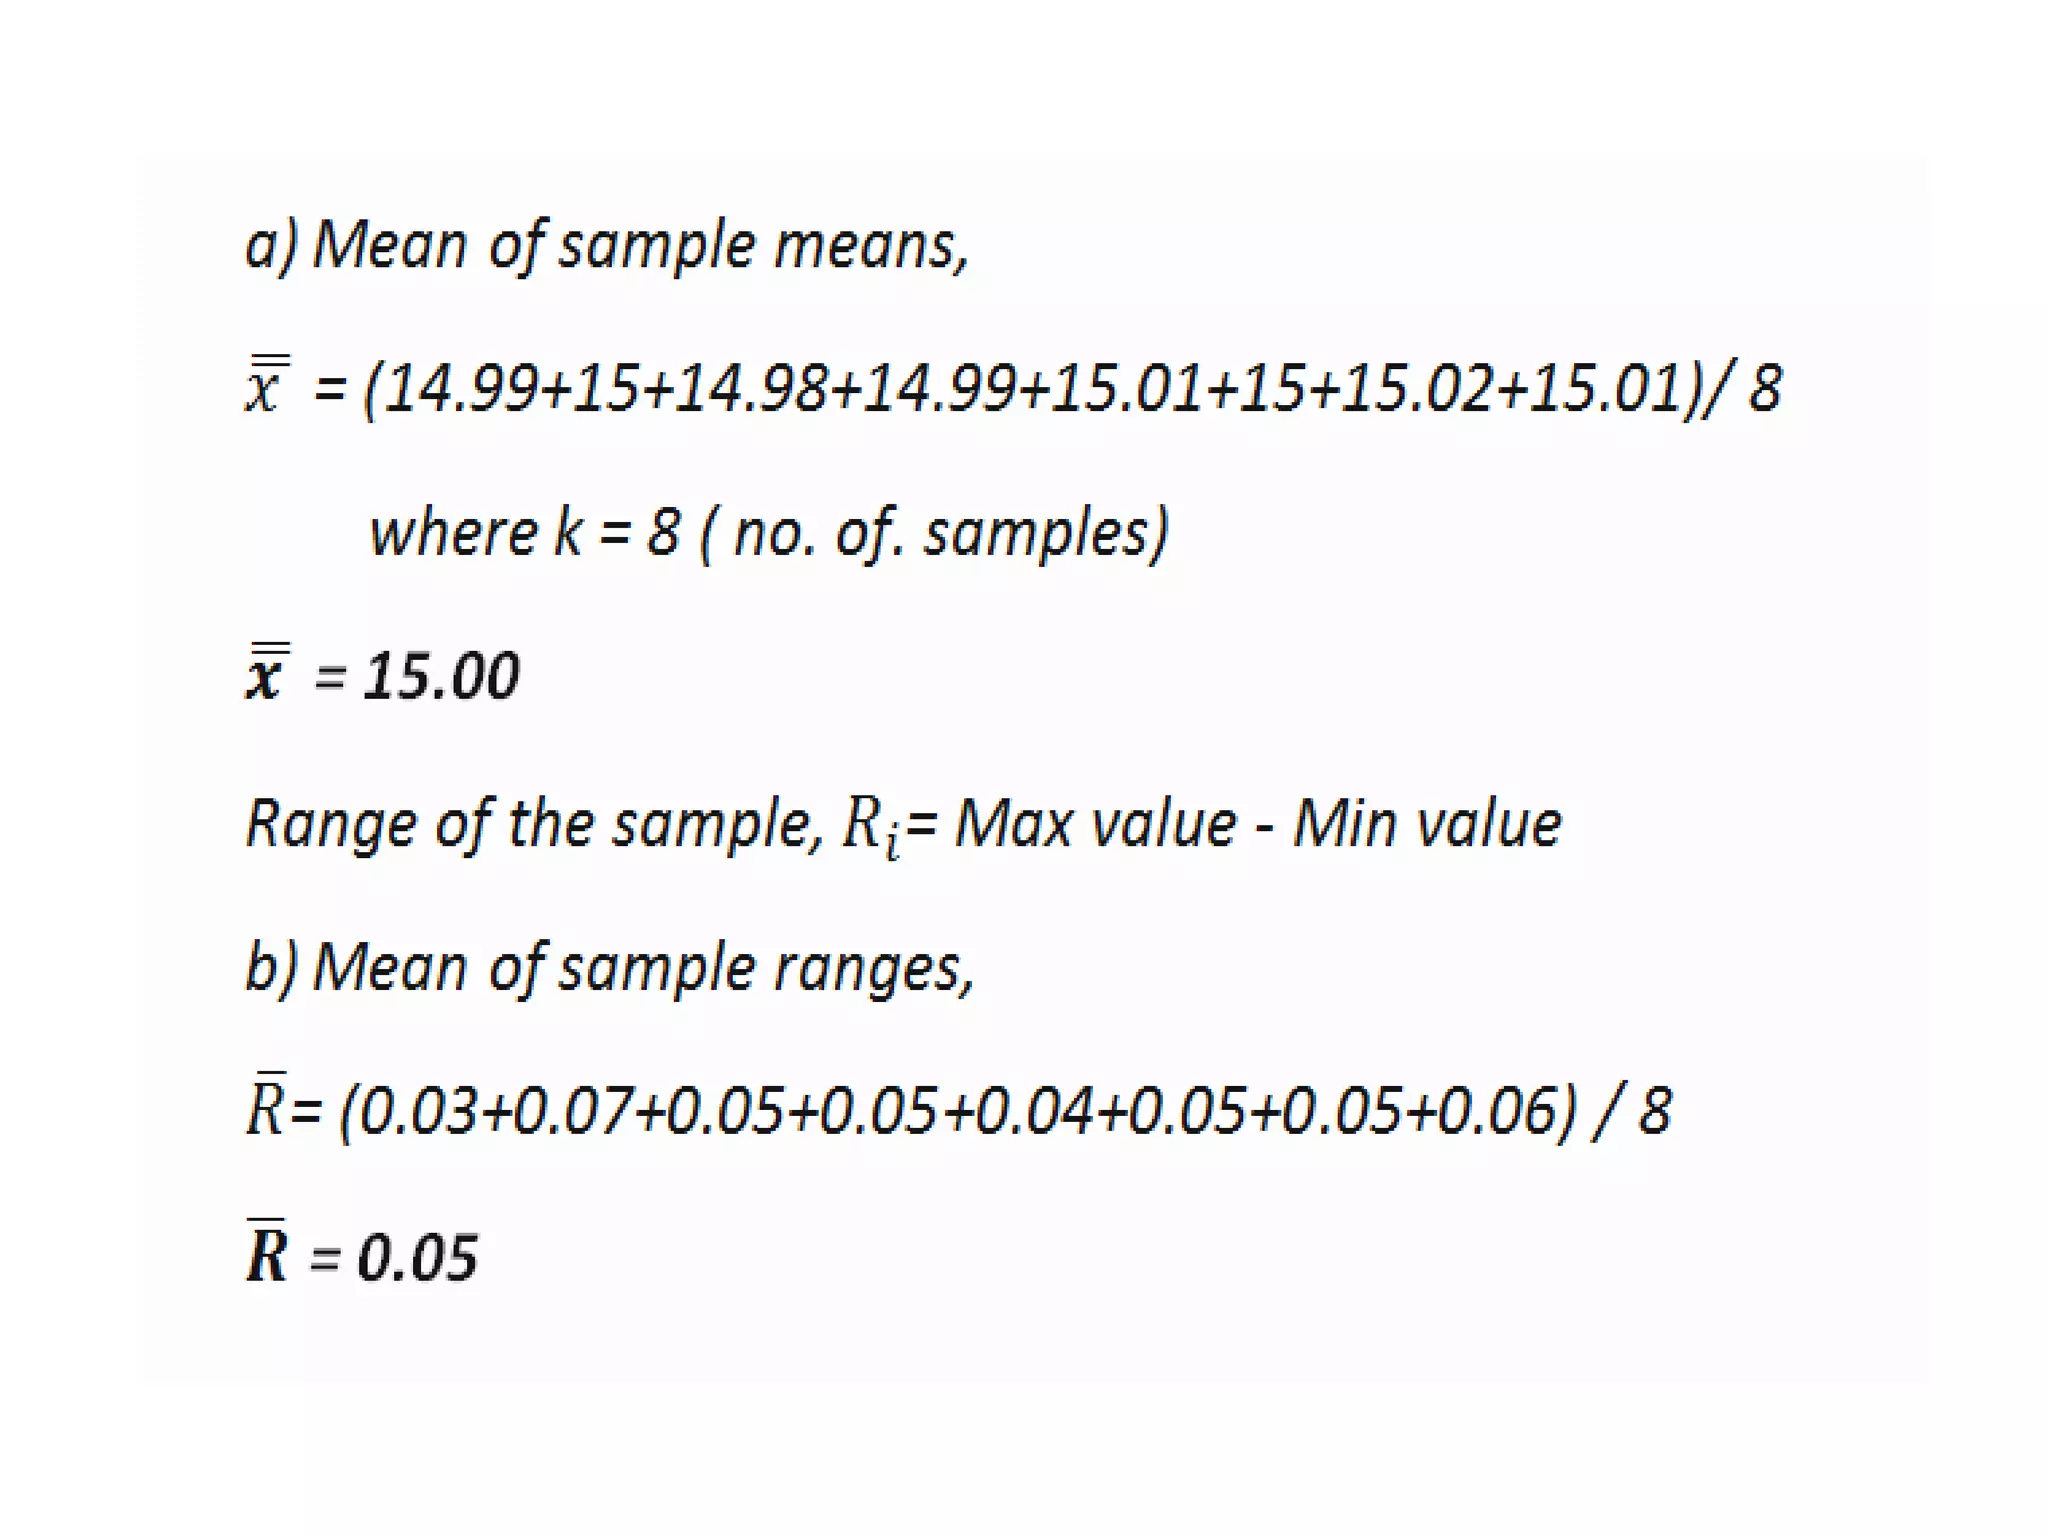
Explains SPC and its significance in quality control using statistical tools to monitor processes.Details a scenario involving the testing of digital watches, providing samples and the formulas used for calculations.
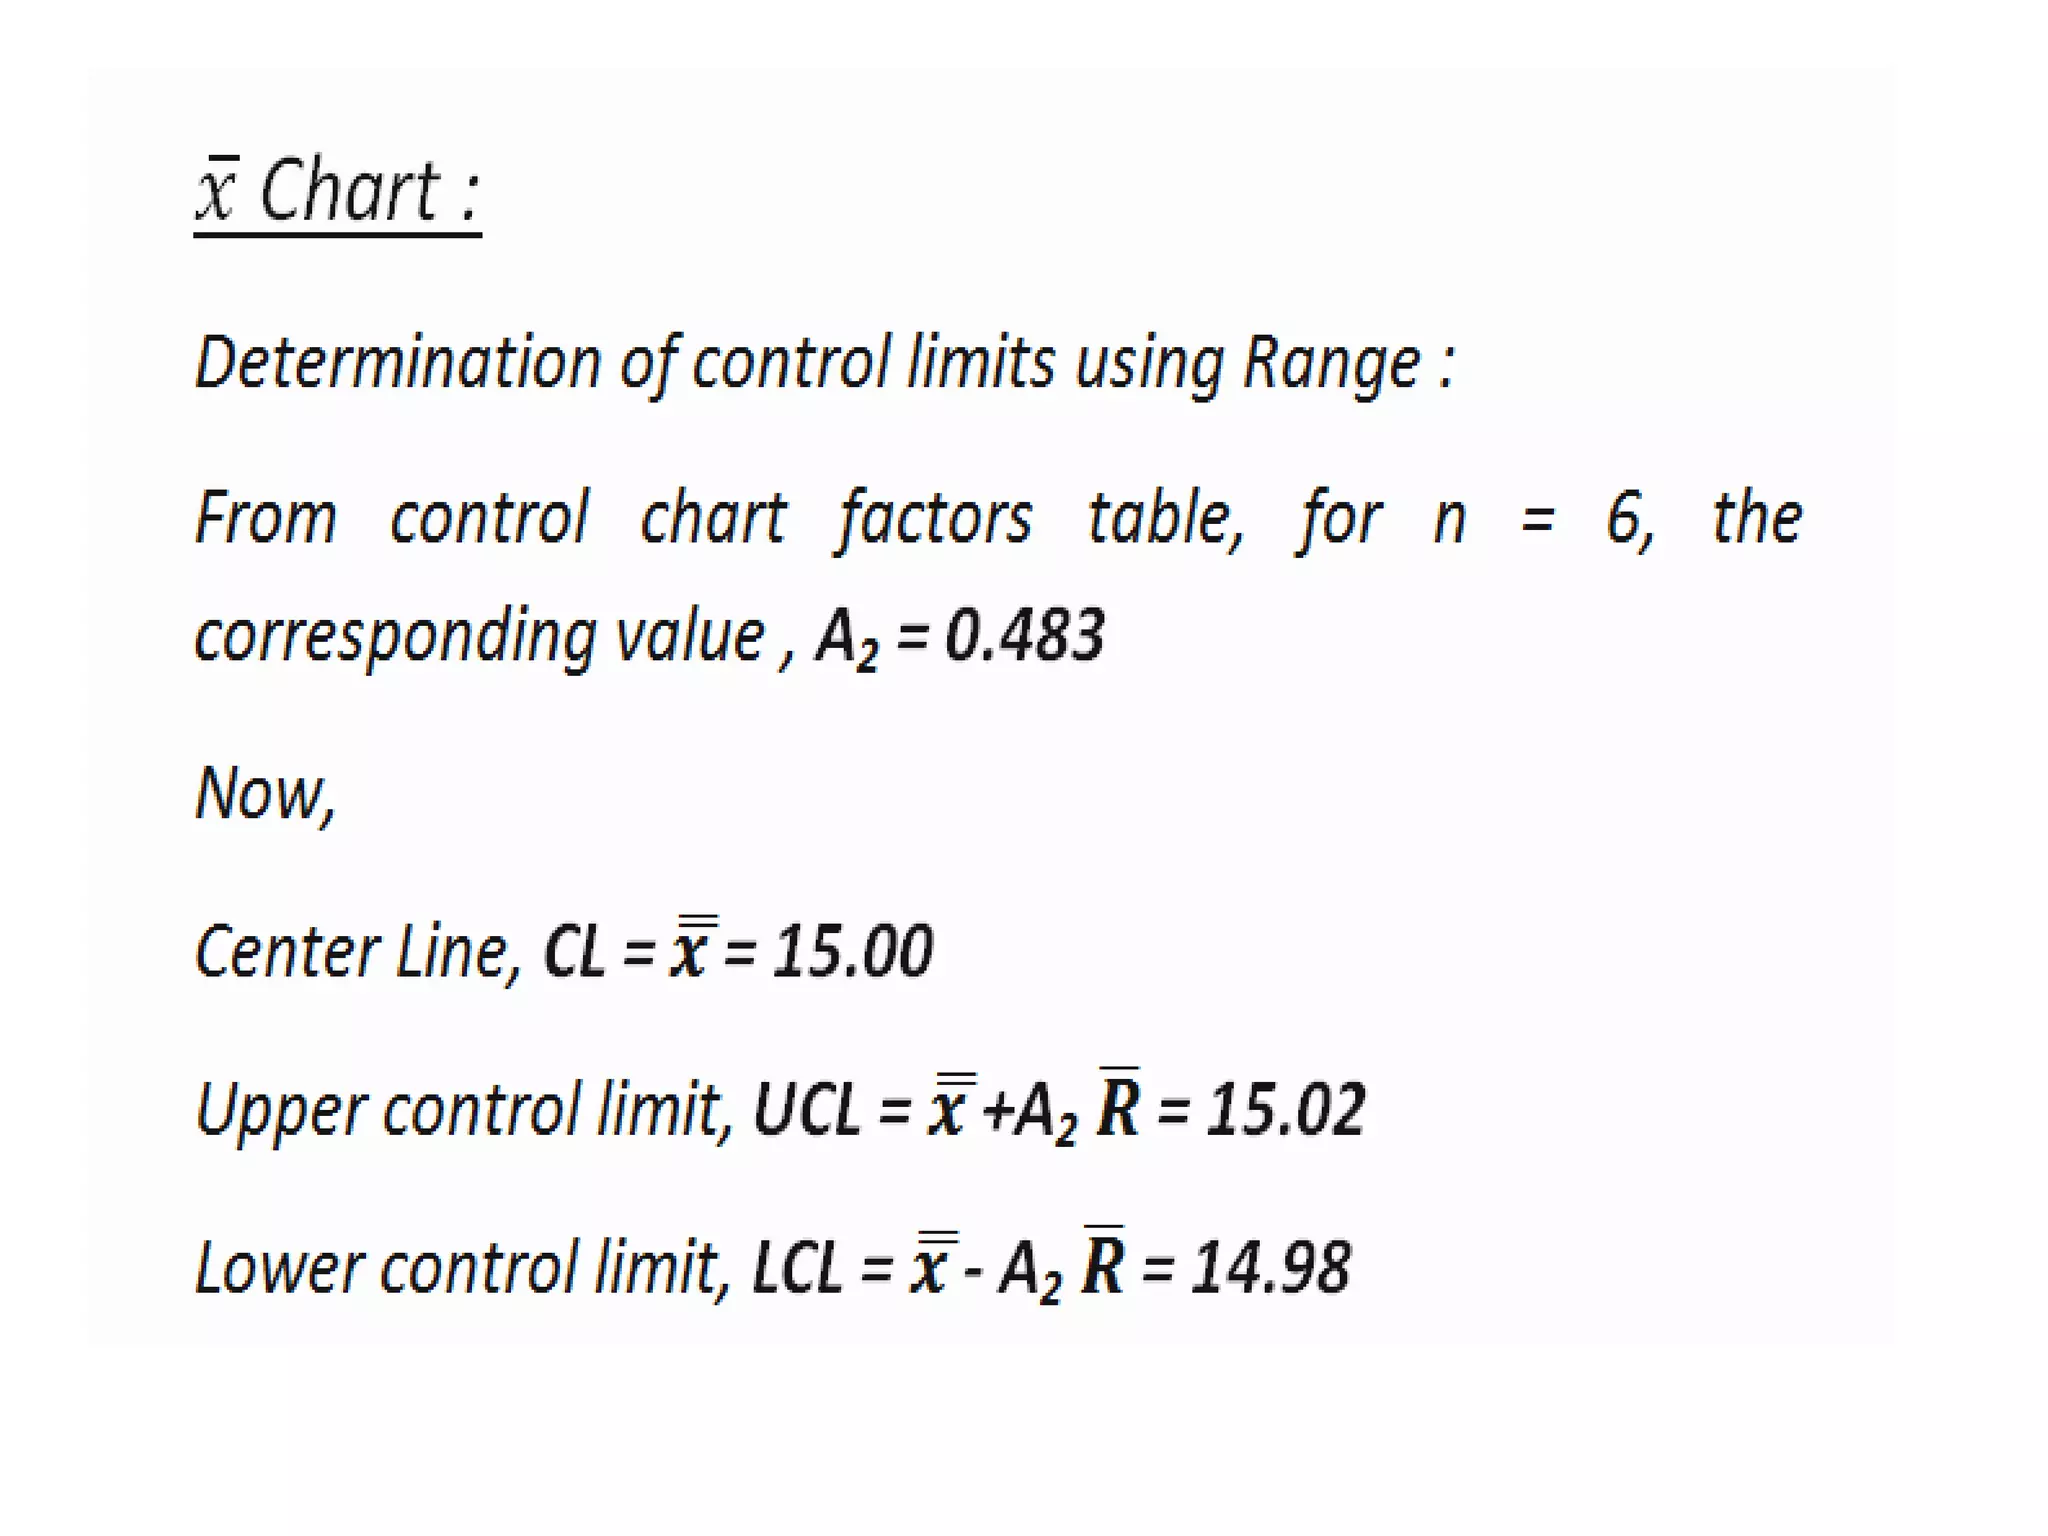
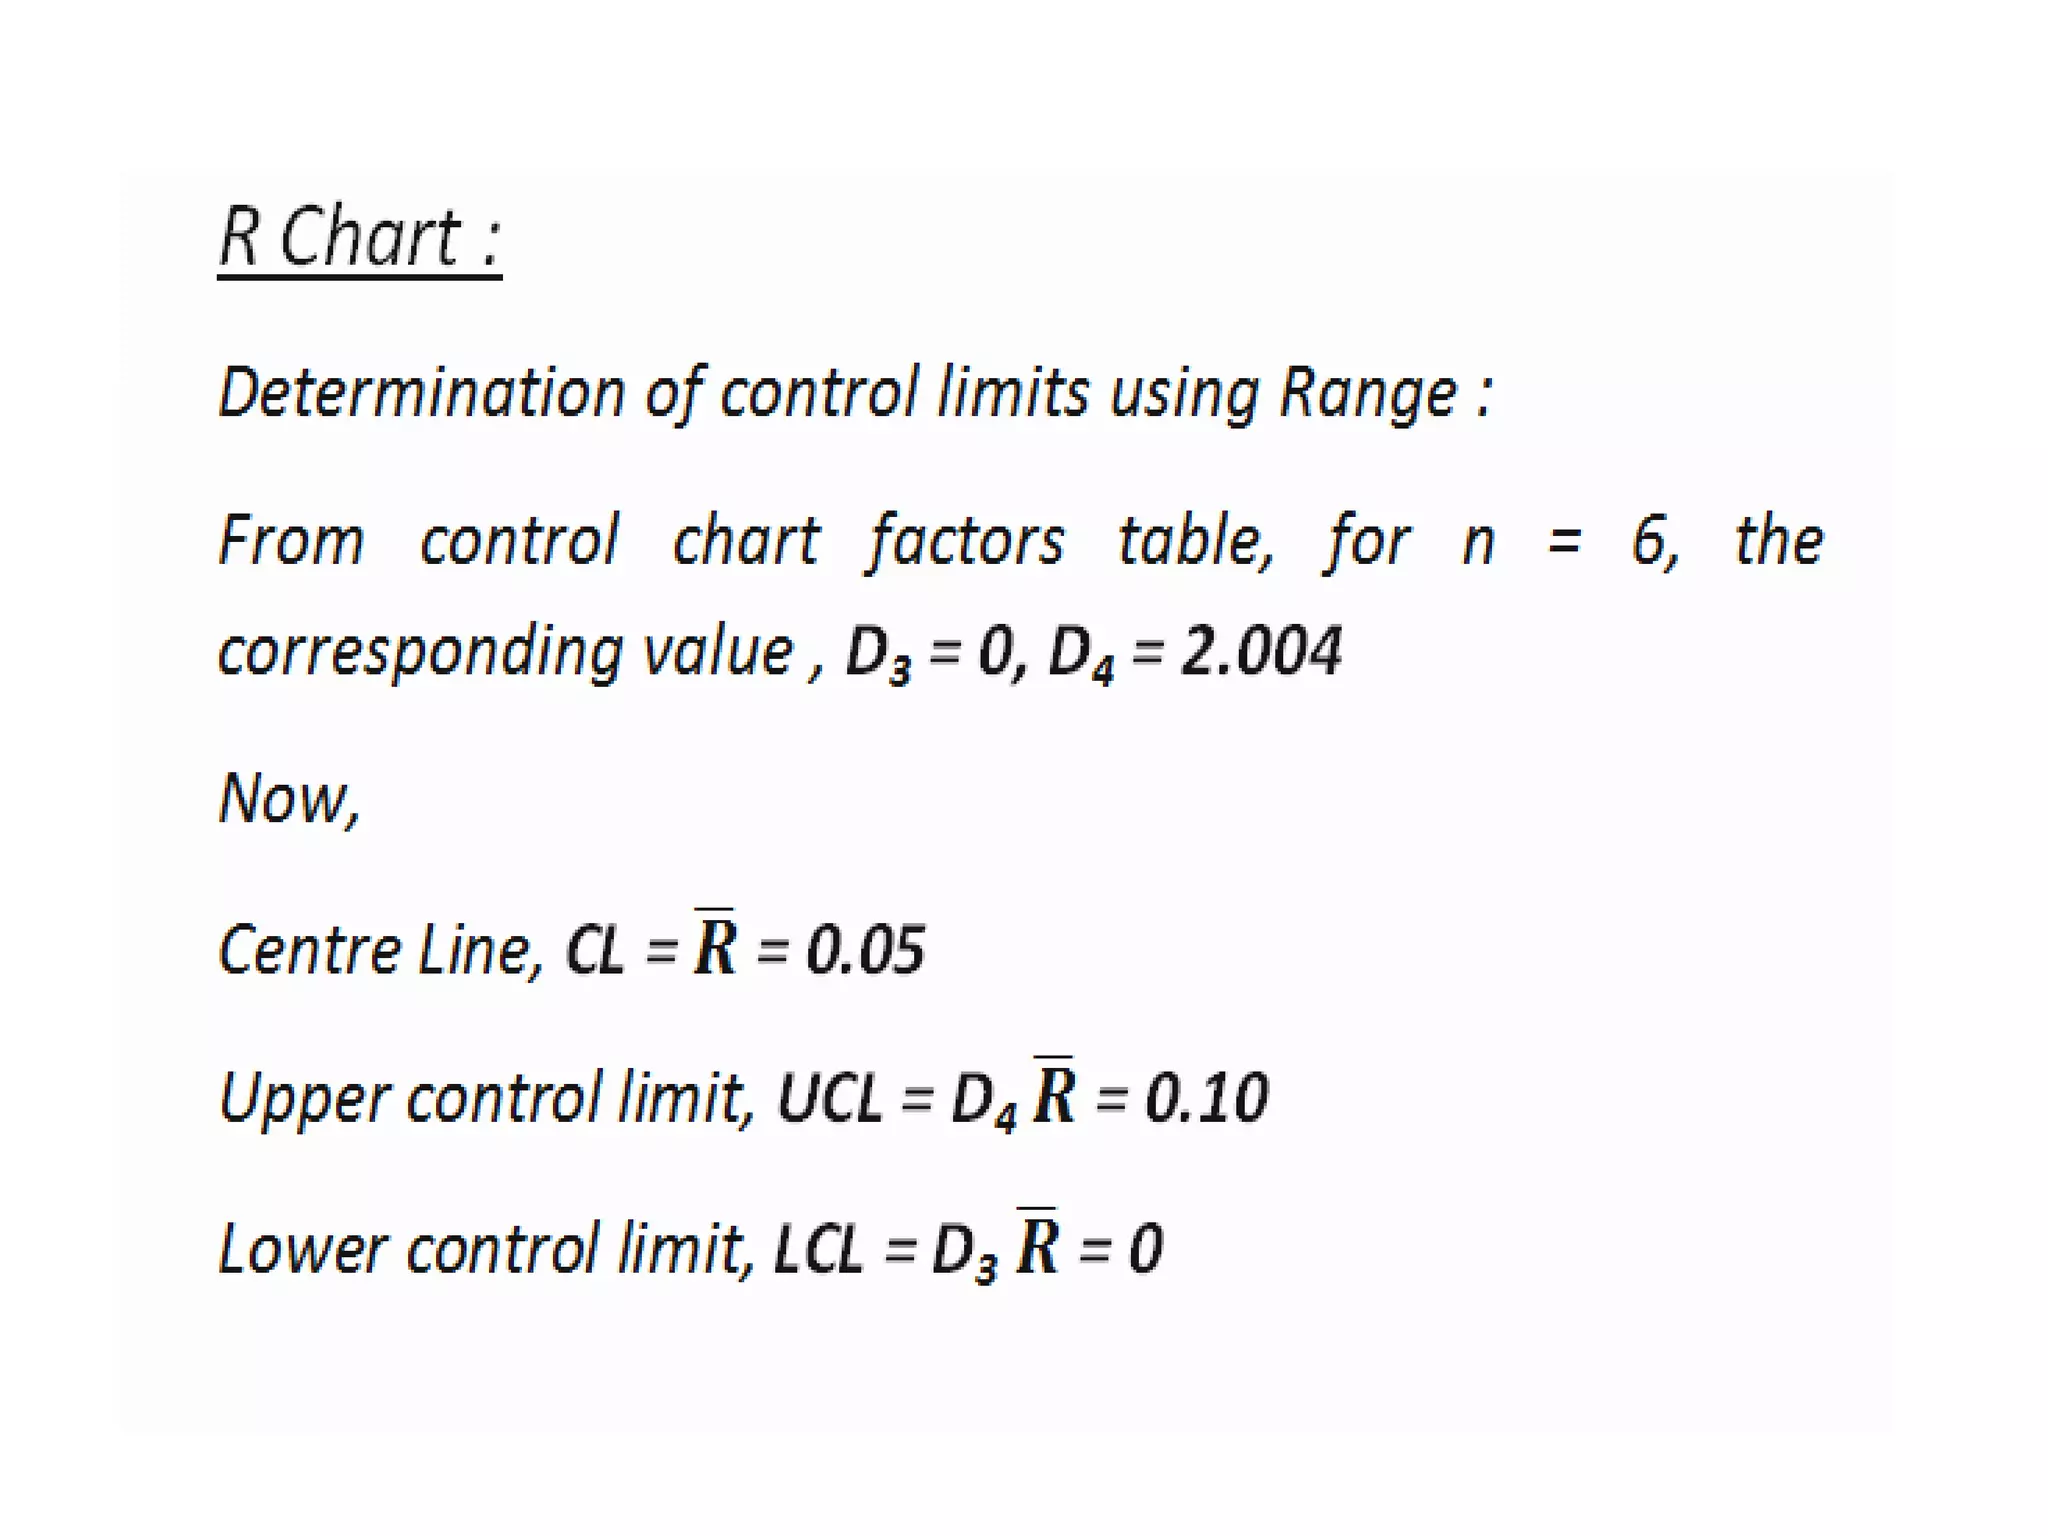
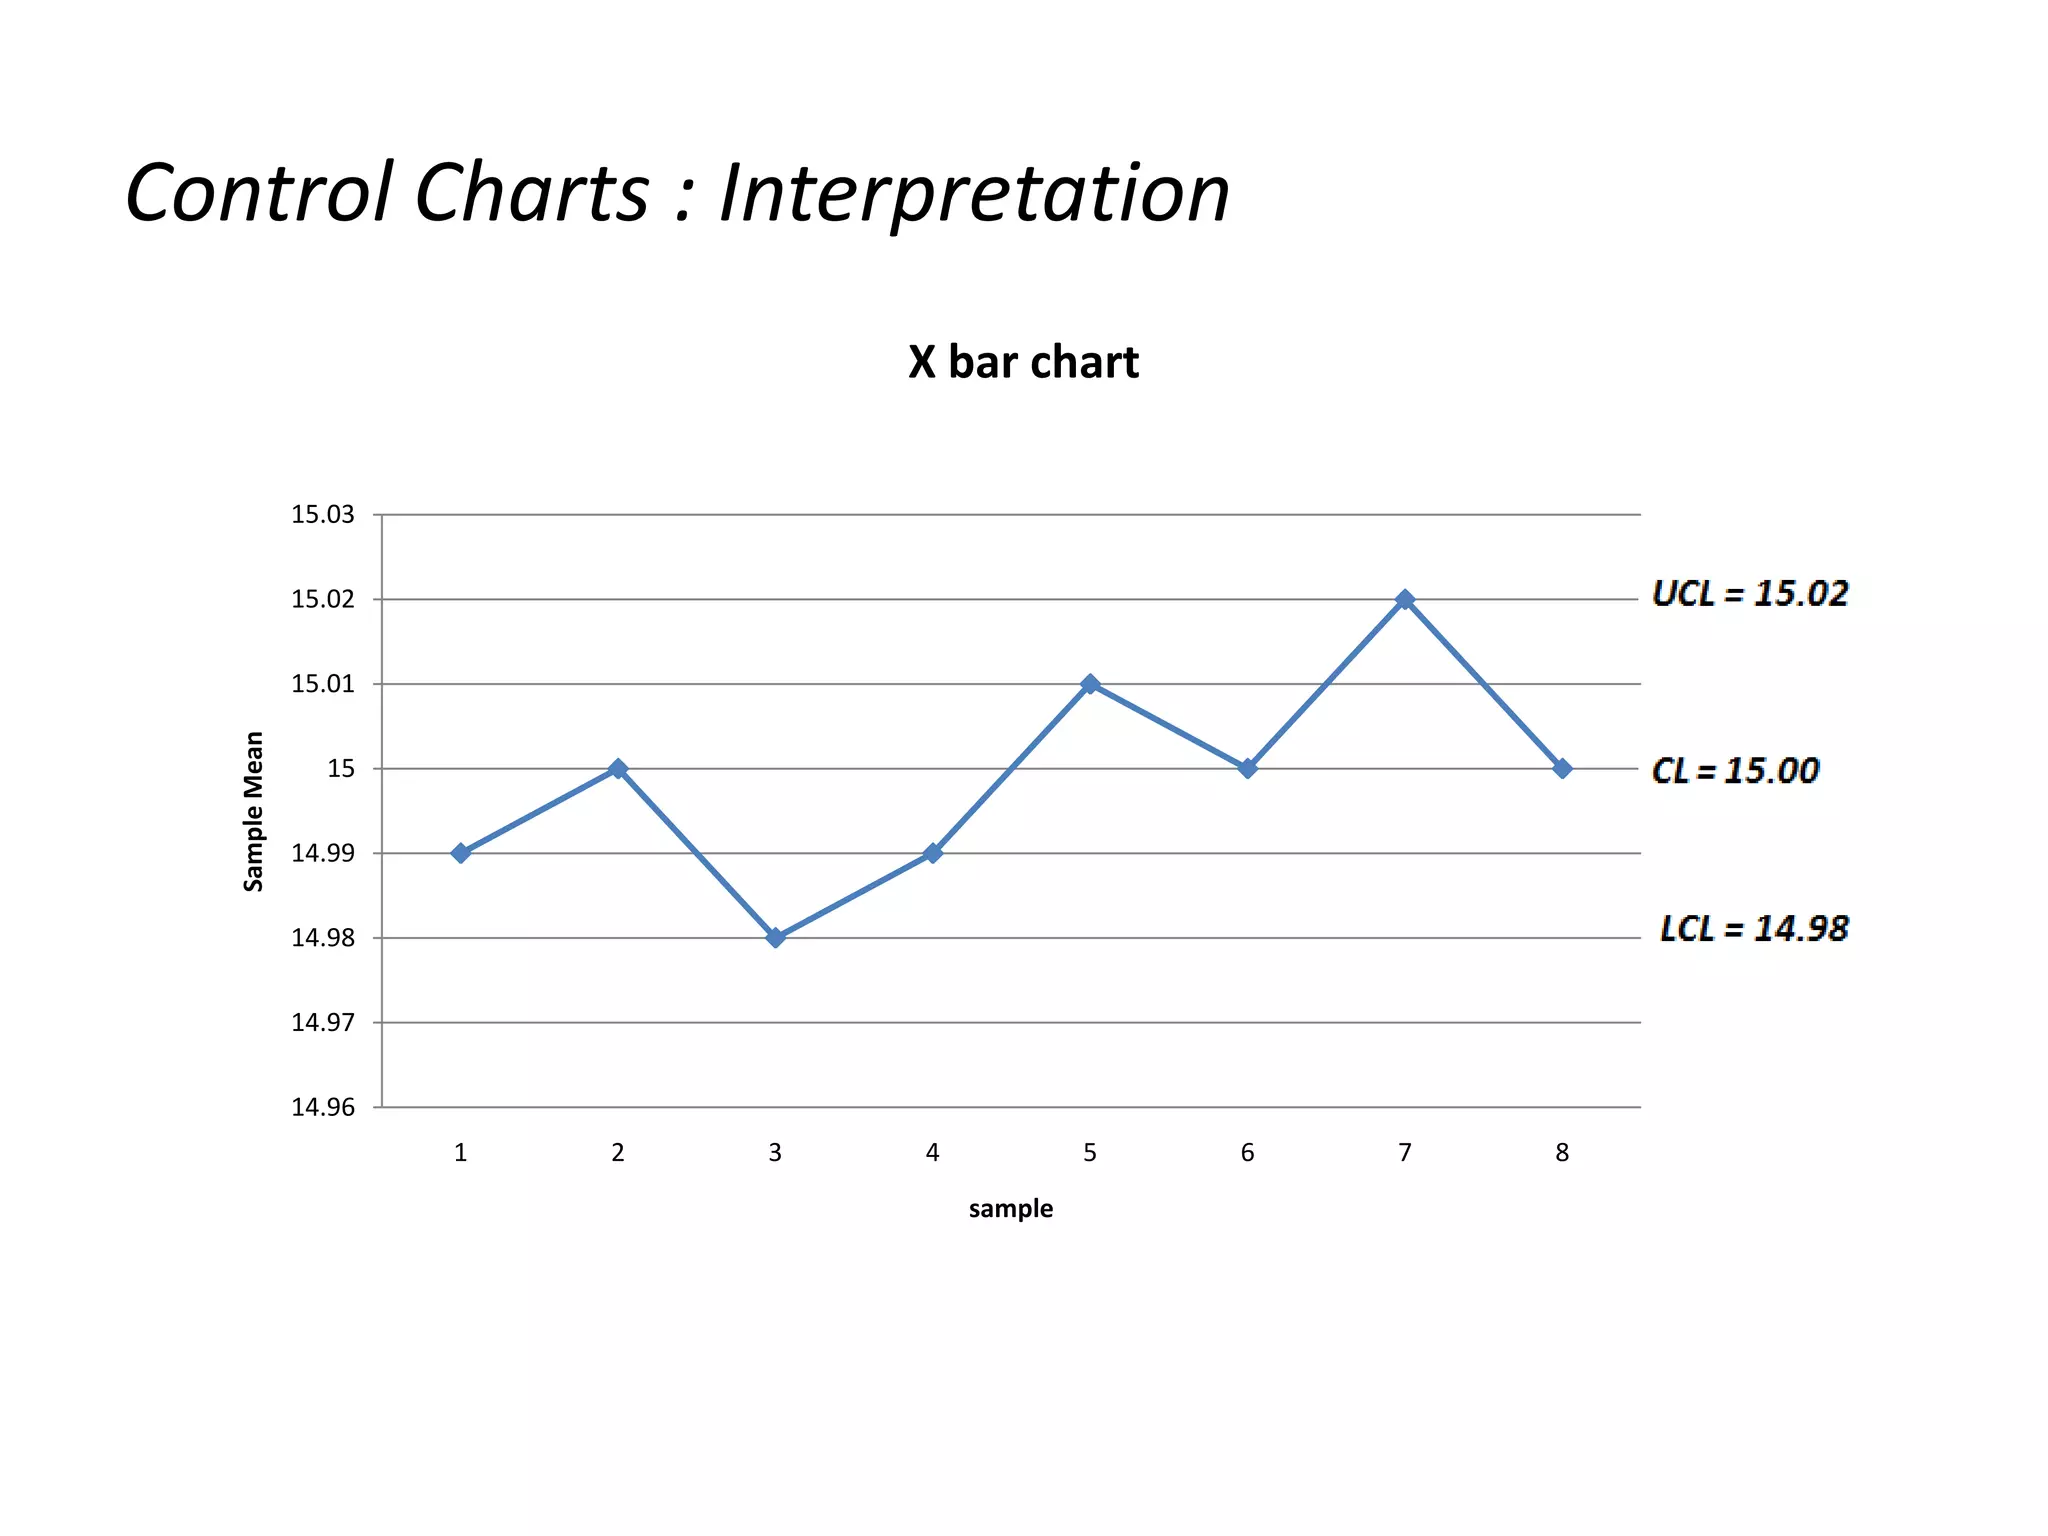
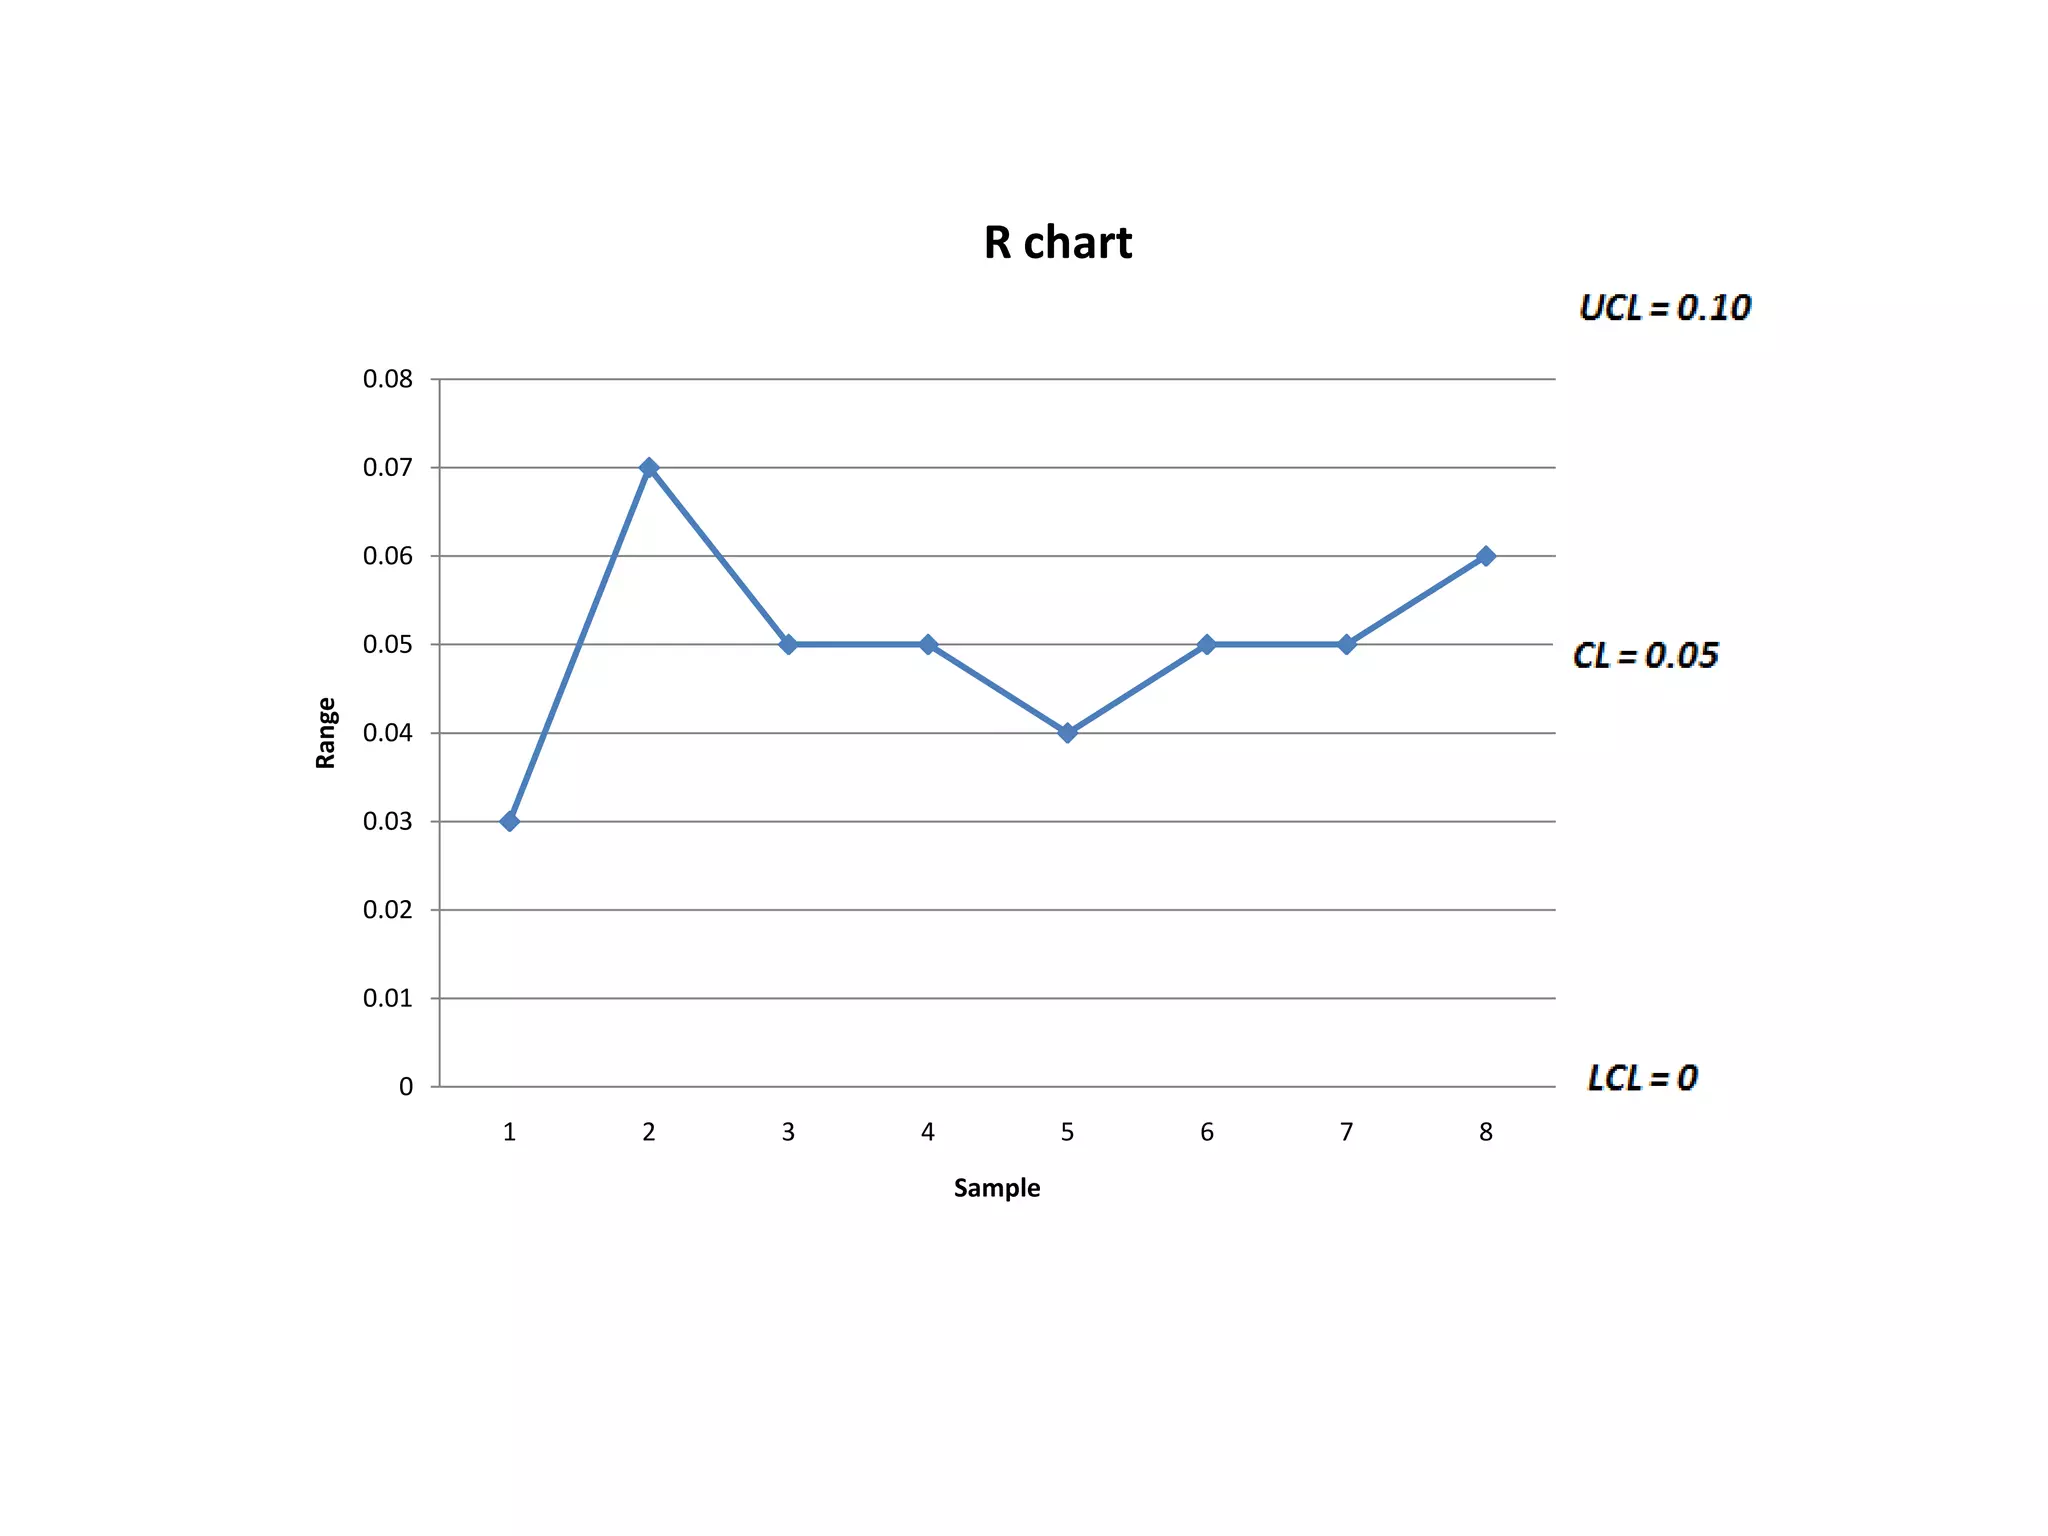
Presents control chart results (X bar and R charts) based on the calculated means and ranges for the samples.
Ending remarks and gratitude to the audience.


![Control Charts[1]](https://cdn.slidesharecdn.com/ss_thumbnails/controlcharts1-1226081330857138-9-thumbnail.jpg?width=640&height=640&fit=bounds)


