Downloaded 100 times
![Lynn Cherny, Ghostweather R&D LLCA social network is a social structuremade up of individuals (or organizations) called "nodes", which are tied (connected) by one or more specific types of interdependency, such as friendship, kinship, common interest, financial exchange, dislike, sexual relationships, or relationships of beliefs, knowledge or prestige. [--Wikipedia]Postdoc at Indiana University ad:“Areas of focus will include information diffusion patterns, epidemic models for the spread of ideas, interactions between network traffic and structure dynamics, and agent-based models to explain the emergence of viral bursts of attention.](https://image.slidesharecdn.com/simplifyingsocialnetworks-upashorttalk-110923161801-phpapp02/75/Simplifying-Social-Network-Diagrams-3-2048.jpg)
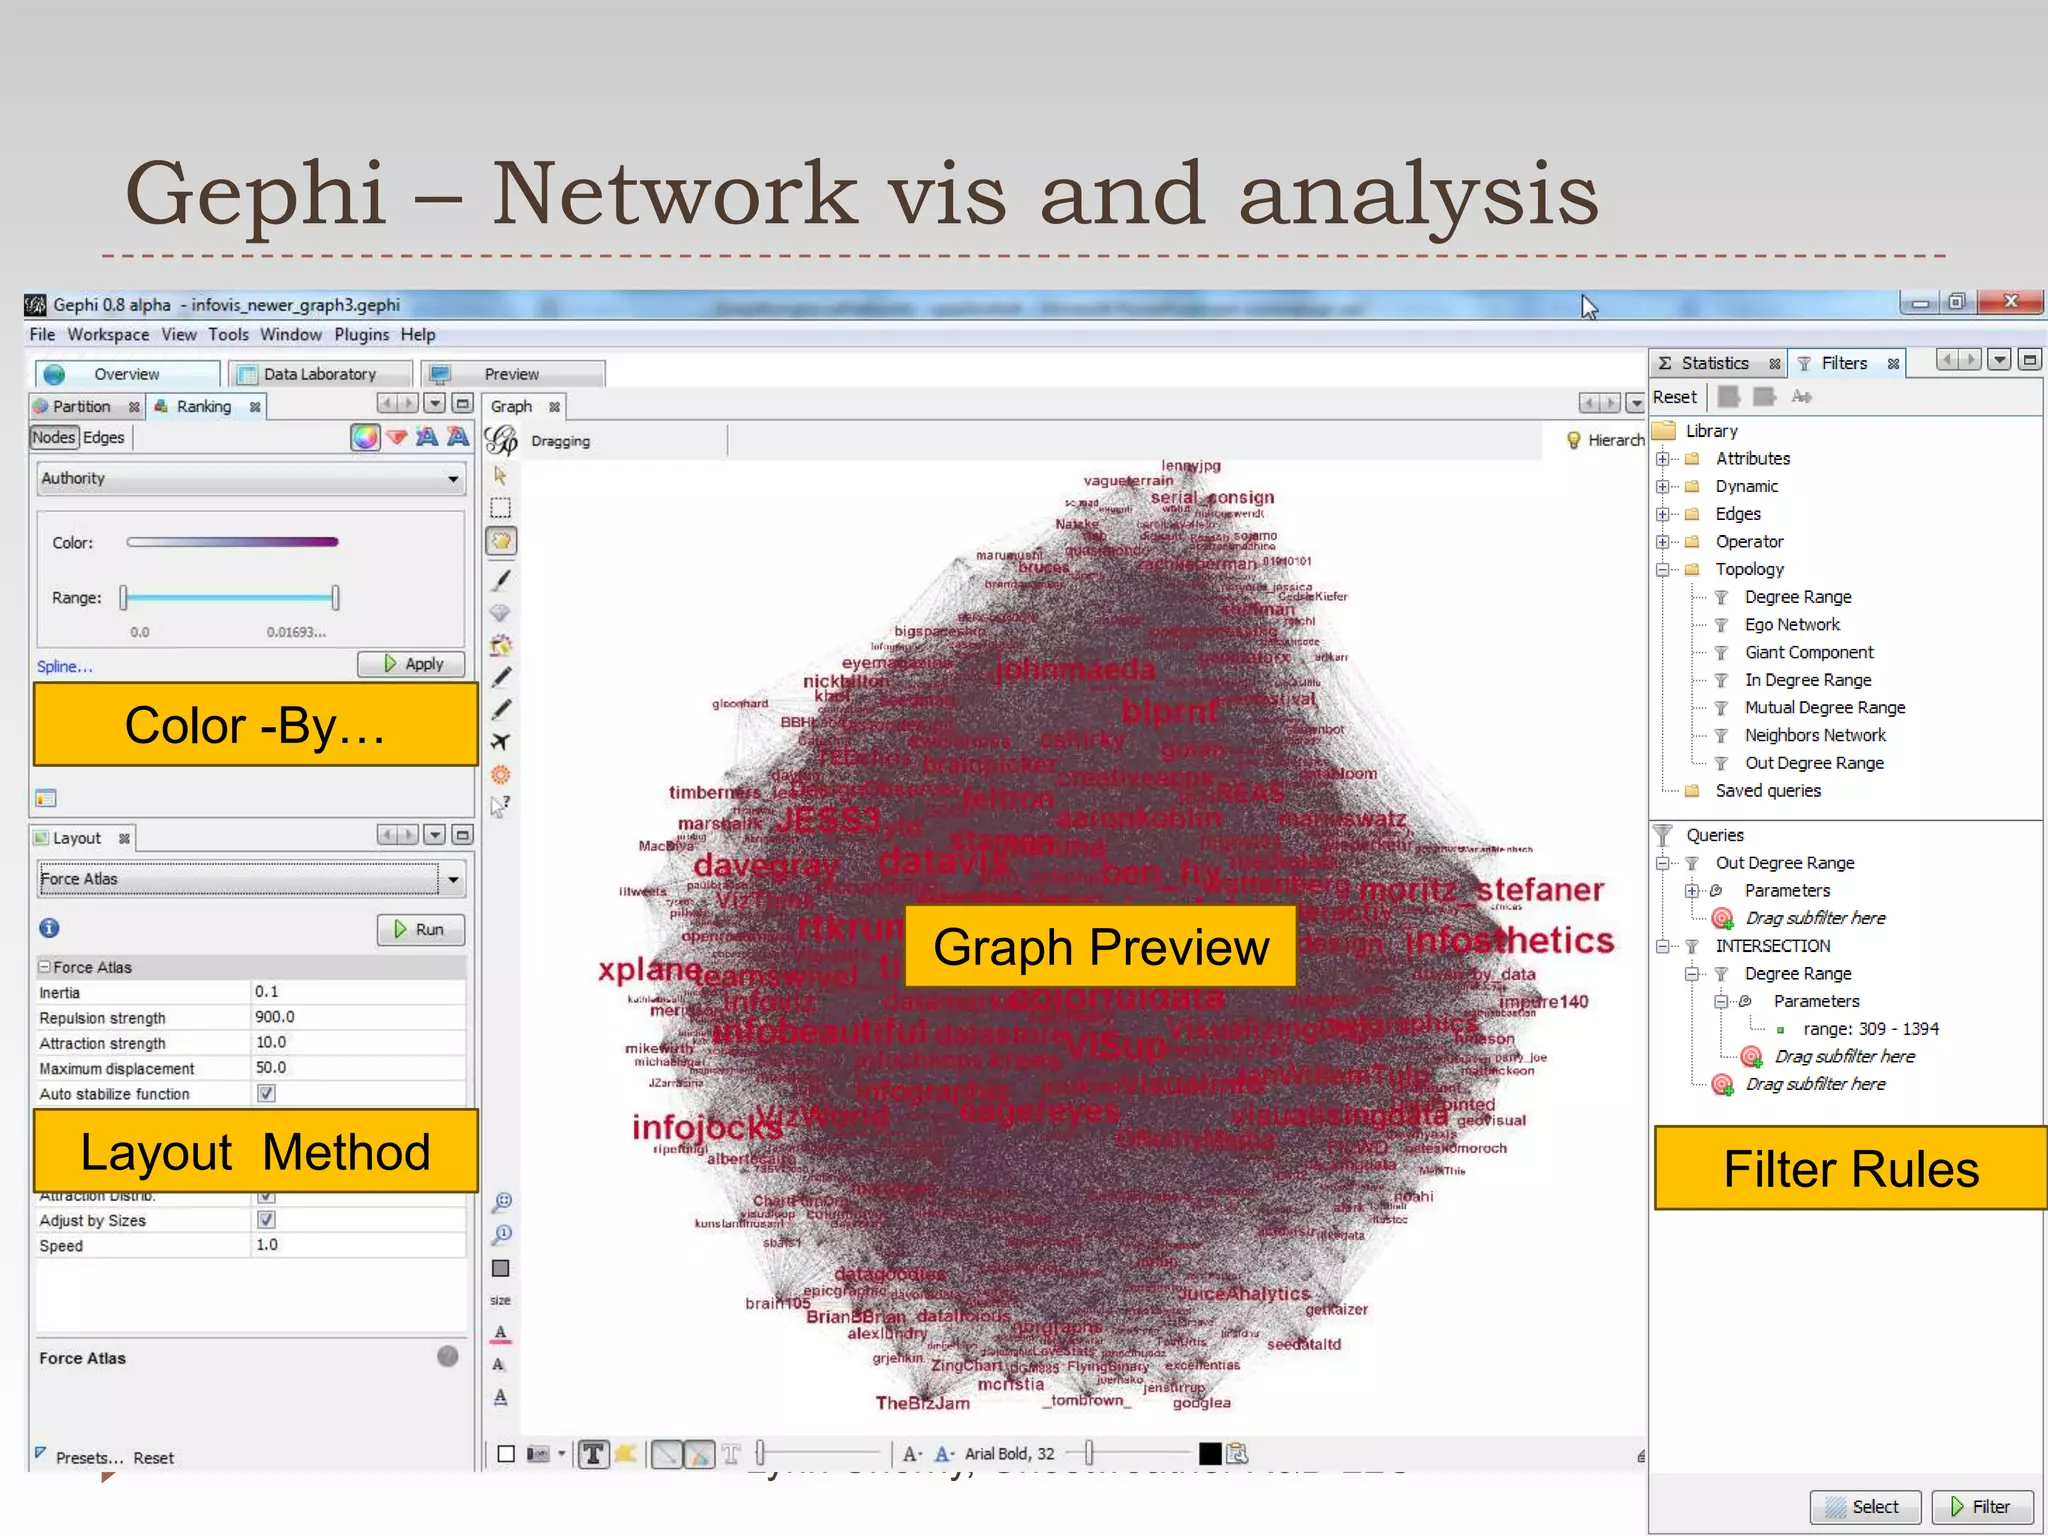
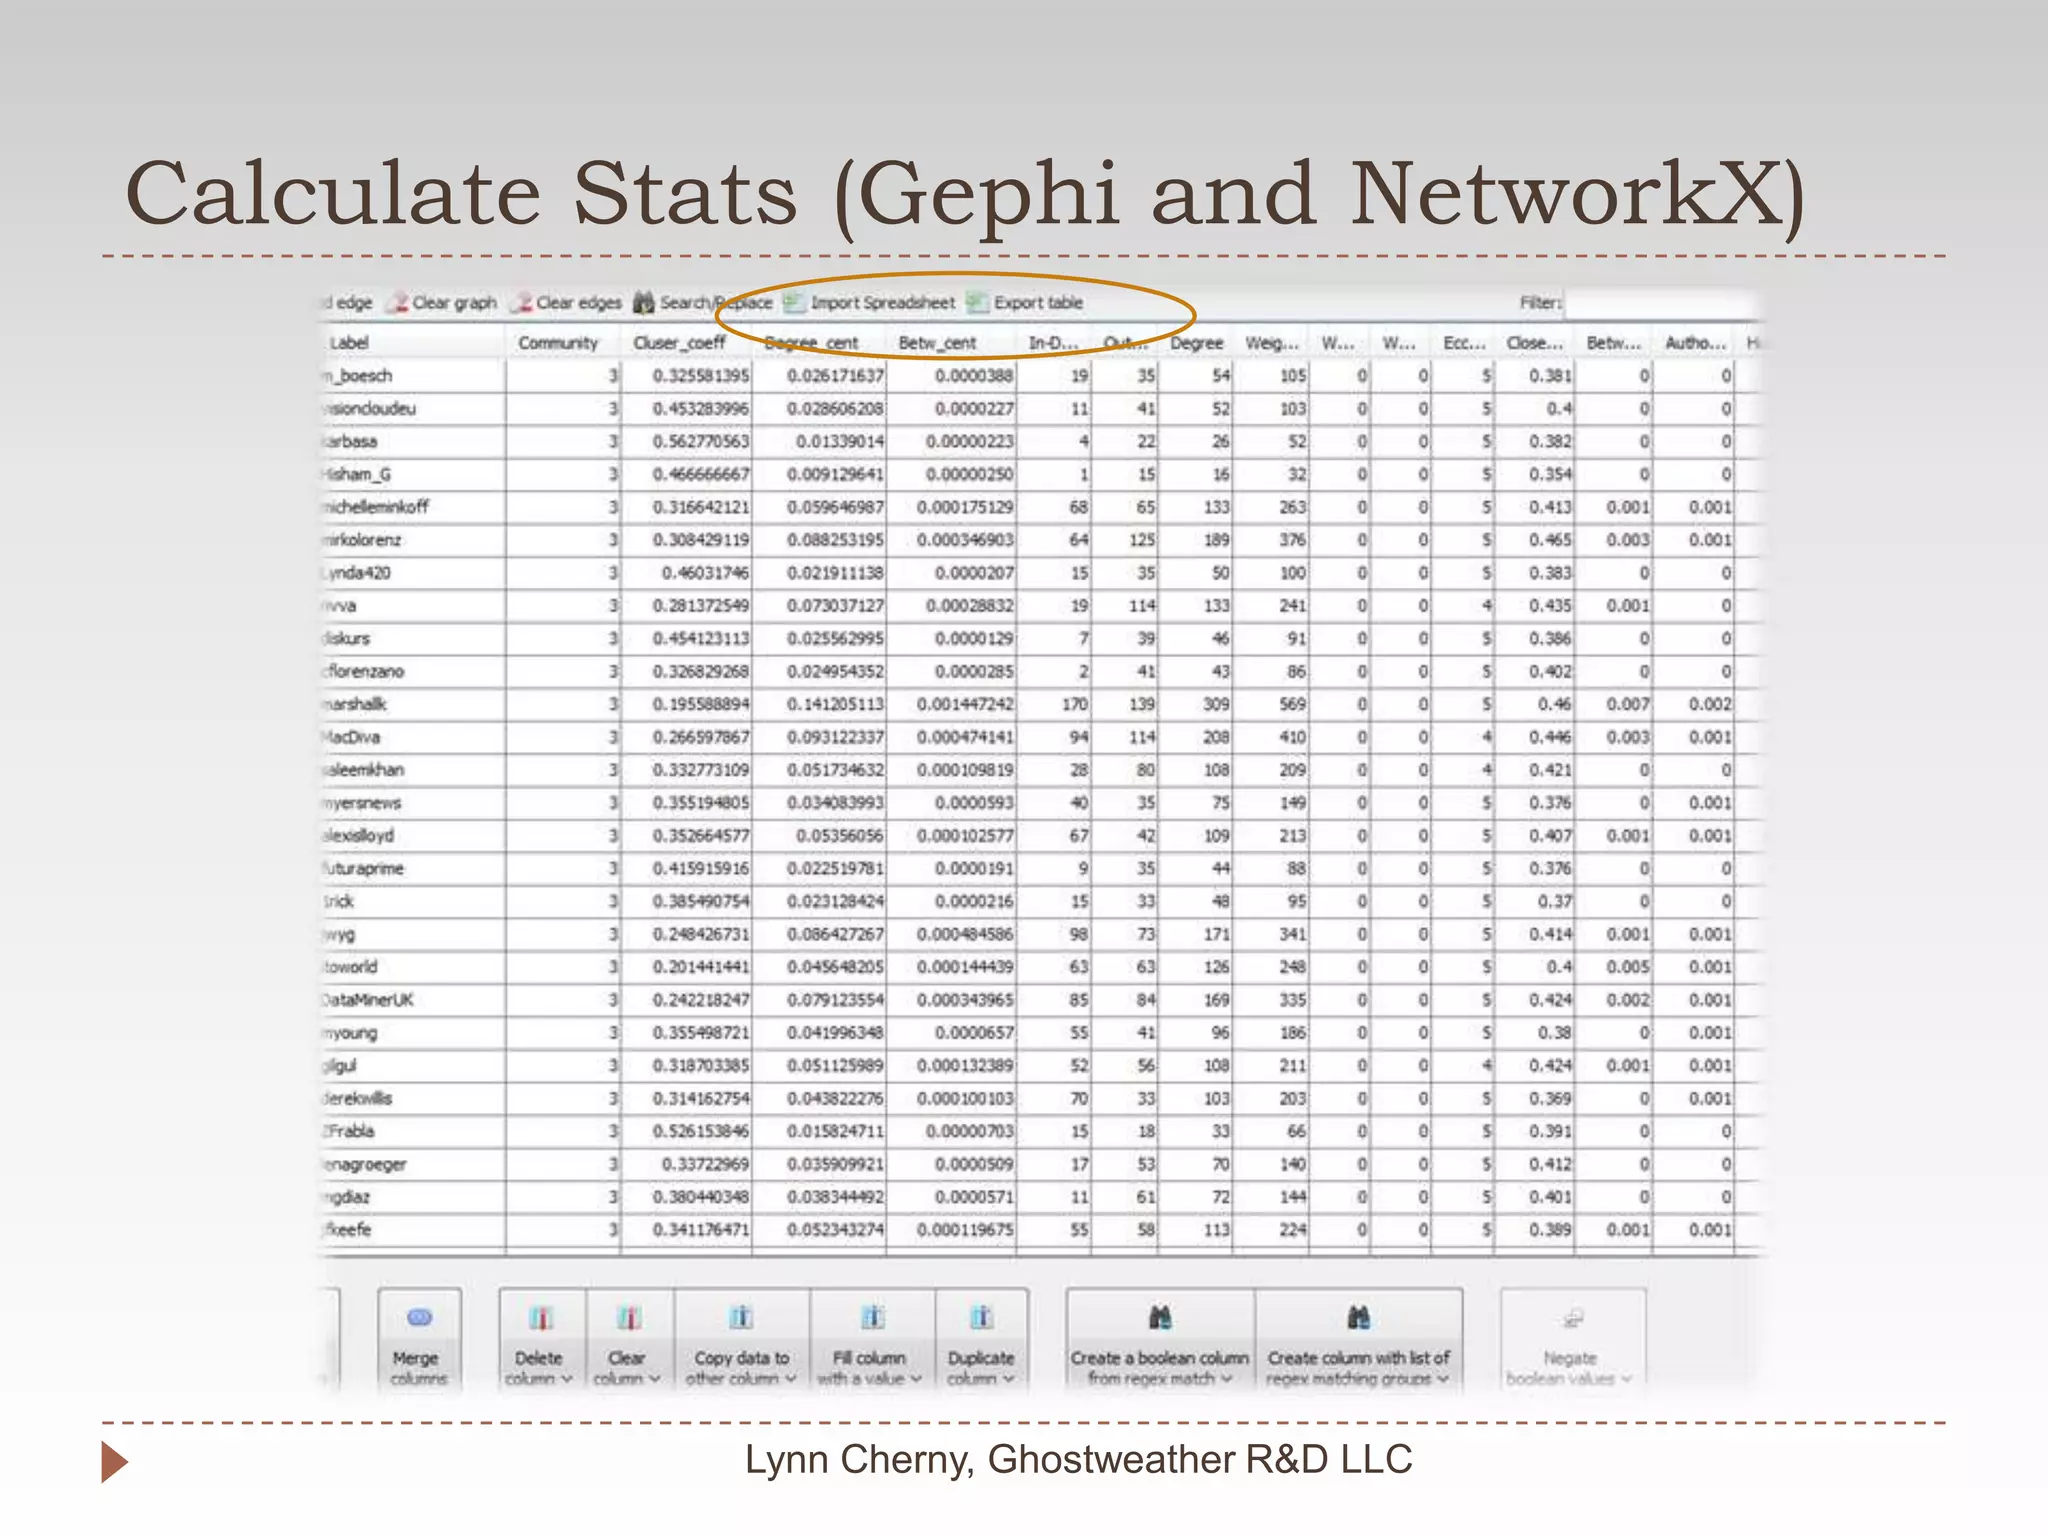
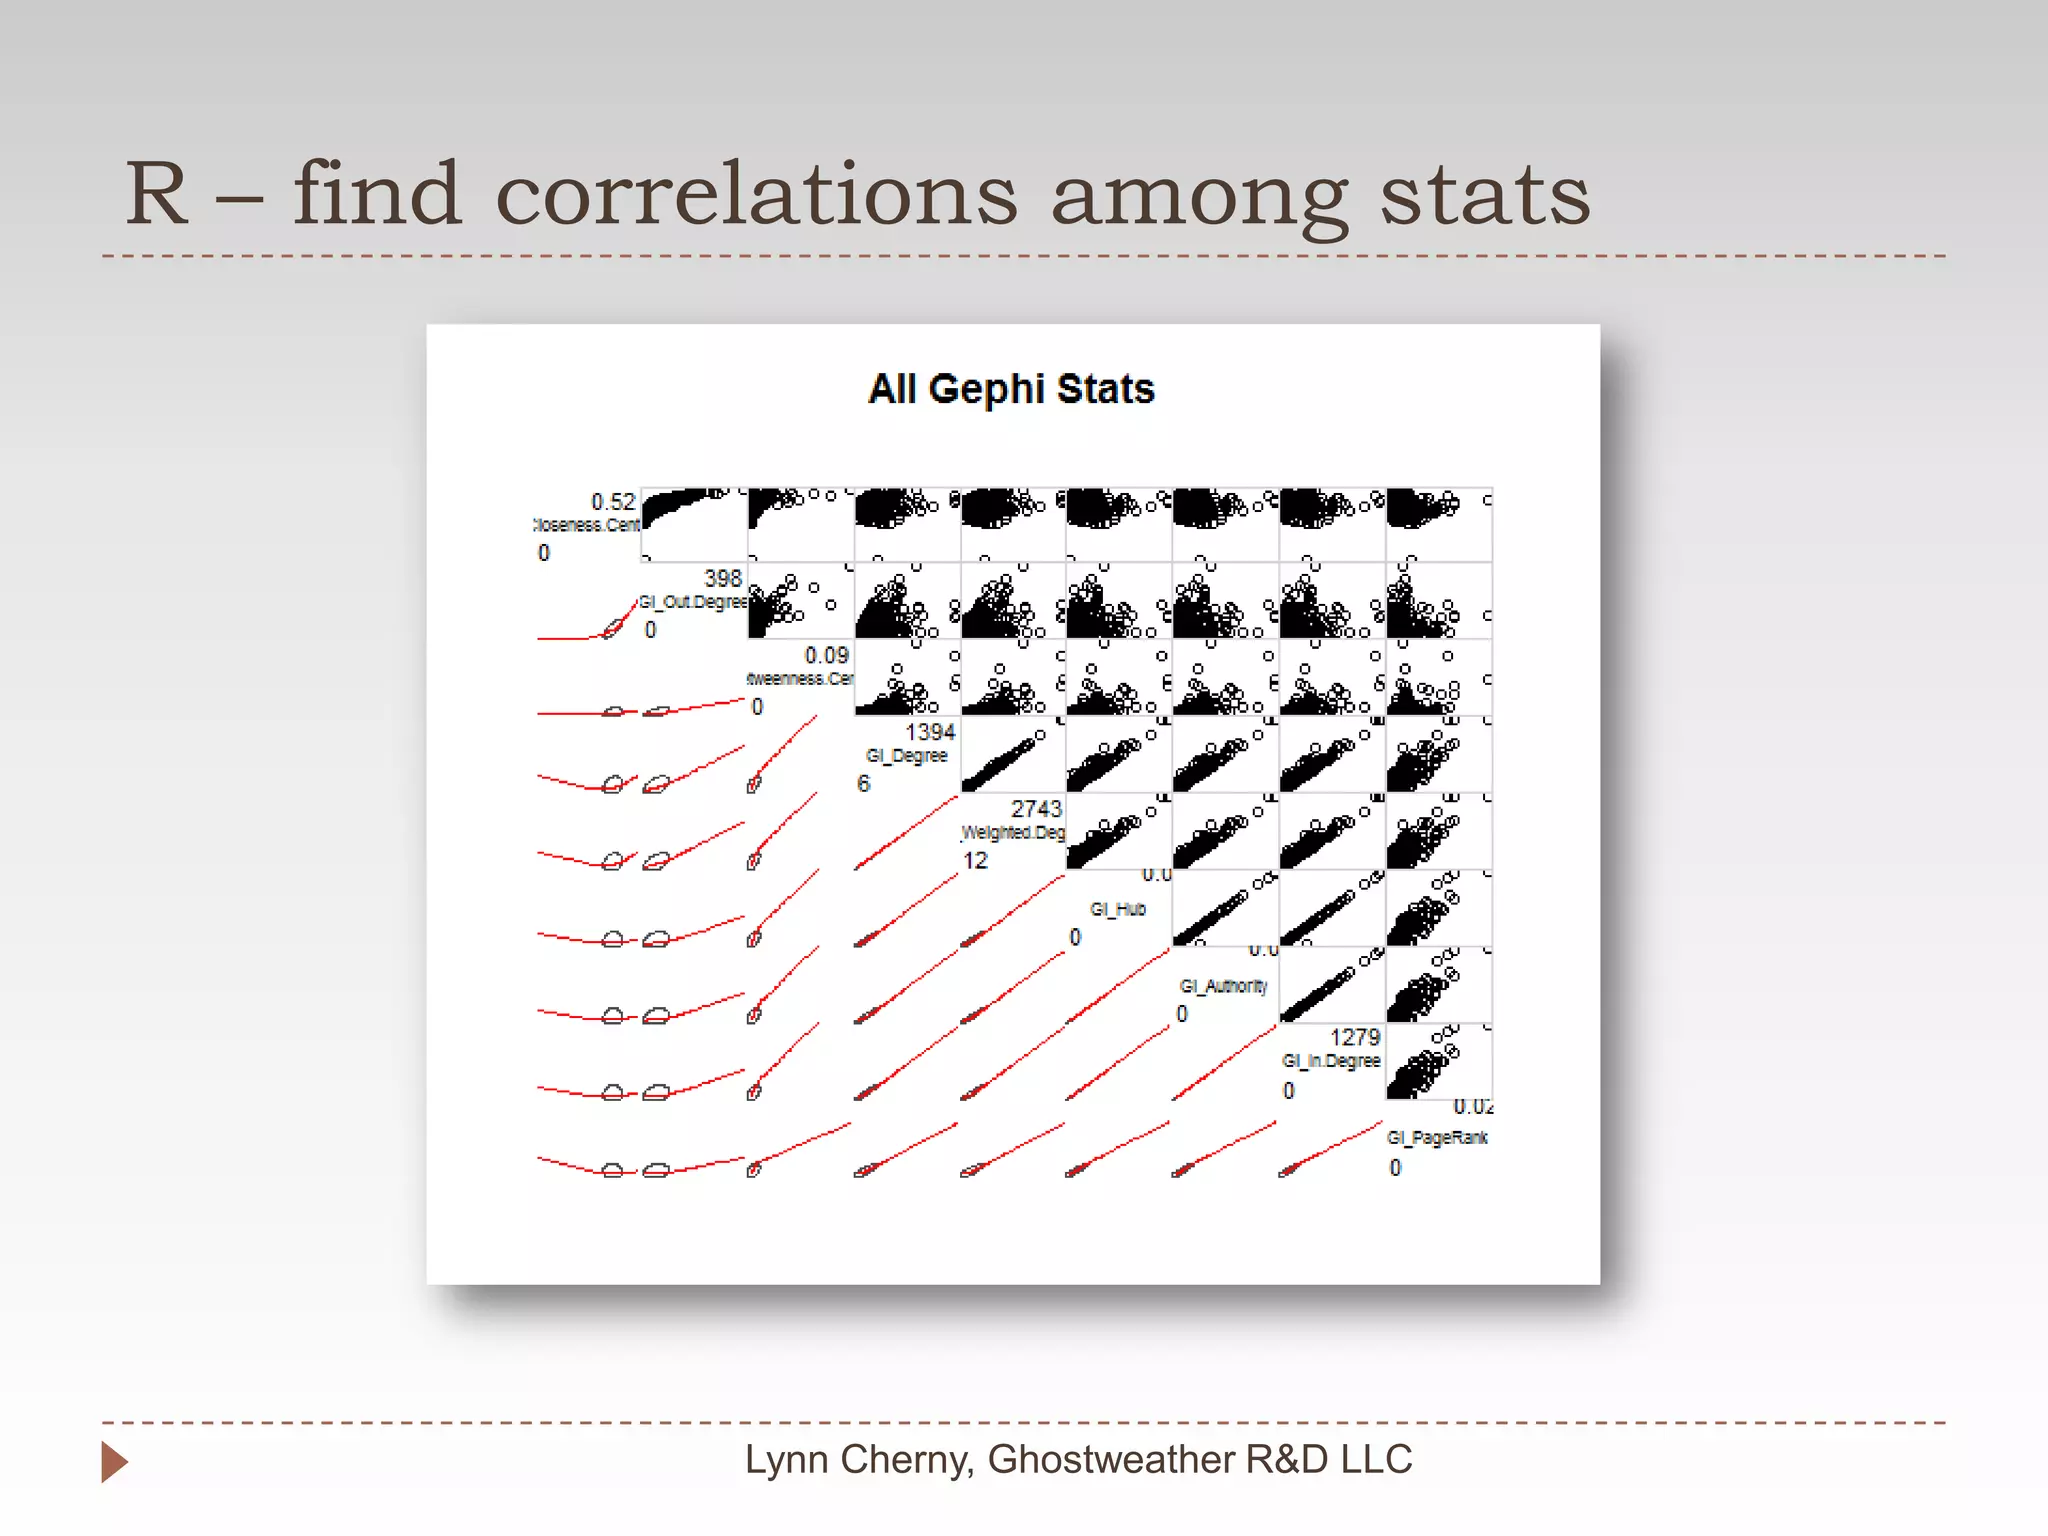
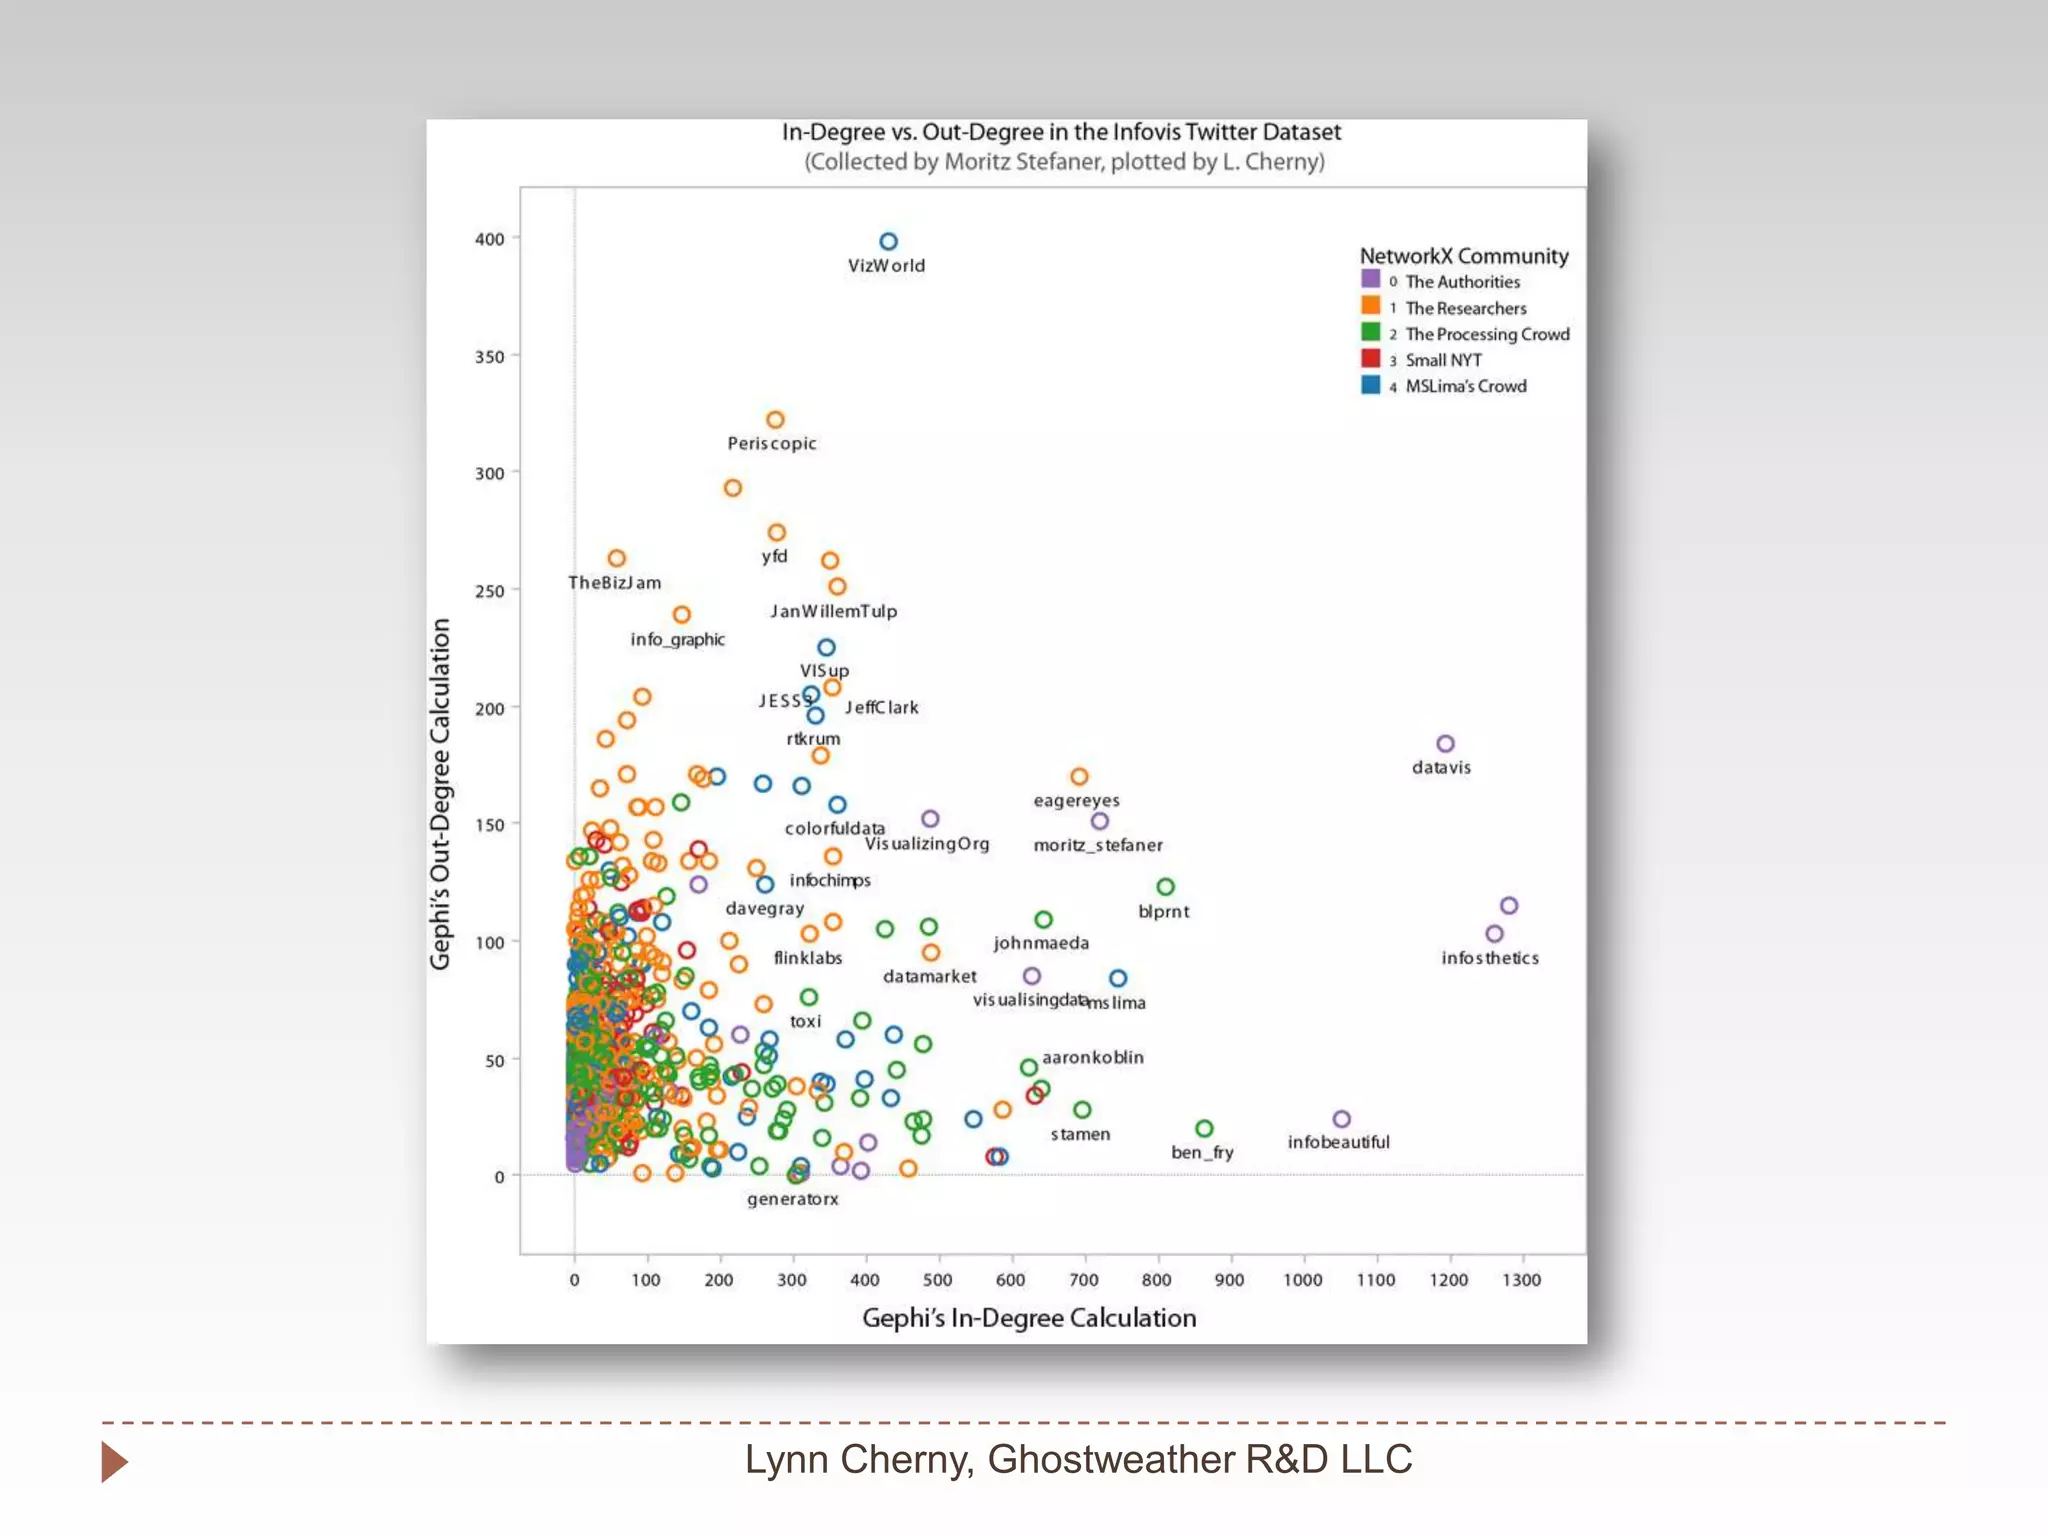
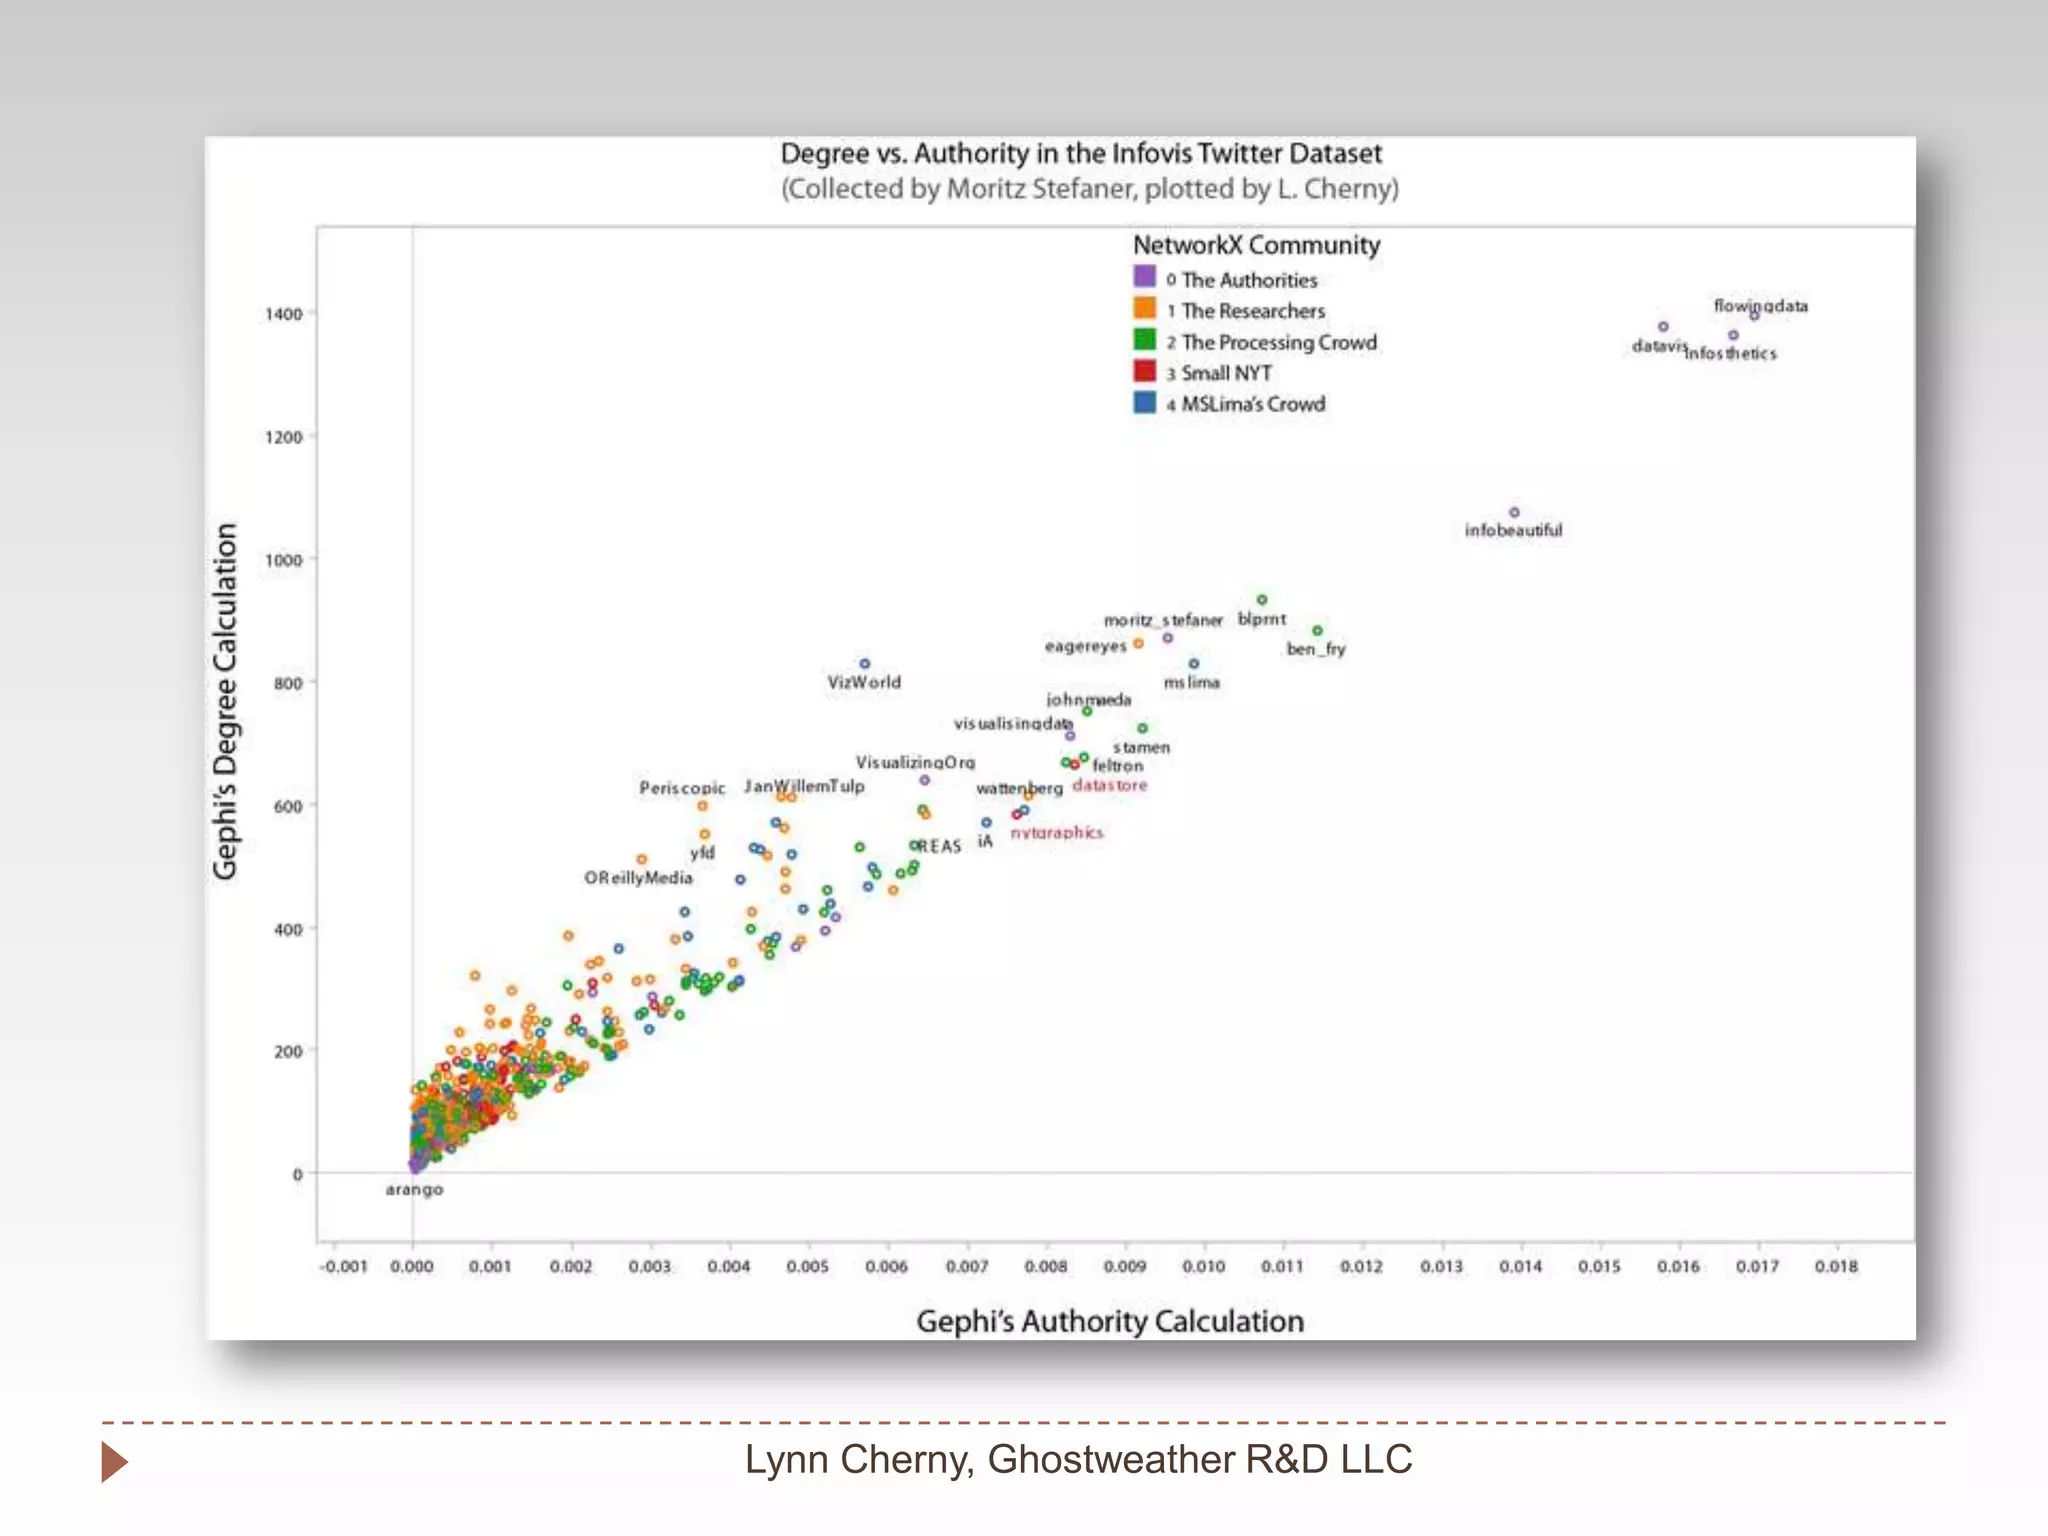
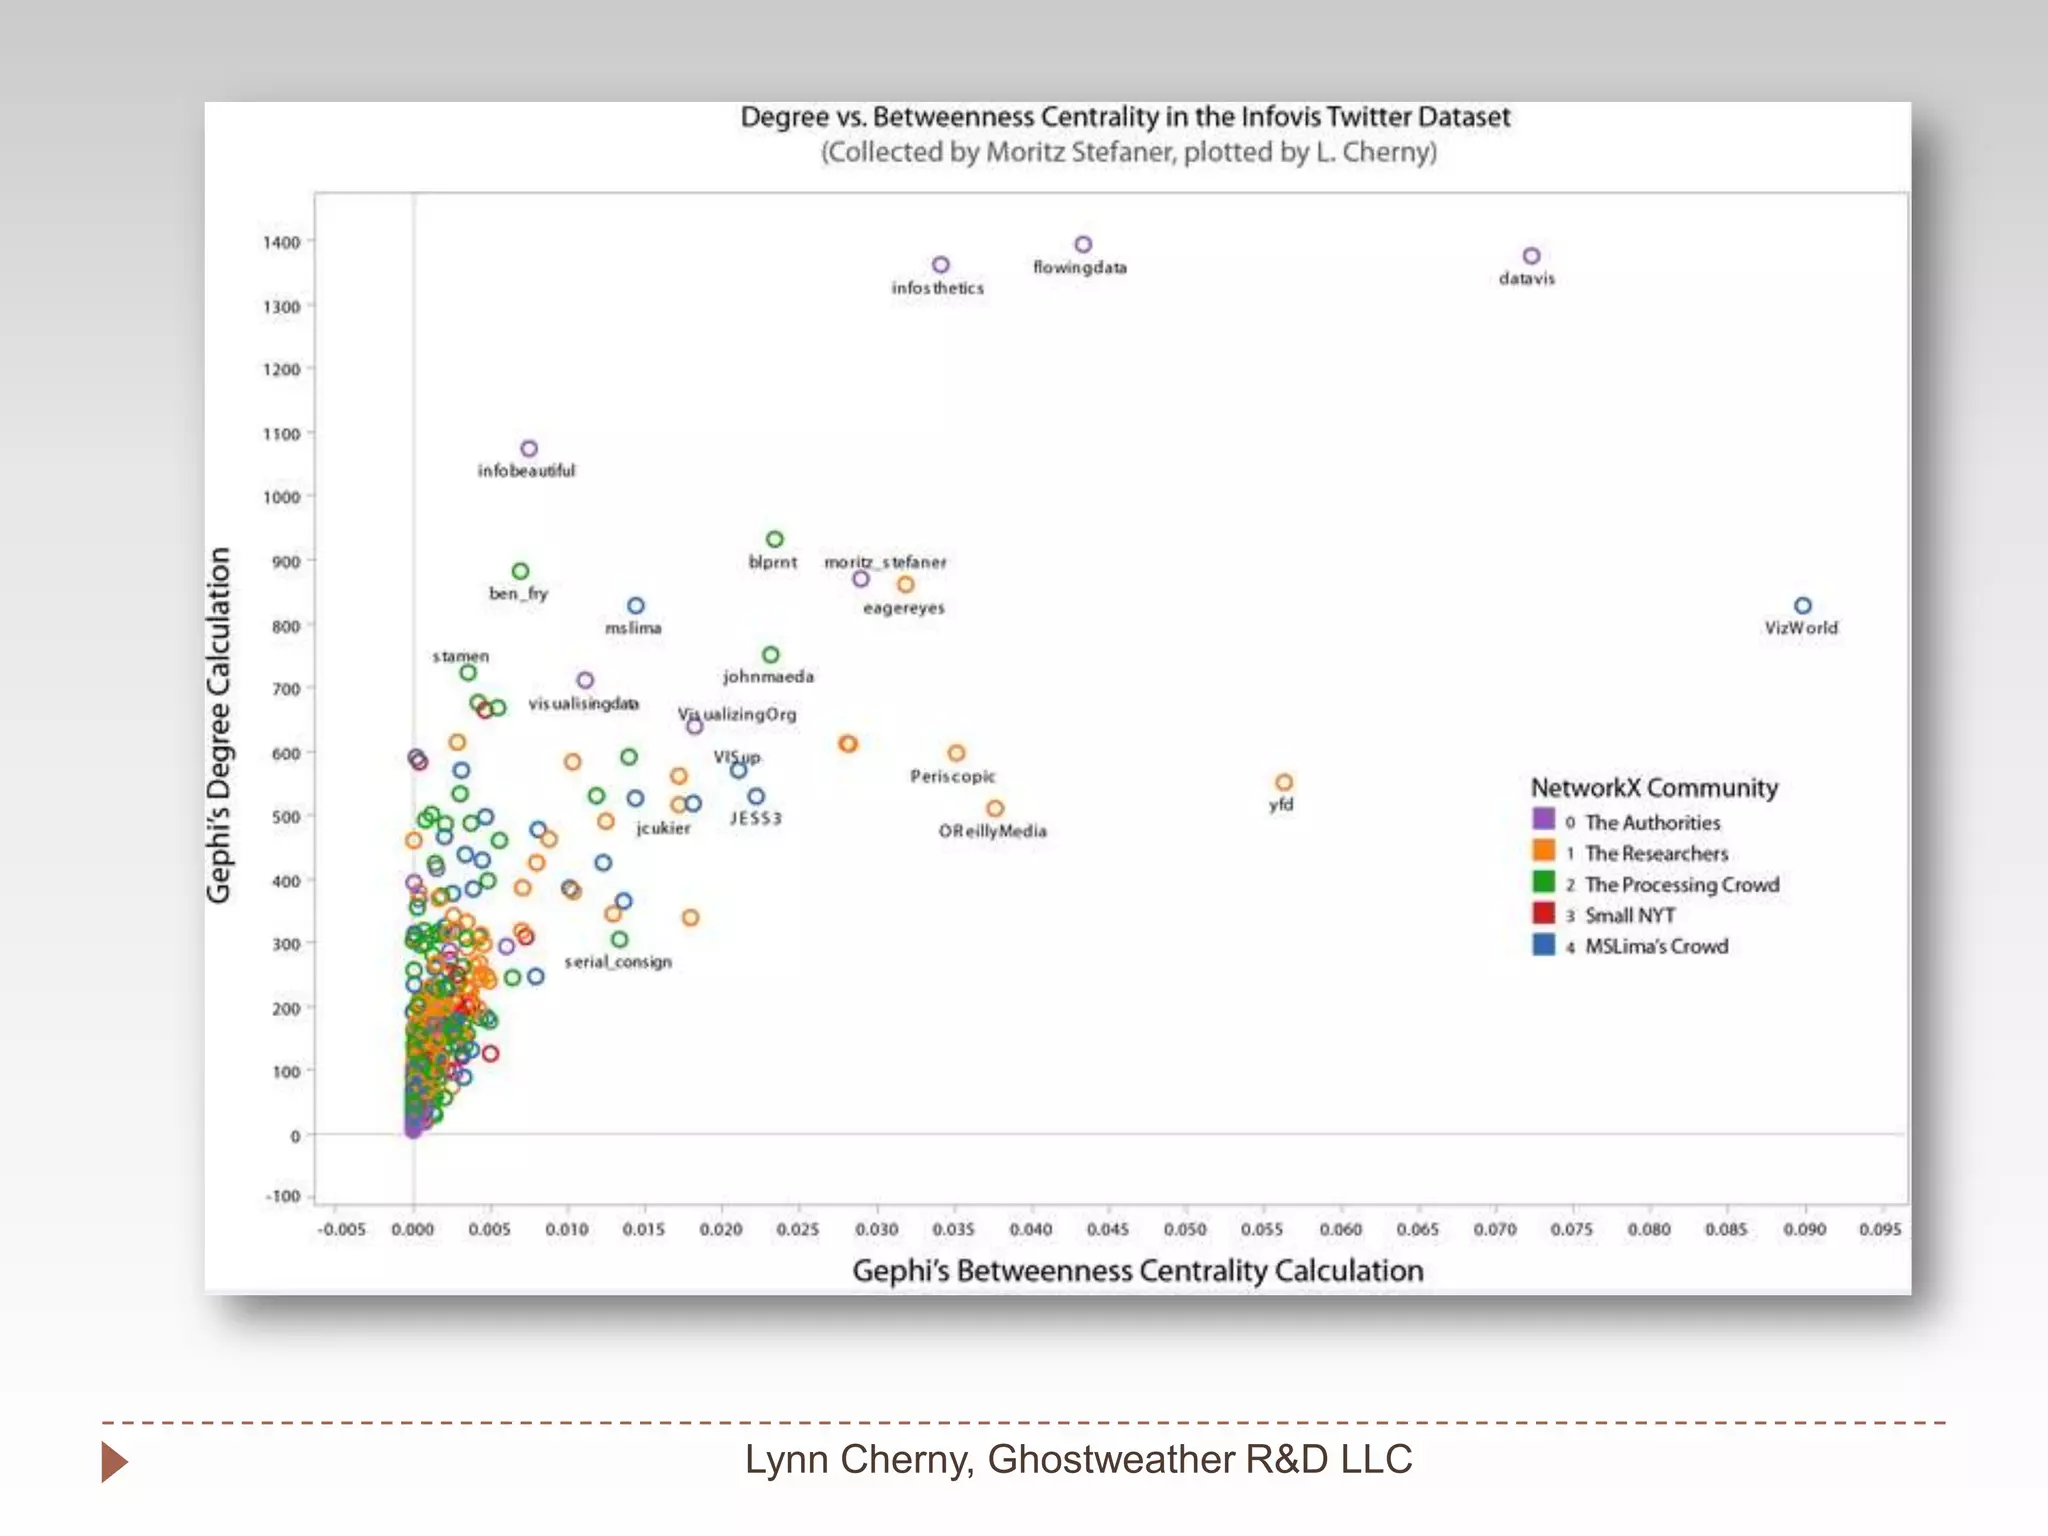
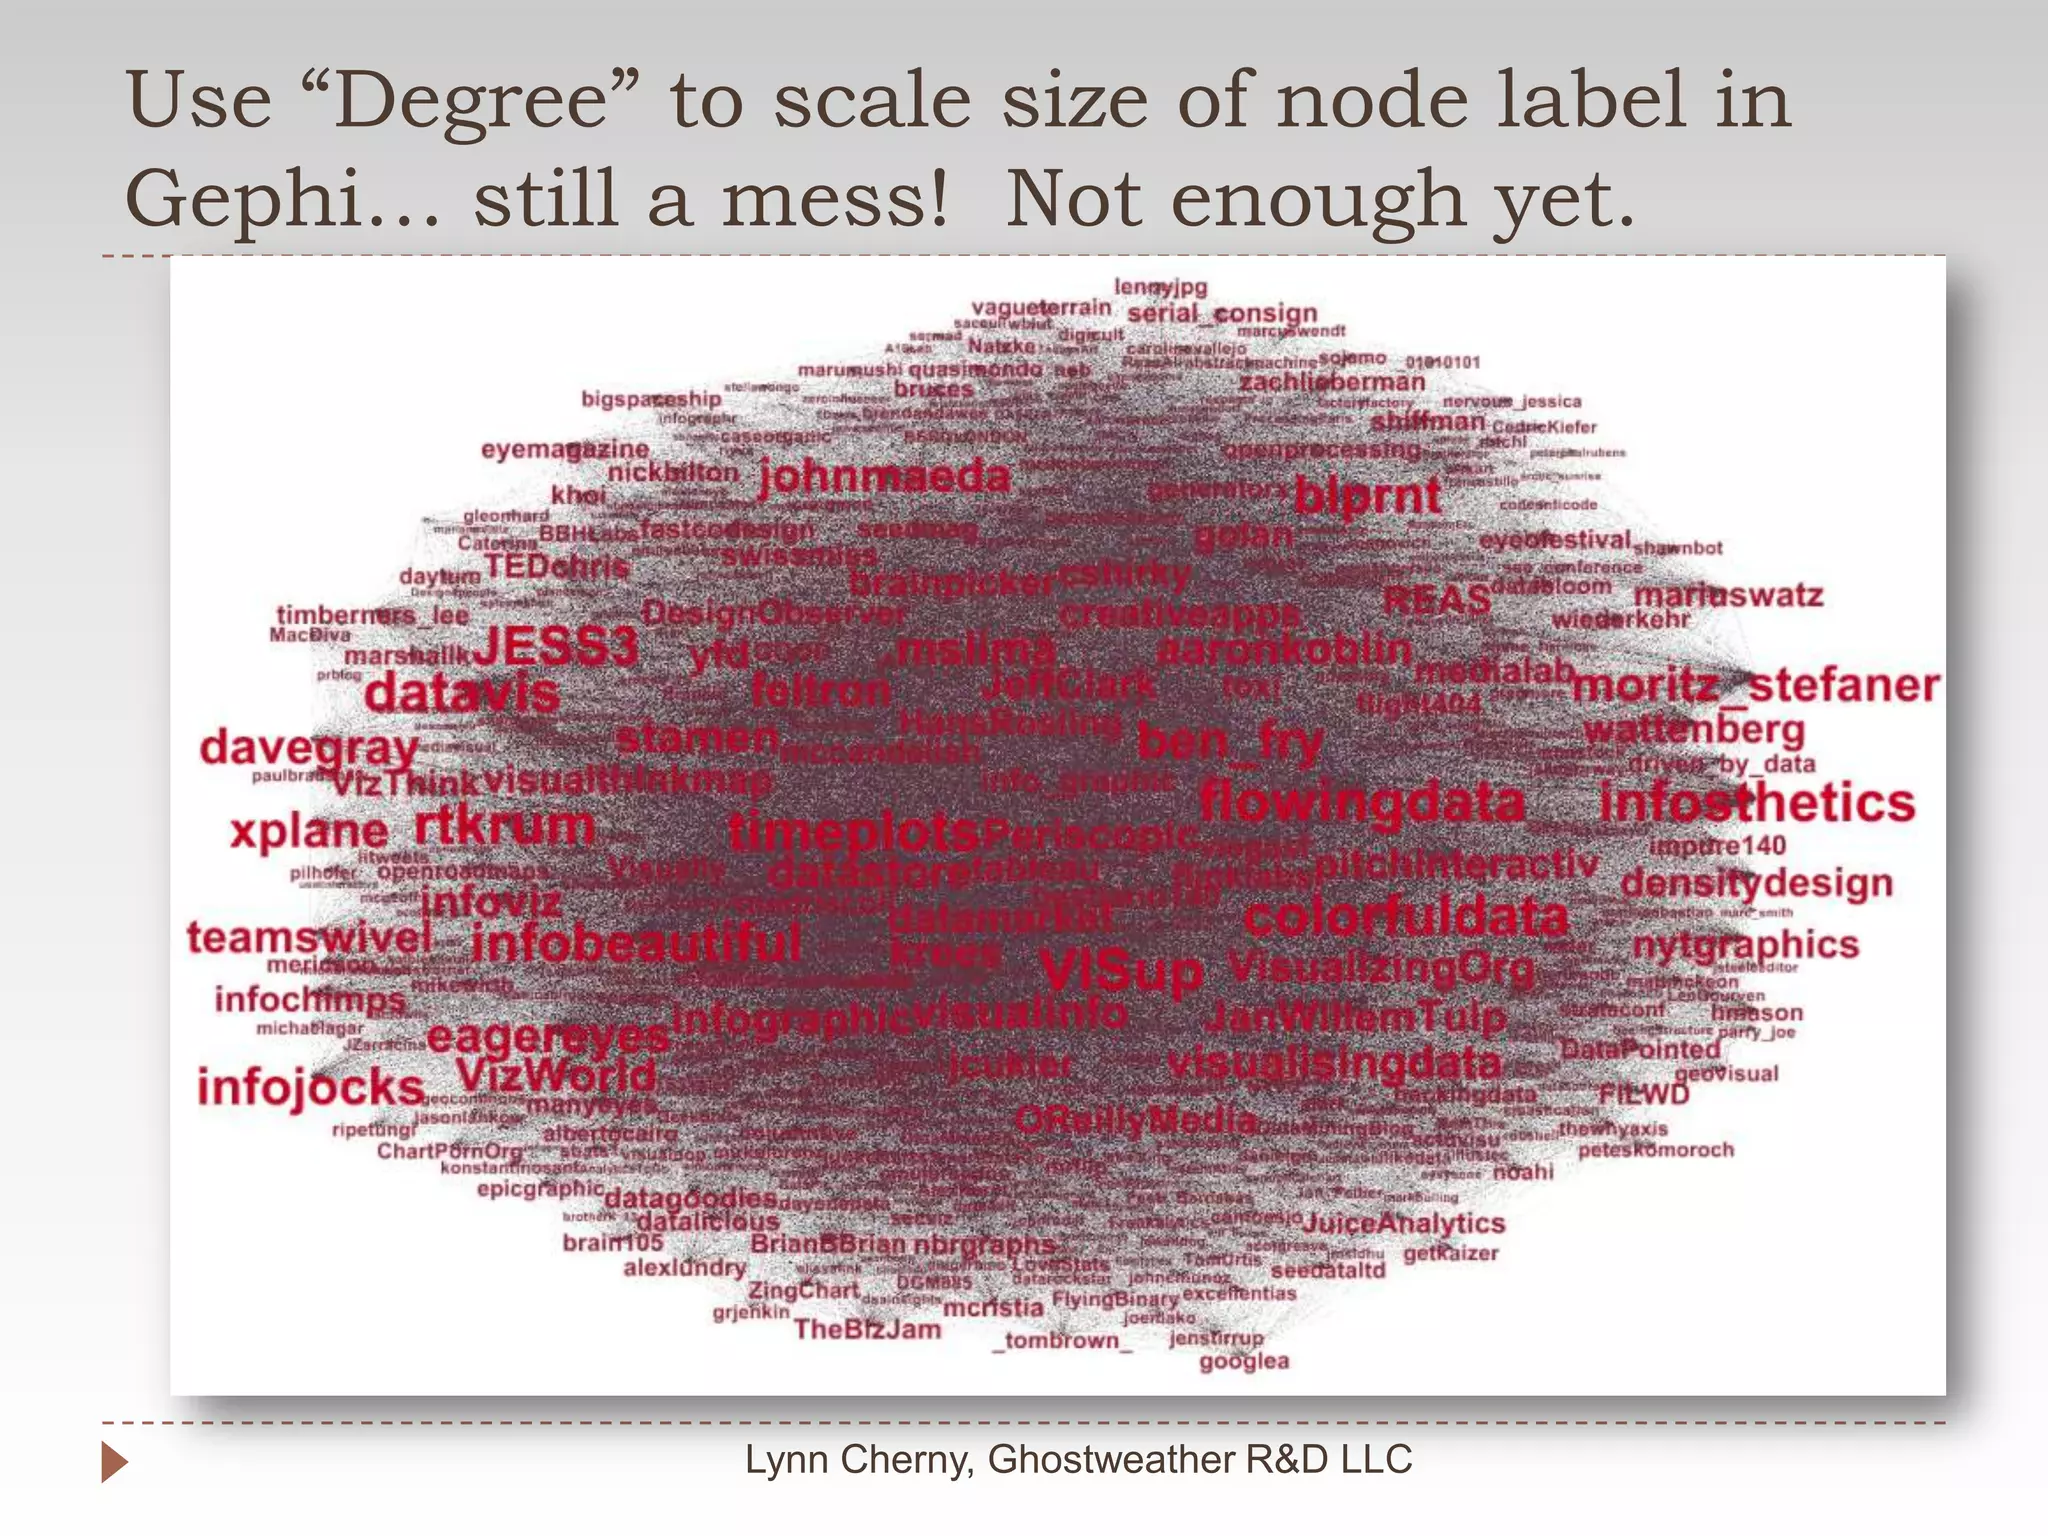
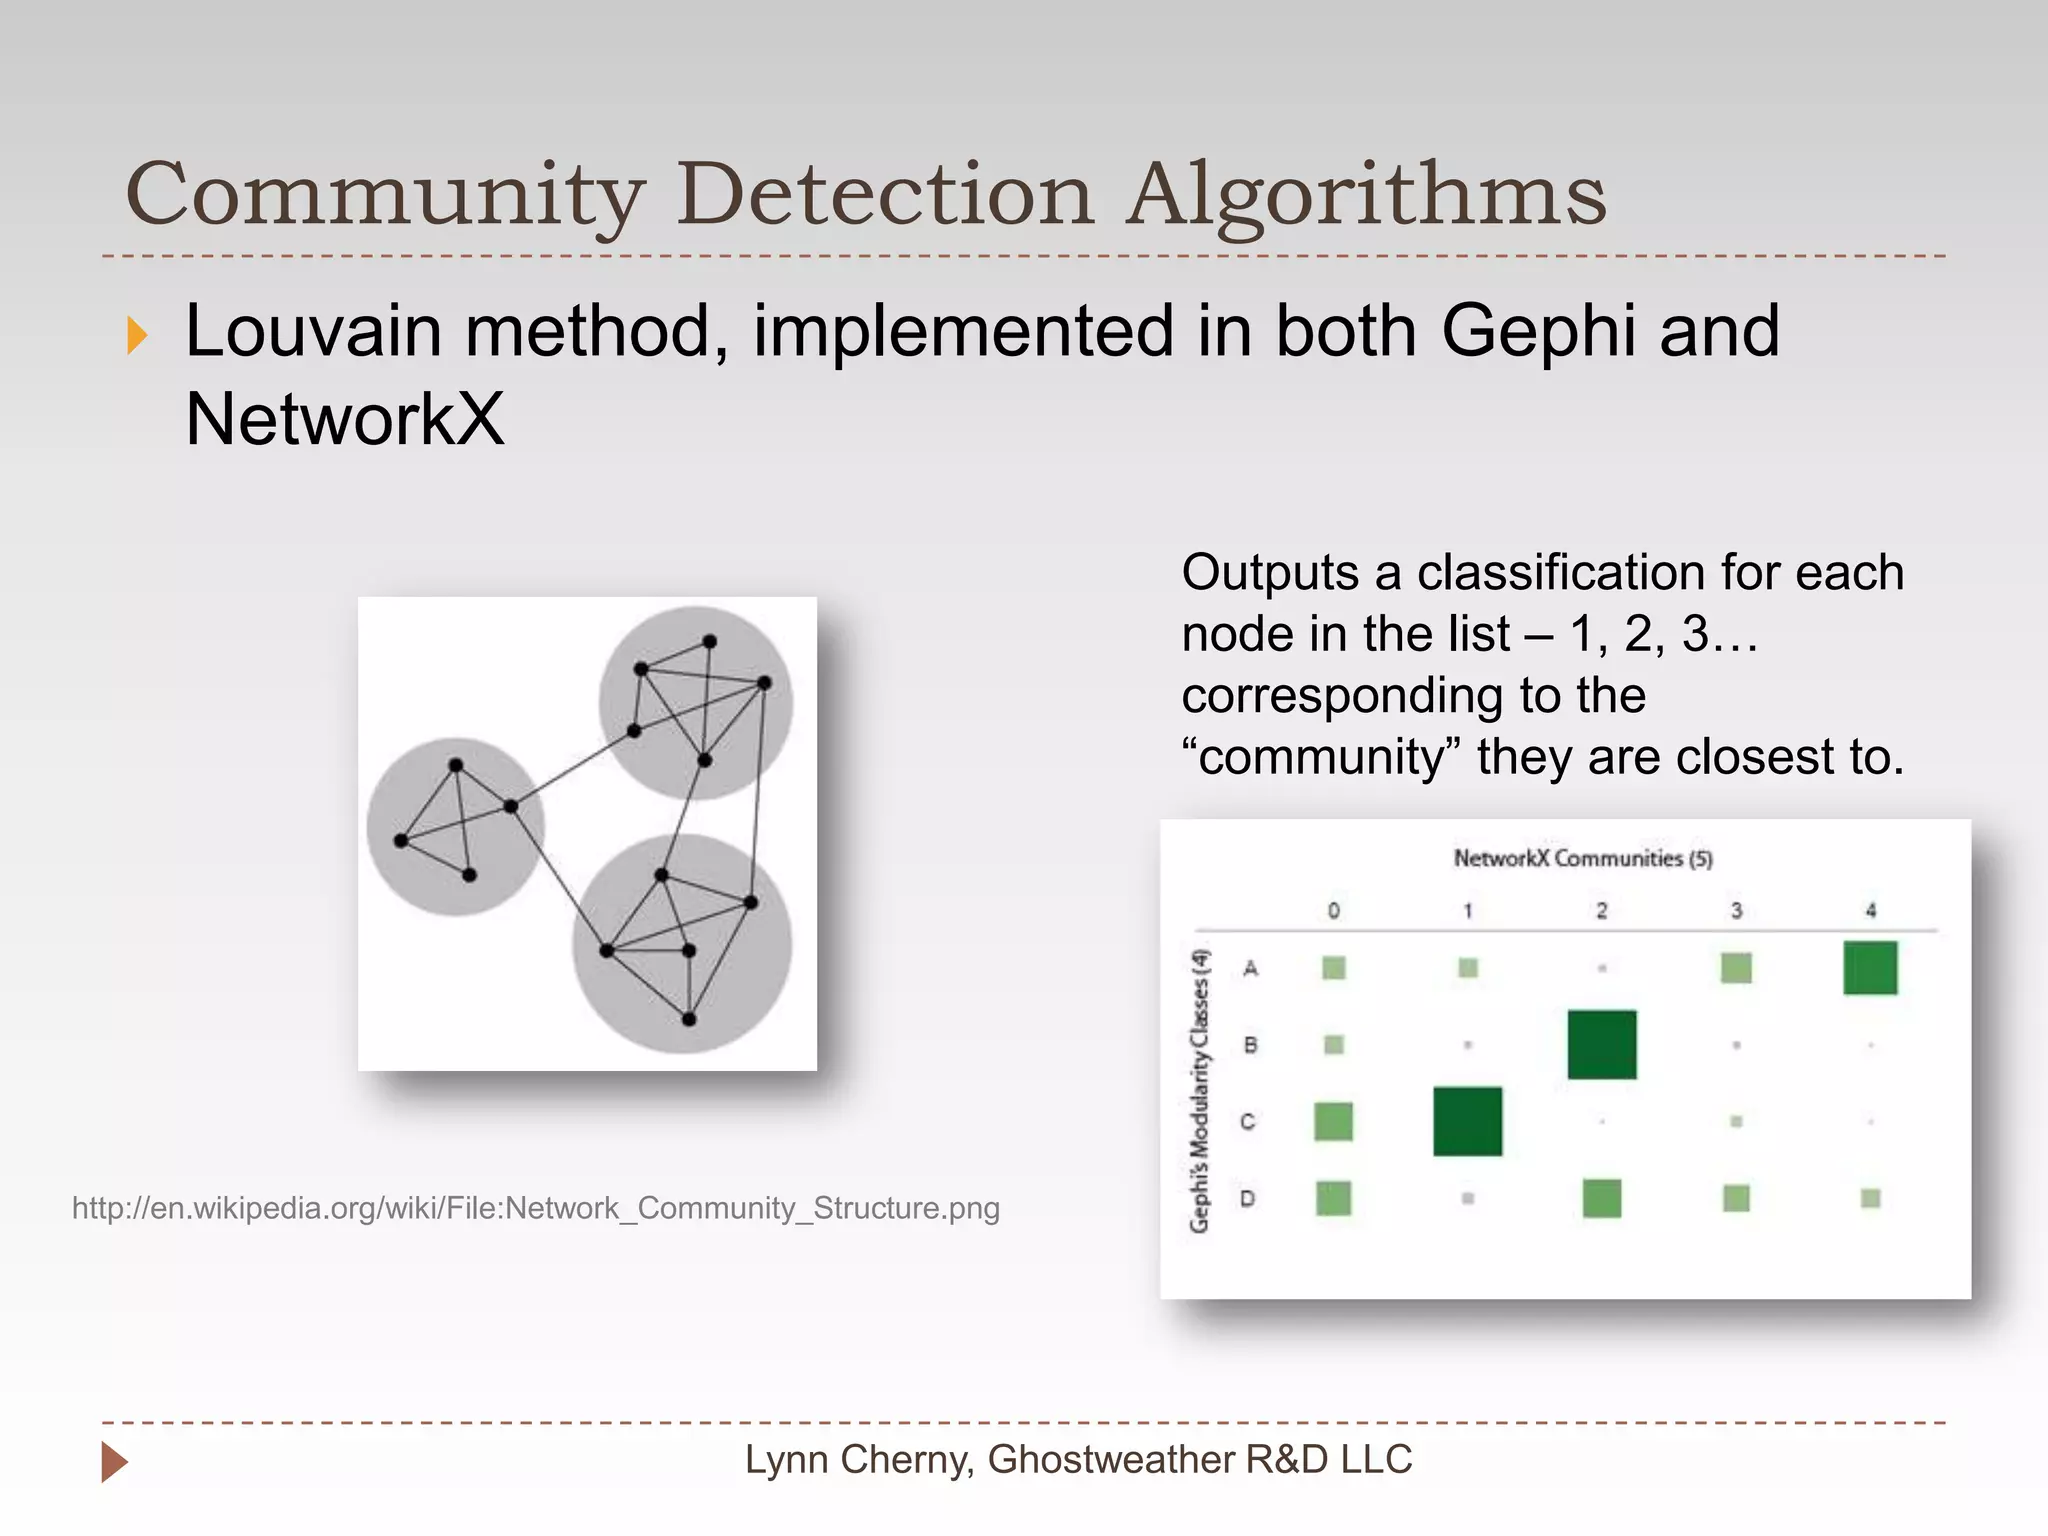
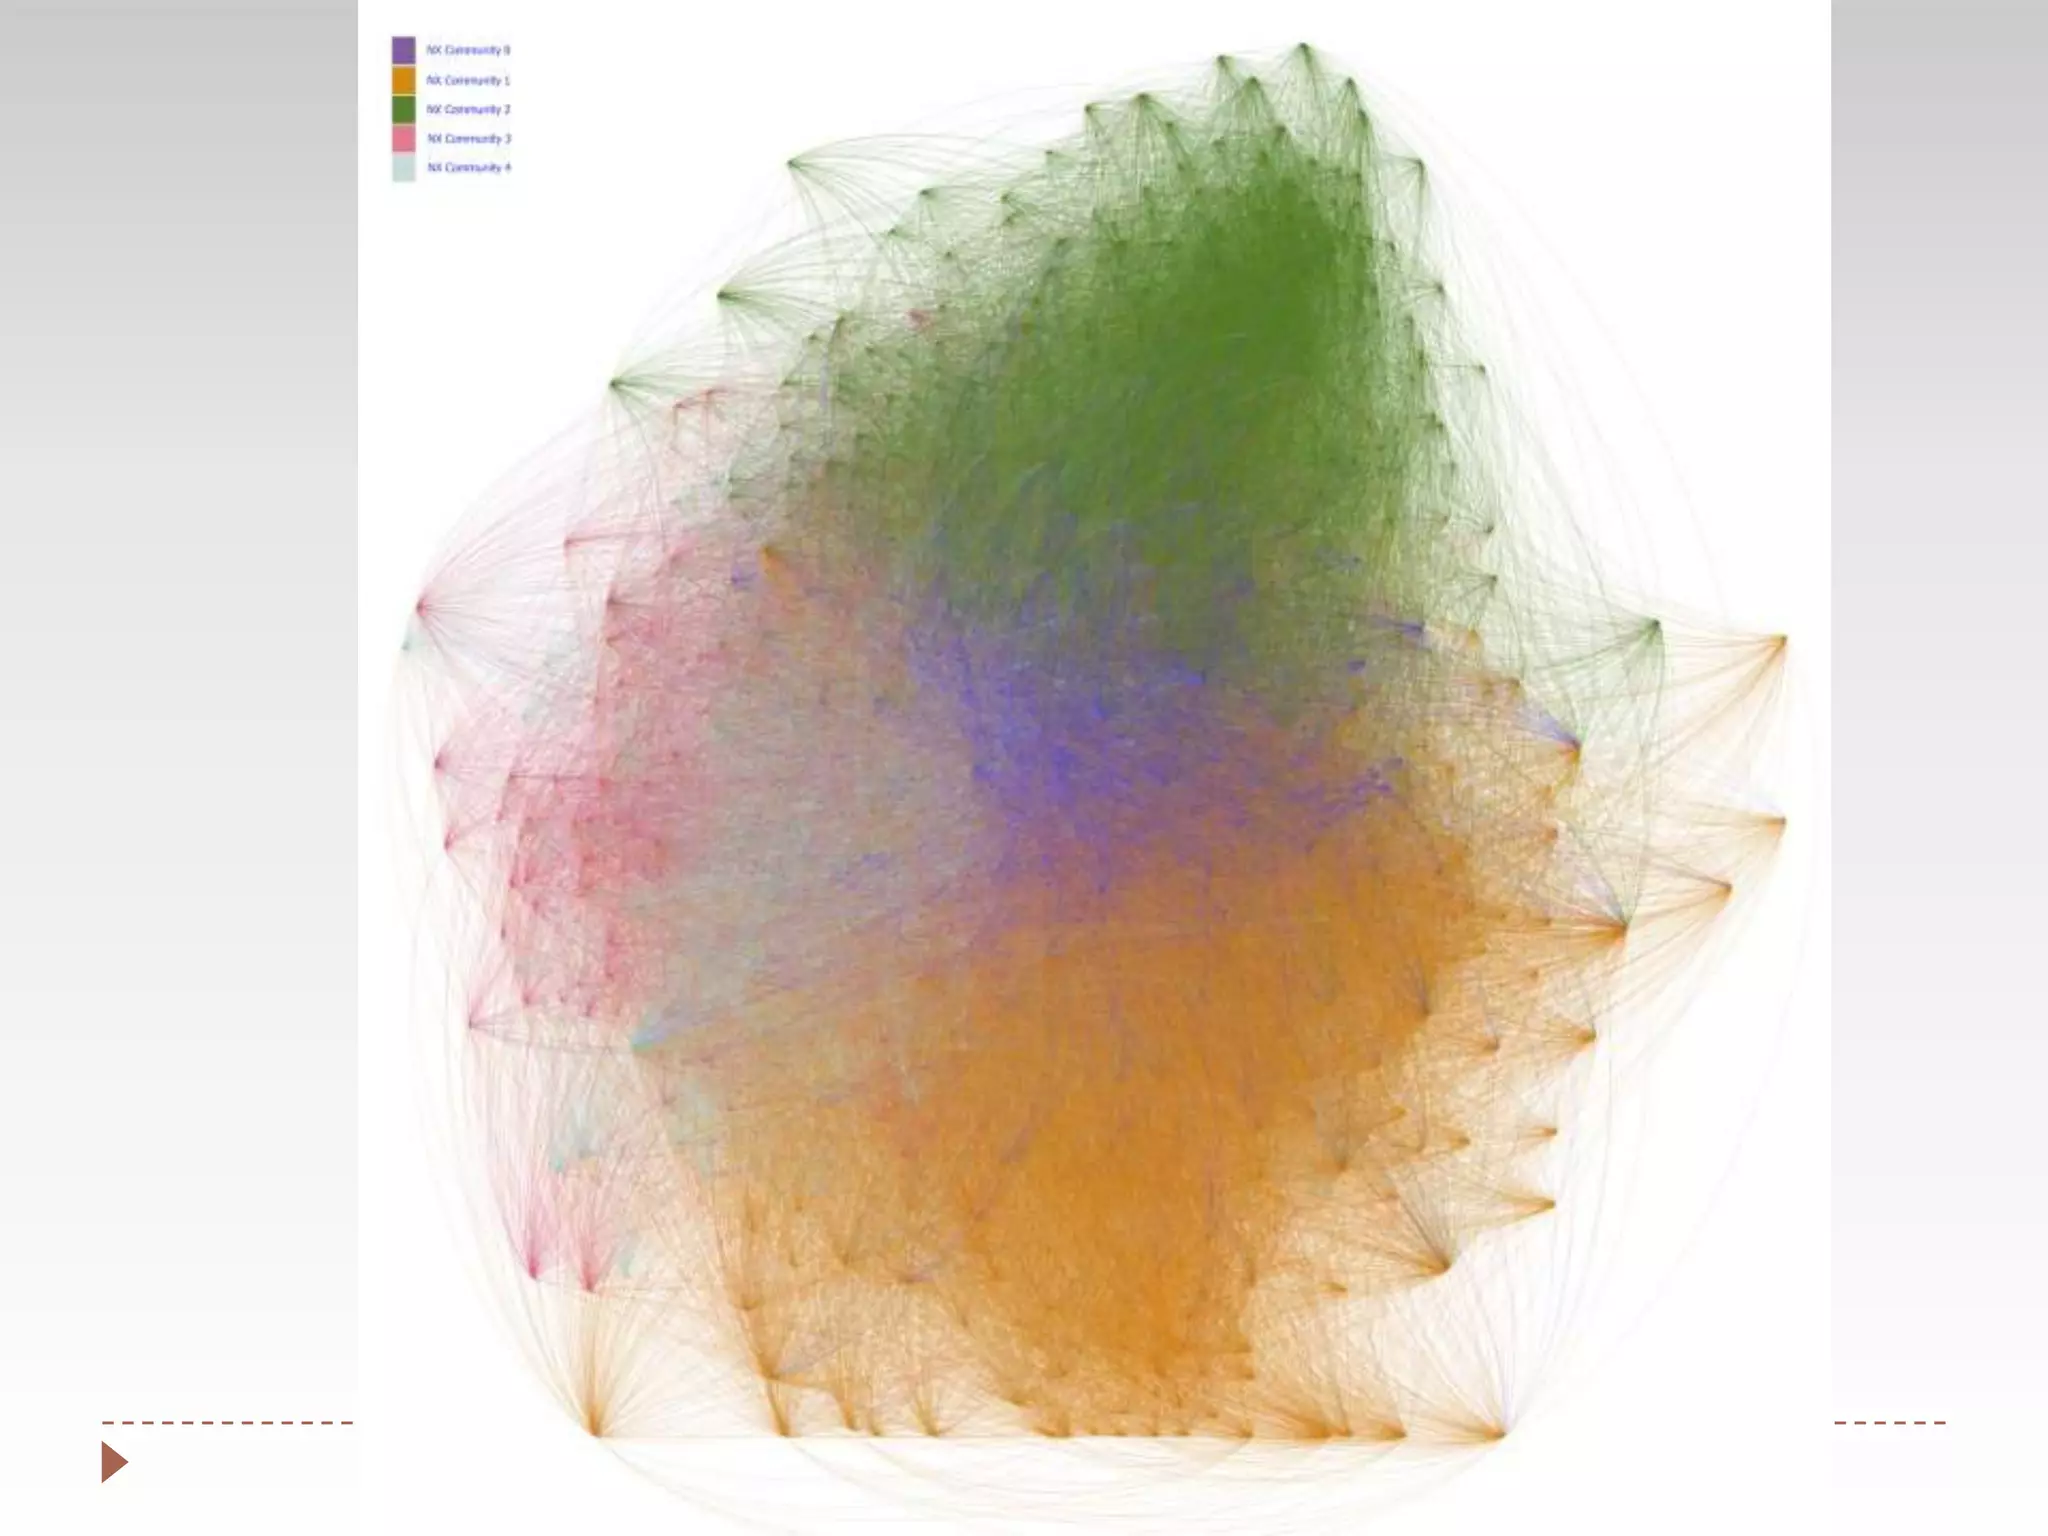
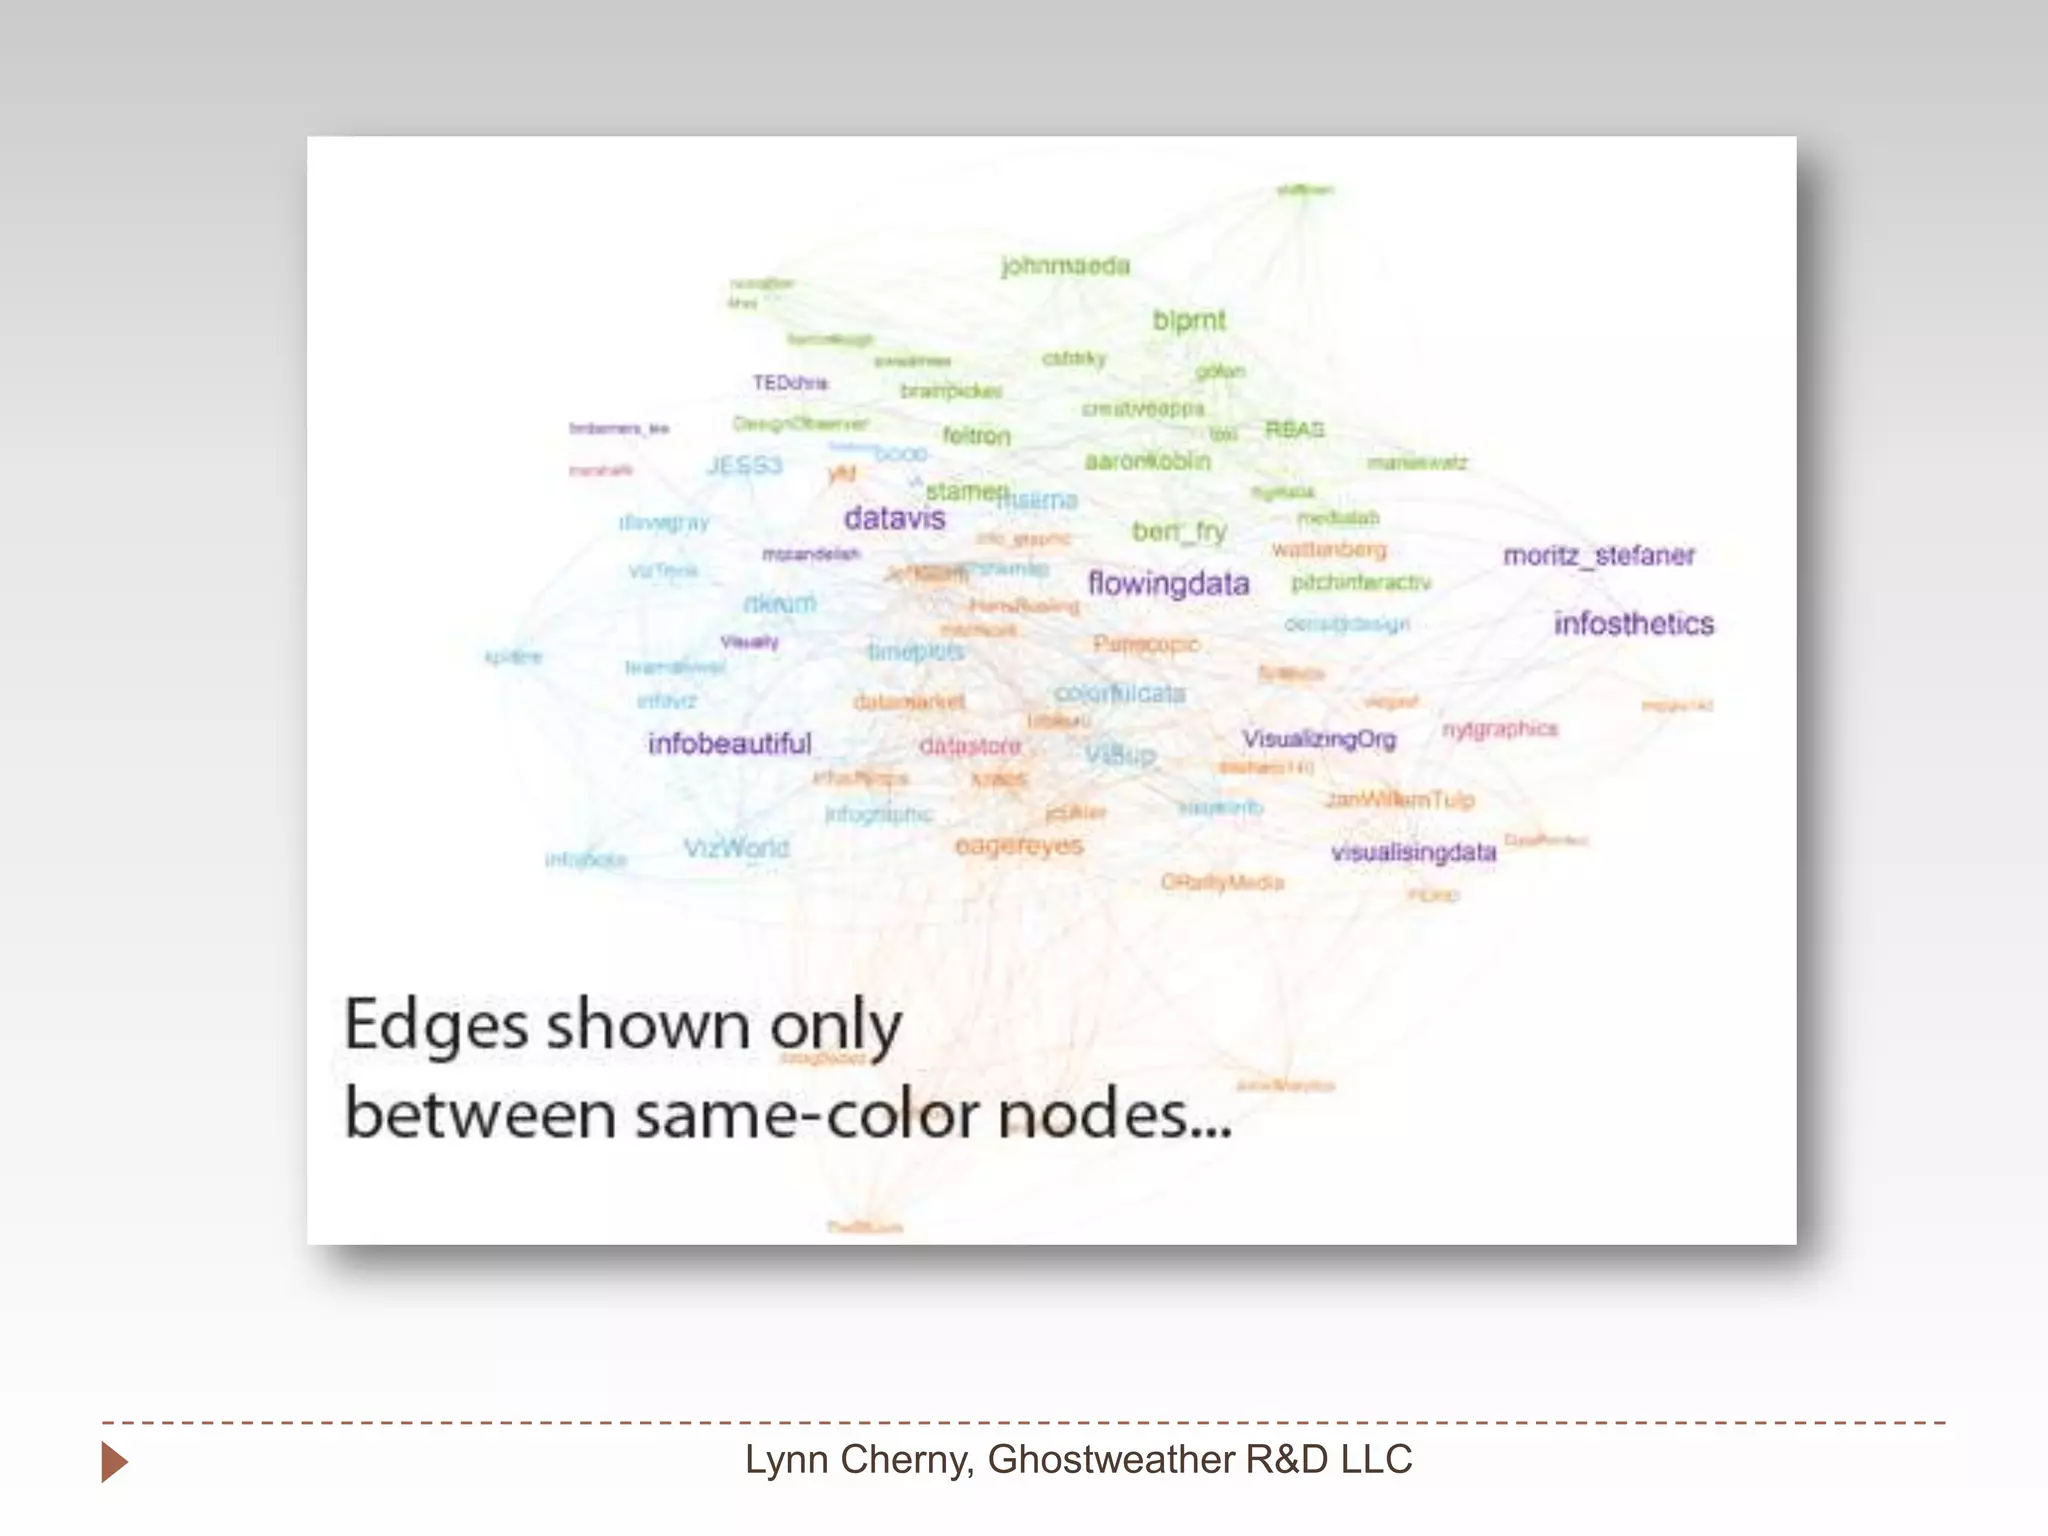
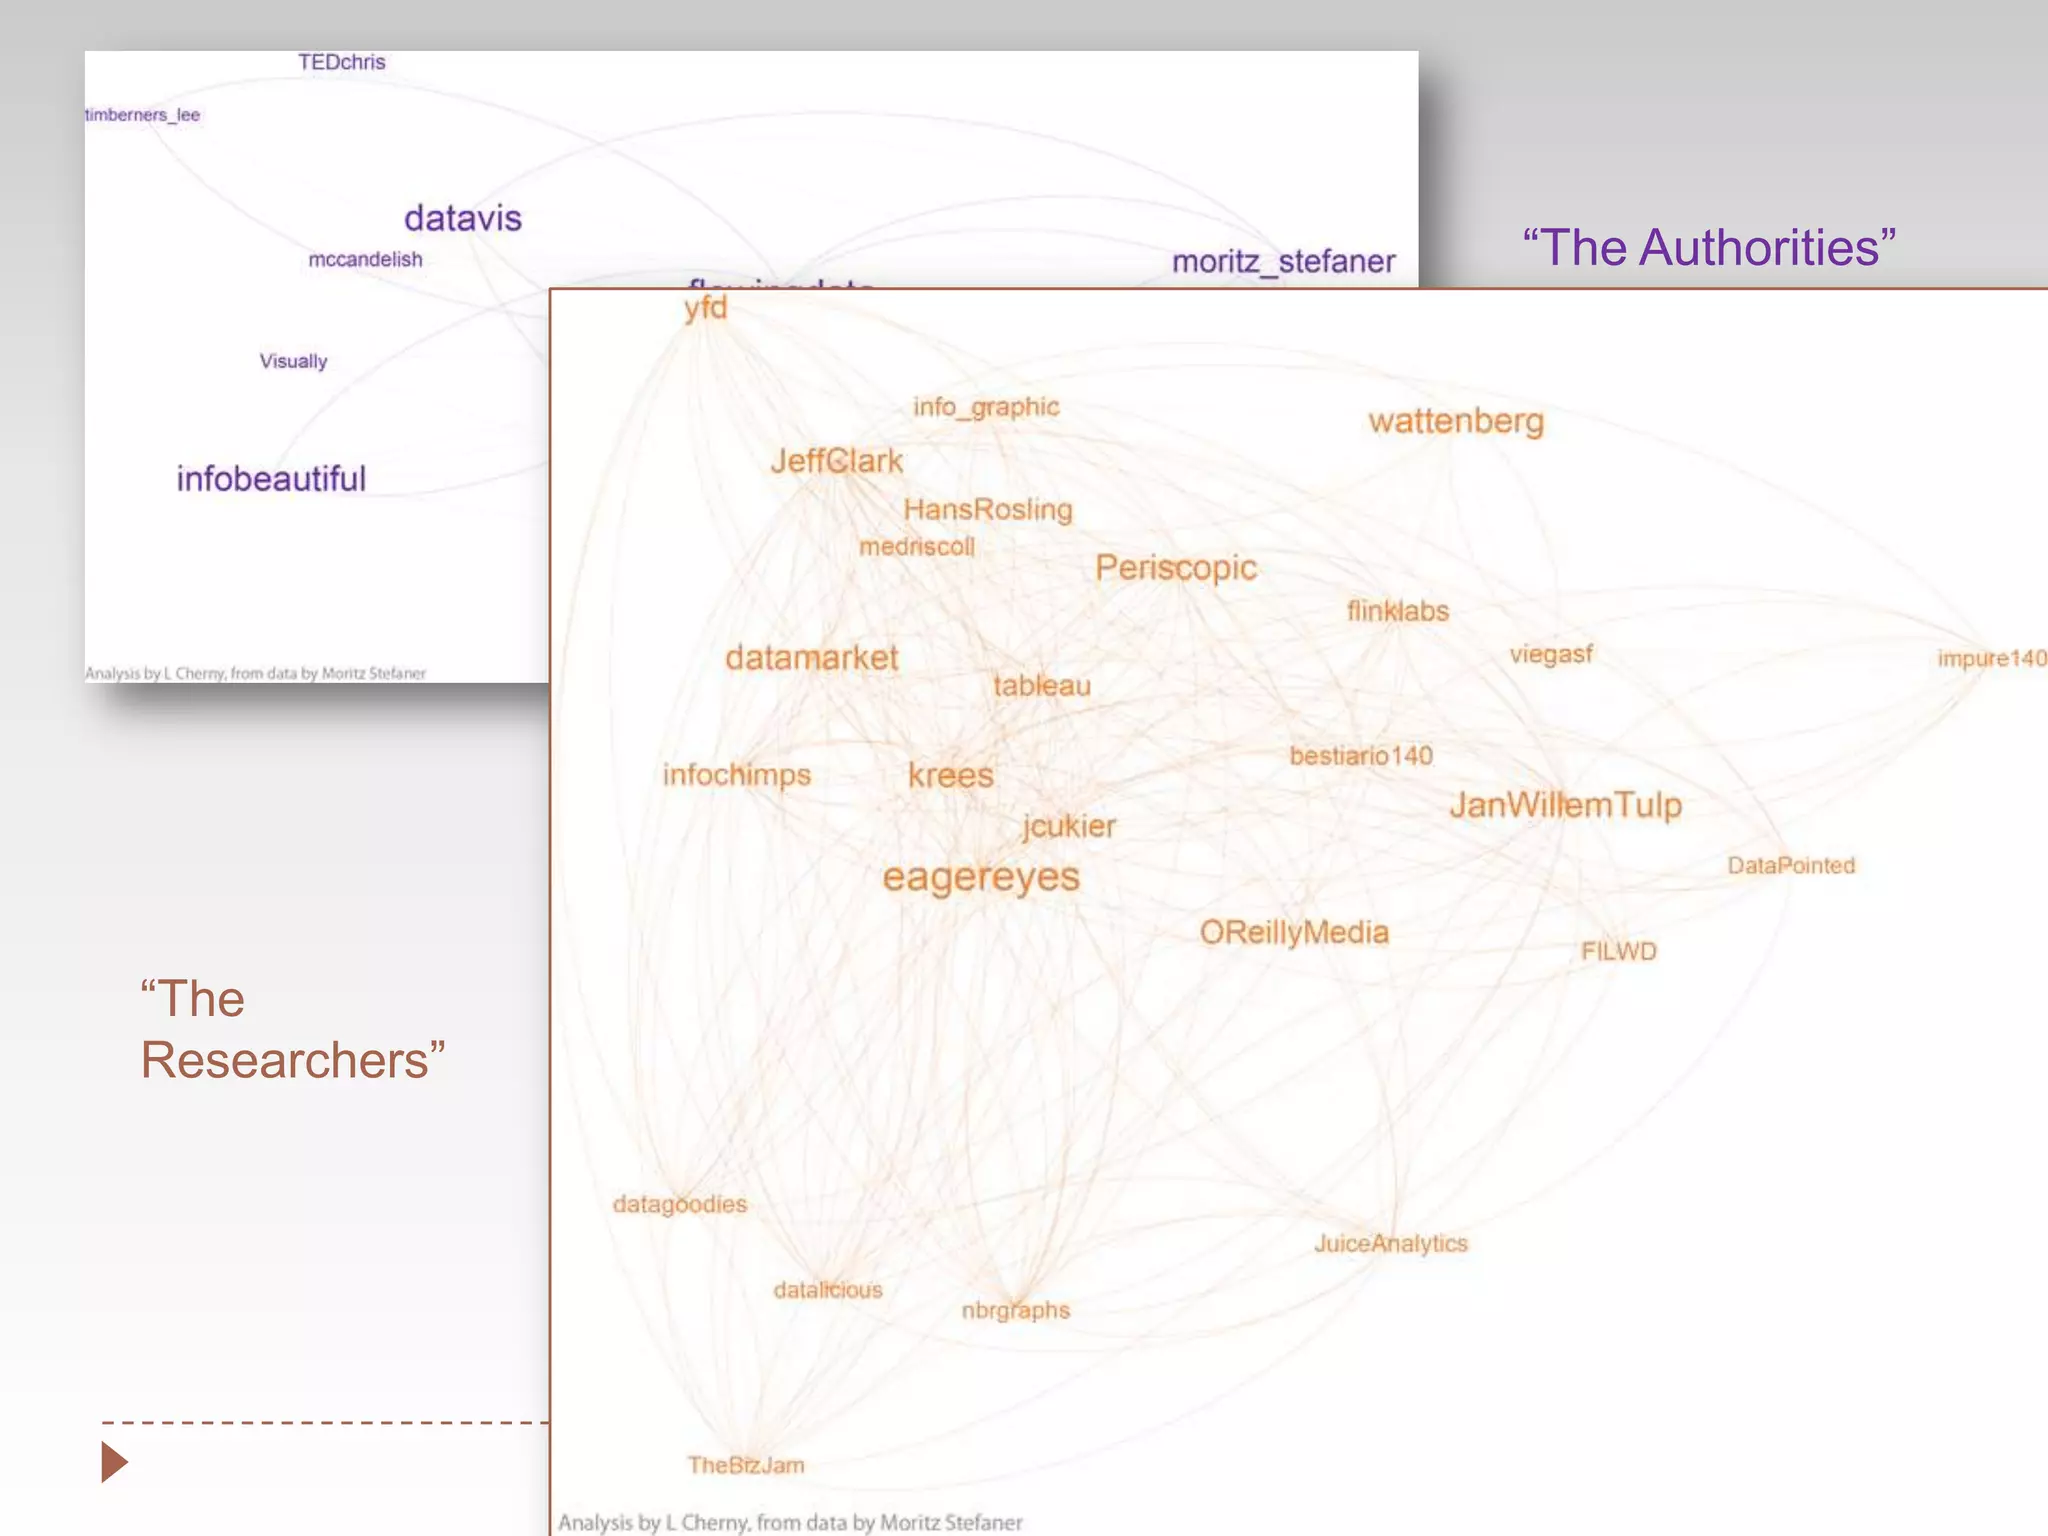

The document discusses the process of simplifying social network visualizations using various tools and statistical methods. It emphasizes the importance of network analysis as a form of data literacy and provides an overview of tools like Gephi, R, and Python for conducting such analyses. The author, Lynn Cherny, offers assistance for individuals facing challenges with complex network data.


![Ramp Metering [Naeem Rezghi]](https://cdn.slidesharecdn.com/ss_thumbnails/naeemrezghipresentation-130215110908-phpapp02-thumbnail.jpg?width=640&height=640&fit=bounds)


