Downloaded 103 times

![Network basics
The study of relationships
Research design
Data representation
Digging into data
Analysis & Visualization
Live demonstration
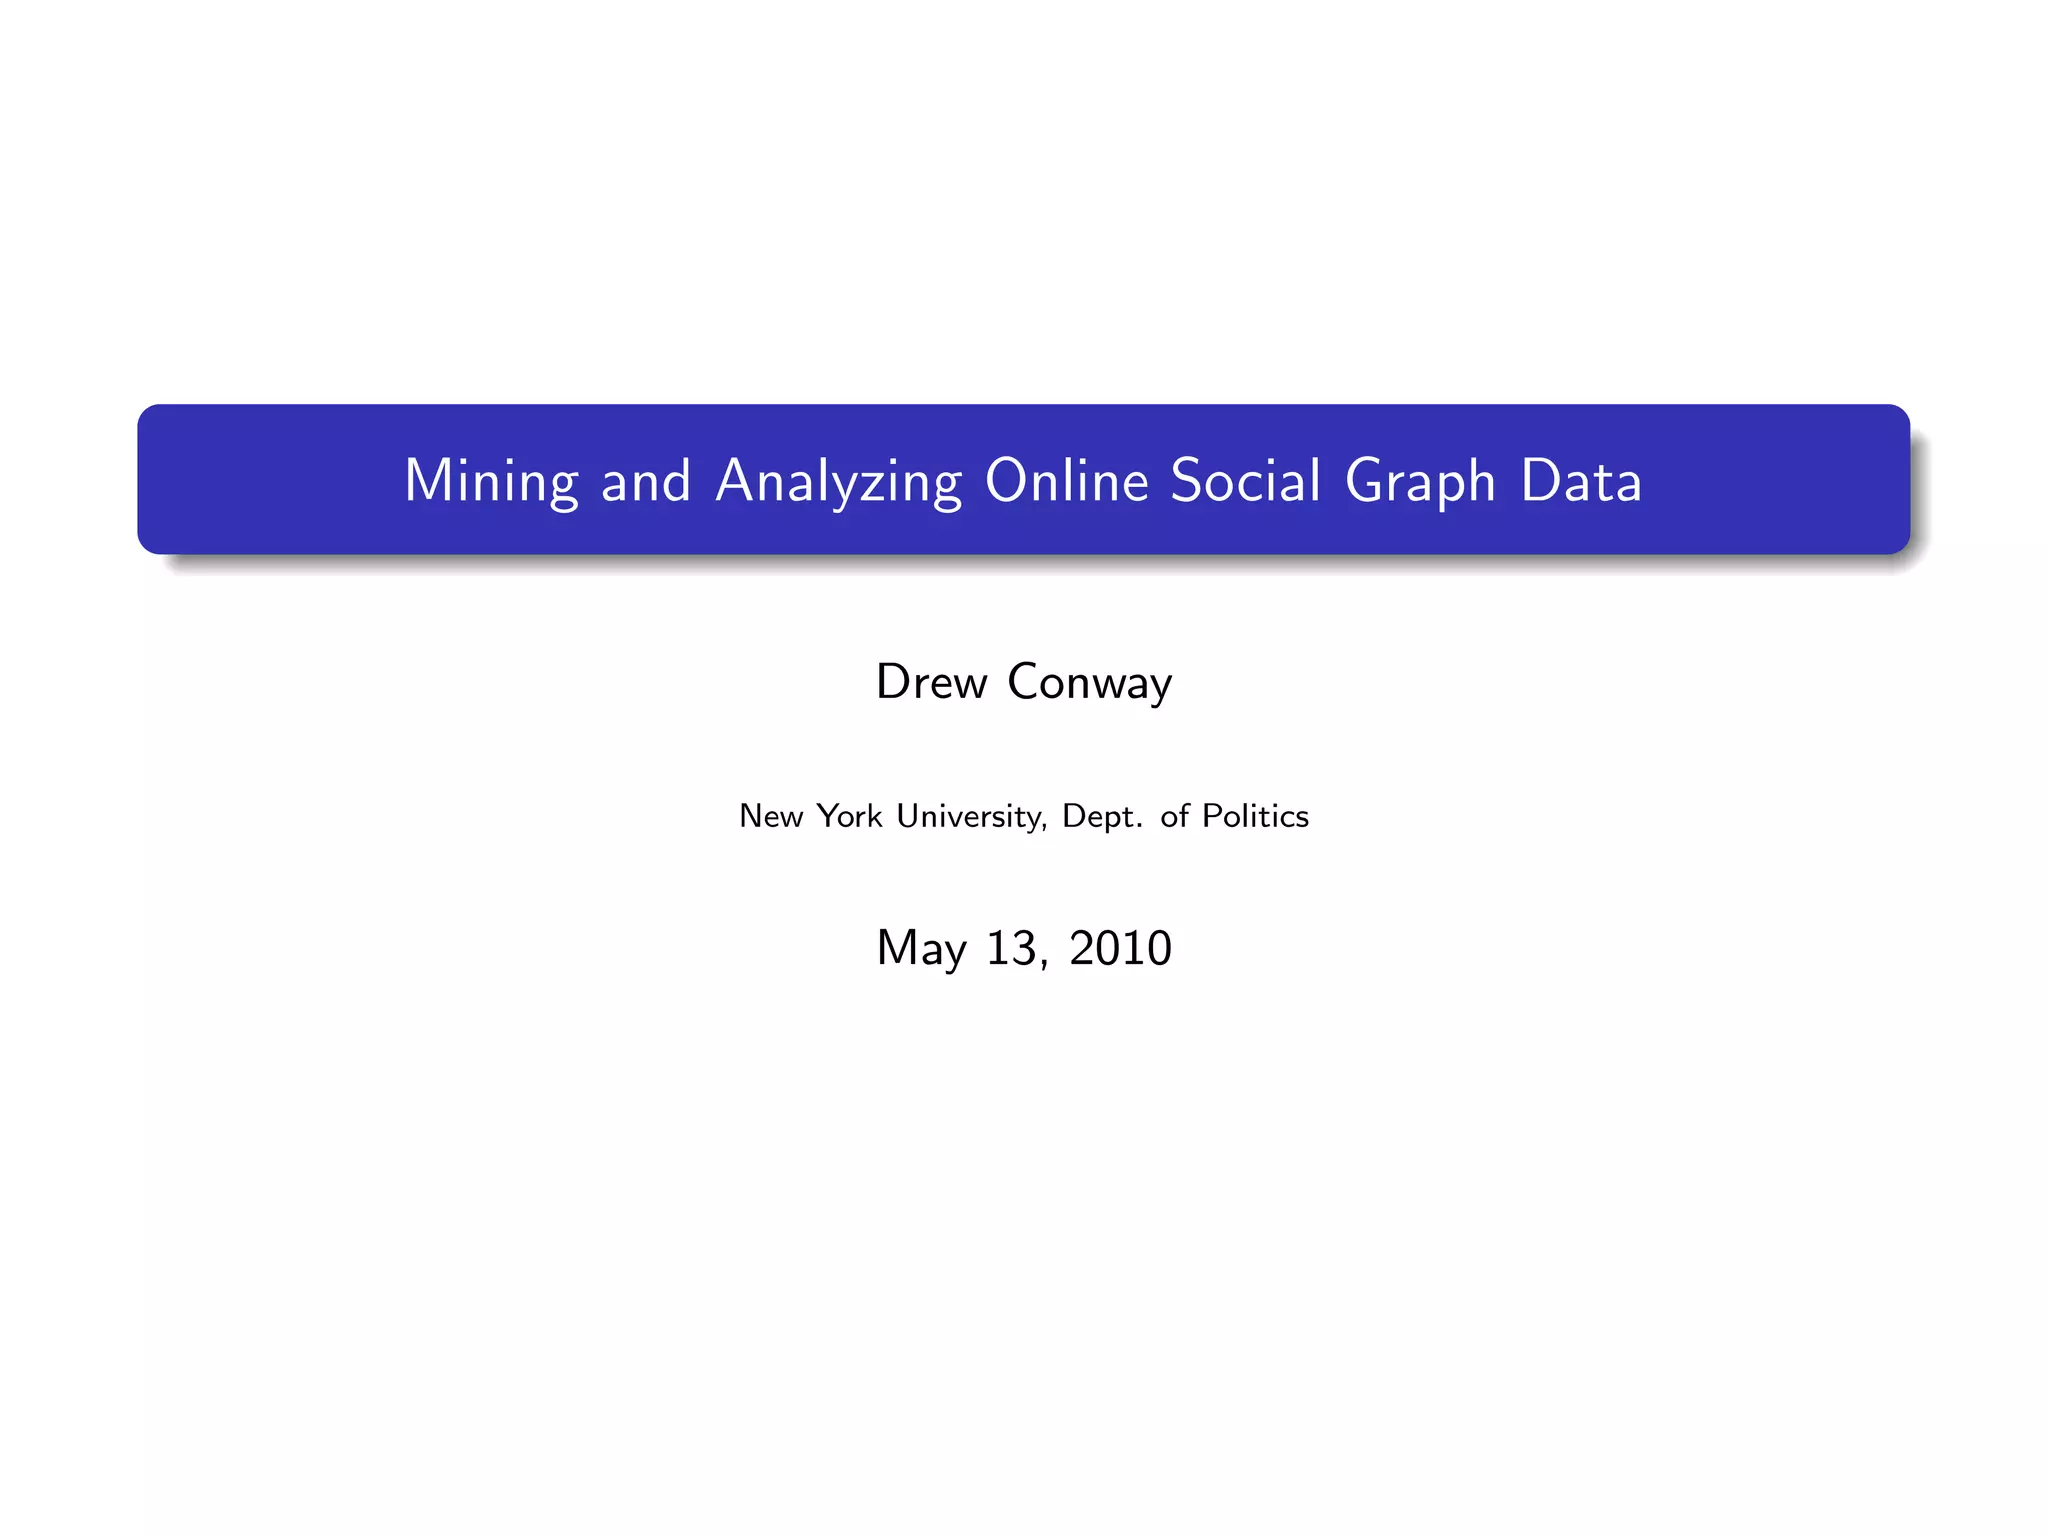
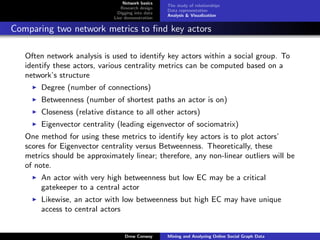
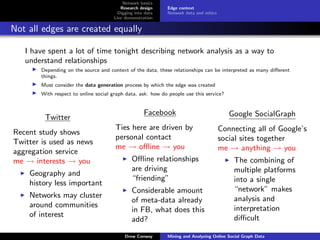
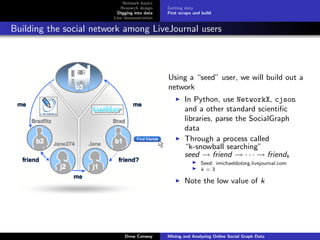
Key Actor Plot
q
q
q
q
q
q
q
q
q q
q
q
q
q
q
q
q
q
q q
q
q q
q
q q q q q
q
q
141
q
q
q q
q 155 Network plot
q
q
q
q
q
q q
58 47 44 q
q q # Create positions for all of
q 28
q q
q
q q
q
q q
q
q
q q
q
q
# the nodes w/ force directed
l<-layout.fruchterman.reingold(G,
53
q
q q
q
q
q
q q q q q
niter=500)
20 50
q
q
q
q q # Set the nodes’ size relative to
q
q q
q
q
q
q
q
q
q
q
q
# their residual value
q
q
q
q
q q
q
V(G)$size<-abs(res)*10
q q
q q q
q q
q
# Only display the labels of key
q
q
q
# players
q
q
q
q q
q
nodes<-as.vector(V(G)+1)
q
q
q
q
q
q
q
q
# Key players defined as have a
q
q
q
q
# residual value >.25
nodes[which(abs(res)<.25)]<-NA
q
q
q
q
79
q
# Save plot as PDF
q q
q
pdf(‘actor_plot.pdf’,pointsize=7)
q
q q
q plot(G,layout=l,vertex.label=nodes,
q q
102 q
vertex.label.dist=0.25,
q
q q q
q q
q
q
q
q
q
q
q
q
q
vertex.label.color=‘red’,edge.width=1)
q
q
q
q q
q q
q
q
dev.off()
q q
q
q q q
q q
q
q
q
q
q
q q
q
q q
q
q
q
q
q
q q q
q
q
q
q
Drew Conway Mining and Analyzing Online Social Graph Data](https://image.slidesharecdn.com/miningsocialgraphho-1285966685558-phpapp01/85/Mining-Social-Graph-Data-13-320.jpg)
![Network basics
Research design Getting data
Digging into data First scrape and build
Live demonstration
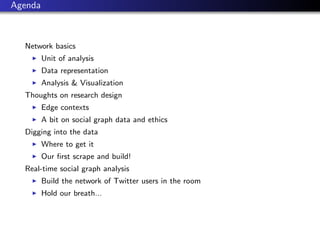
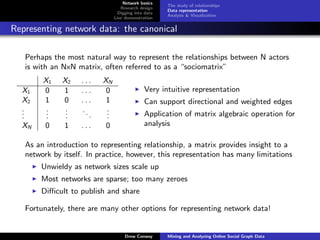
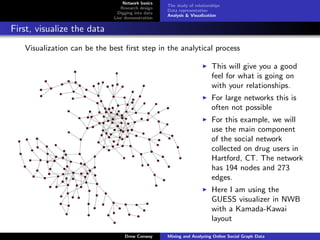
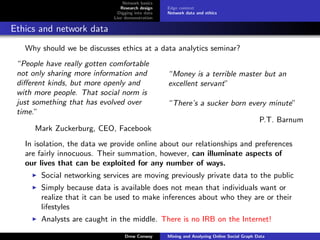
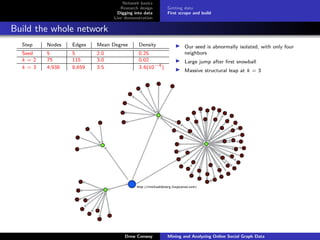
The code, part 1
Loading the libraries and setting things up
from cjson import *
from urllib import *
from networkx import *
Name: [‘http://imichaeldotorg.livejournal.com/’]
from time import *
Type: DiGraph
from scipy import array,unique
Number of nodes: 5
...
Number of edges: 5
if __name__ == "__main__":
Average in degree: 1.0
seed_url=‘‘http://imichaeldotorg.livejournal.com"
Average out degree: 1.0
sg=get_sg(seed_url)
net,newnodes=create_egonet(sg)
info(net)
Get the JSON from SocialGraph
def get_sg(seed_url):
sgapi_url="http://socialgraph.apis.google.com/lookup?q="+seed_url+"&edo=1&edi=1&fme=1&pretty=0"
try:
furl=urlopen(sgapi_url)
fr=furl.read()
furl.close()
return fr
except IOError:
print "Could not connect to website"
print sgapi_url
return
Drew Conway Mining and Analyzing Online Social Graph Data](https://image.slidesharecdn.com/miningsocialgraphho-1285966685558-phpapp01/85/Mining-Social-Graph-Data-19-320.jpg)
![Network basics
Research design Getting data
Digging into data First scrape and build
Live demonstration
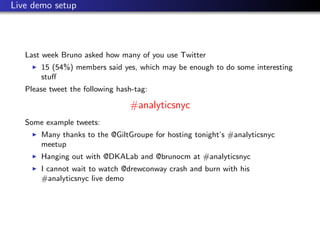
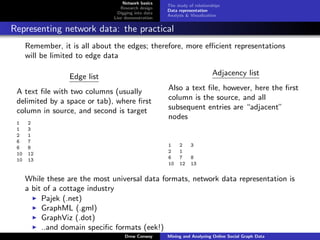
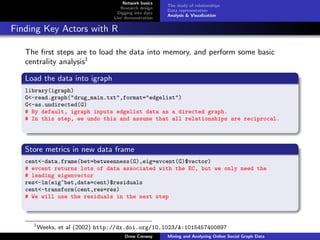
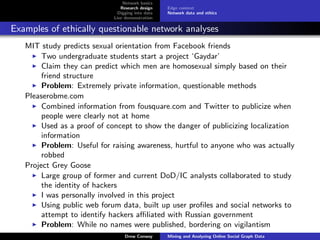
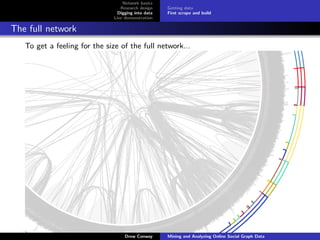
Build egonet and snowball
Creating the egonet Rolling the snowball
def create_egonet(s): def snowball_round(G,seeds,myspace=False):
try: t0=time()
raw=decode(s) if myspace:
G=DiGraph() seeds=get_myspace_url(seeds)
pendants=[] sb_data=[]
n=raw[’nodes’] for s in range(0,len(seeds)):
nk=n.keys() s_sg=get_sg(seeds[s])
G.name=str(nk) new_ego,pen=create_egonet(s_sg)
pendants=[] for p in pen:
for a in range(0,len(nk)): sb_data.append(p)
for b in range(0,len(nk)): if s<1:
if a!=b: sb_net=compose(G,new_ego)
G.add_edge(nk[a],nk[b]) else:
for k in nk: sb_net=compose(new_ego,sb_net)
ego=n[k] del new_ego
ego_out=ego[’nodes_referenced’] if s==round(len(seeds)*0.2):
for o in ego_out: sb_net.name=’20% complete’
G.add_edge(k,o) sb_net.info()
pendants.append(o) print ’AT: ’+strftime(’%m/%d/%Y, %H:%M:%S’, gmtime())
ego_in=ego[’nodes_referenced_by’] print ’’
for i in ego_in: ...
G.add_edge(i,k) # More time keeping, probably a MUCH better way to do this
pendants.append(i) sb_data=array(sb_data)
pendants=array(pendants,dtype=str) sb_data.flatten()
pendants.flatten() sb_data=unique(sb_data)
pendants=unique(pendants) sb_net.info()
return G,pendants return sb_net,sb_data
except DecodeError:
...
except KeyError:
Drew Conway Mining and Analyzing Online Social Graph Data](https://image.slidesharecdn.com/miningsocialgraphho-1285966685558-phpapp01/85/Mining-Social-Graph-Data-20-320.jpg)

The document provides an agenda for discussing network basics, research design, digging into social graph data, and doing a live demonstration of analyzing online social networks. It begins by introducing network theory and how relationships can be represented through graphs. Metrics like degree, betweenness, closeness, and eigenvector centrality are discussed for identifying key actors in a network. Visualization and computing these metrics in R are demonstrated on a drug user social network from Hartford, CT, with the goal of finding outliers and identifying important individuals.


![Social Network Analysis [1994]](https://cdn.slidesharecdn.com/ss_thumbnails/socialnetworkanalysis1994-160617072245-thumbnail.jpg?width=640&height=640&fit=bounds)


