Download as PDF, PPTX


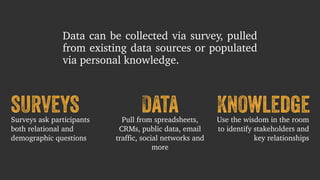


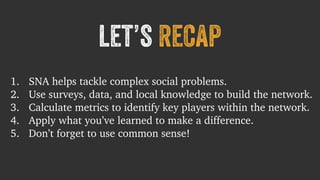


The document discusses the importance of social network analysis (SNA) in addressing complex social issues by understanding the breadth and depth of relationships within communities. It outlines a three-step approach involving data collection, interpretation of key metrics, and actionable strategies to enhance collaboration and drive social change. The author emphasizes the need to think beyond traditional organizational structures and leverage networks to impact social outcomes effectively.


