Downloaded 102 times
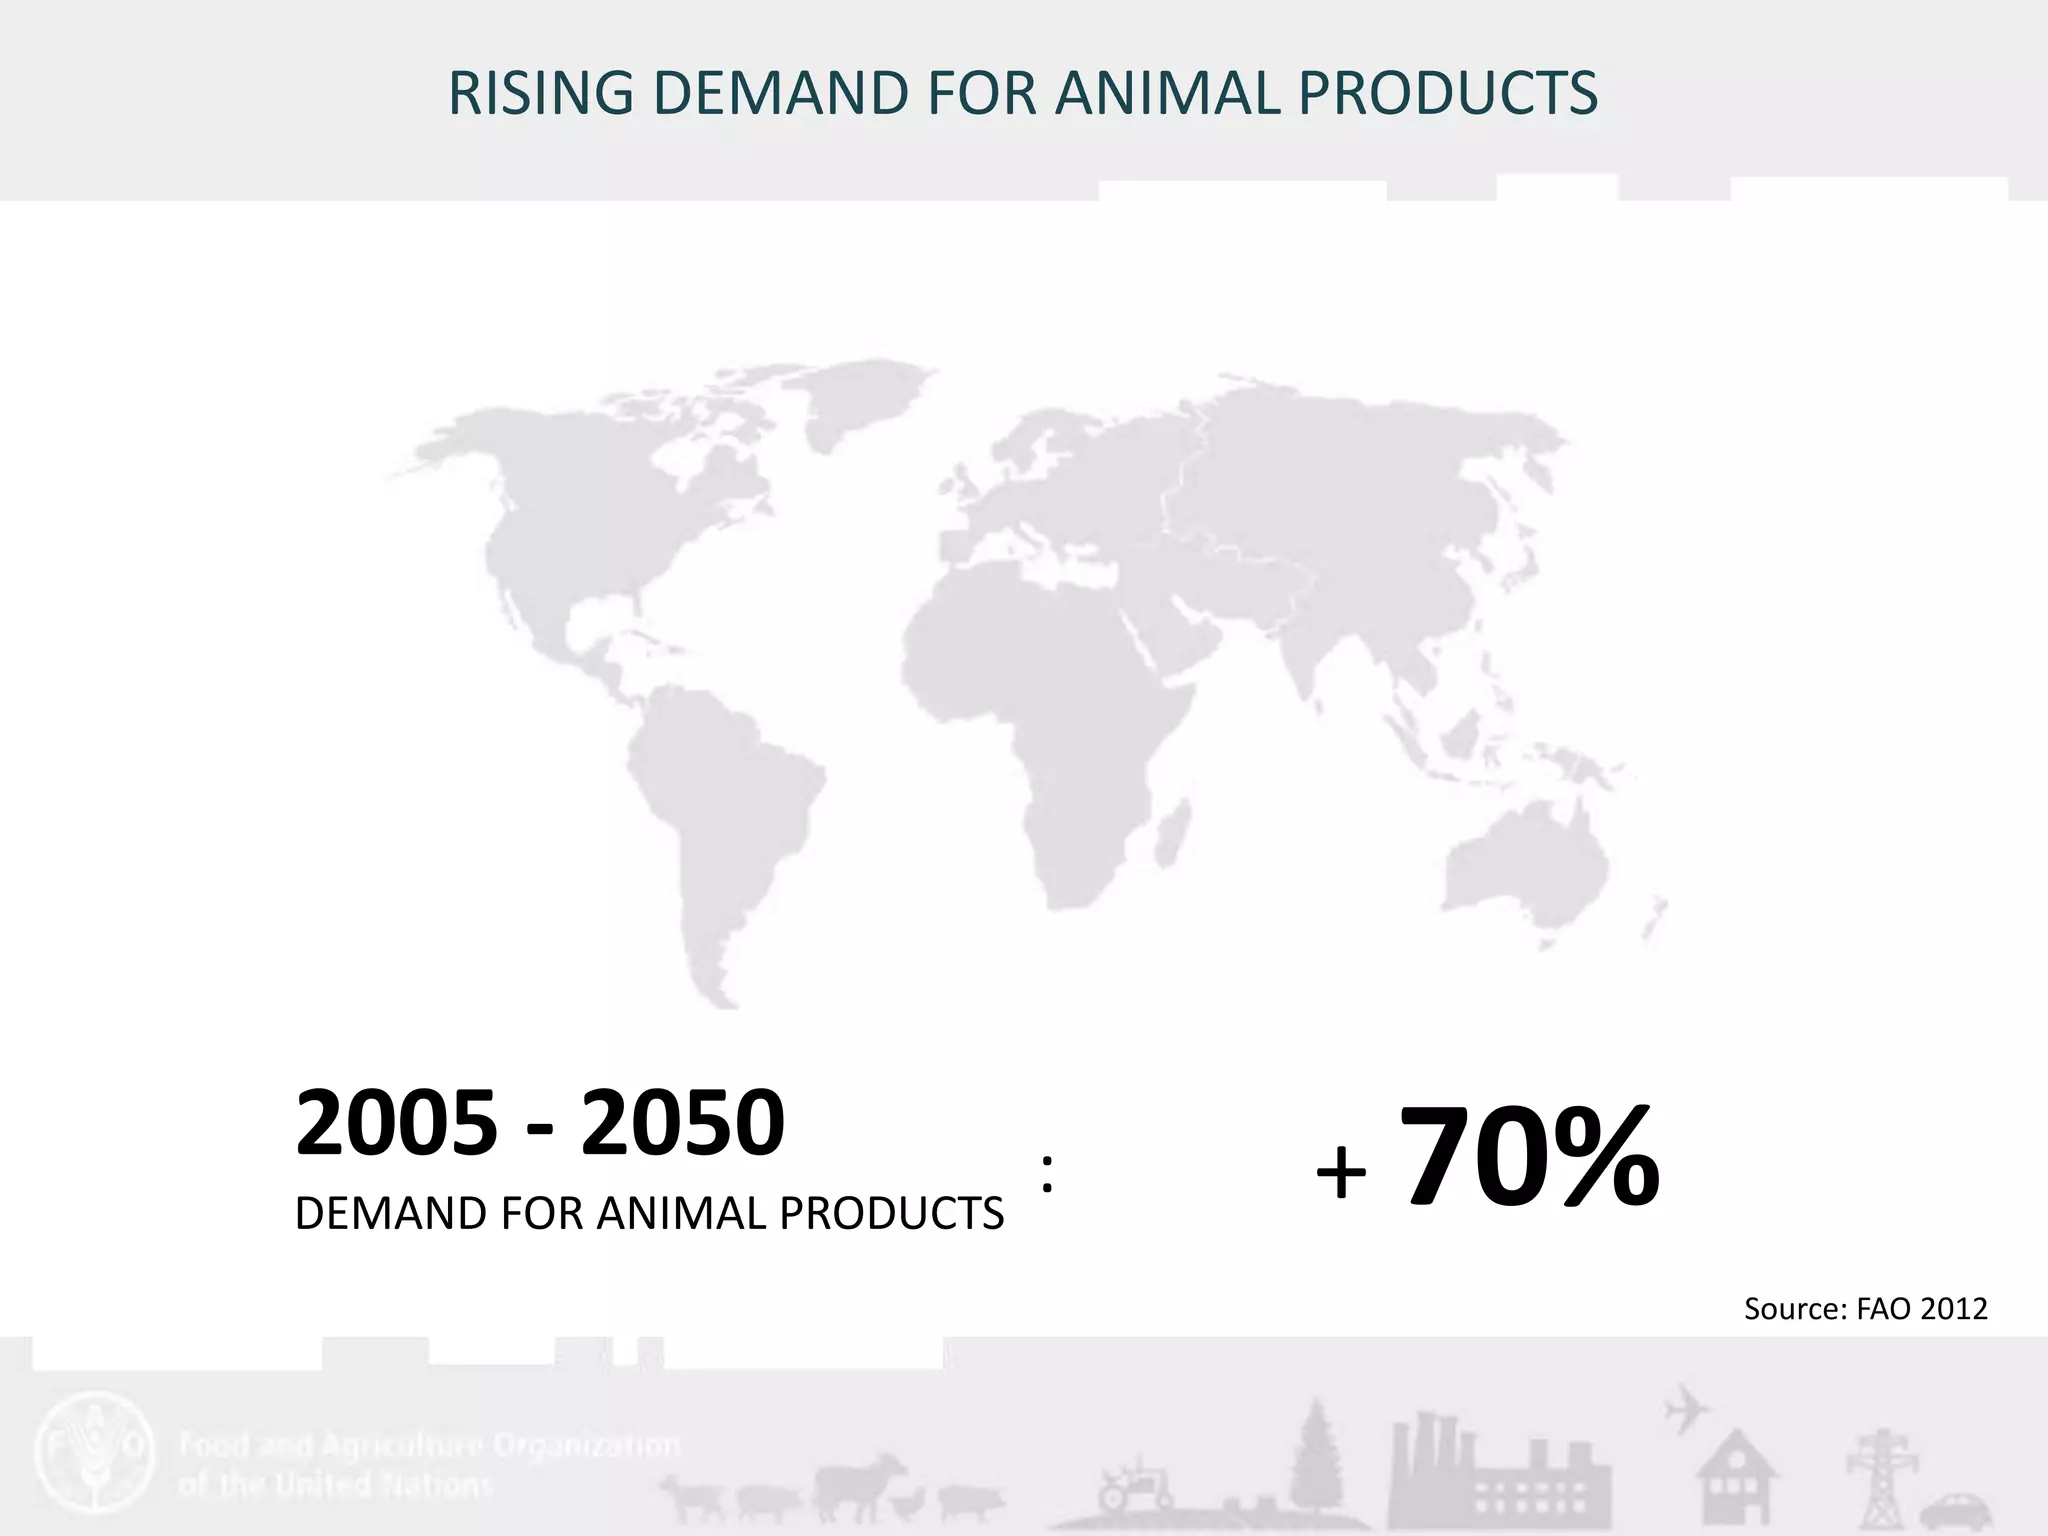
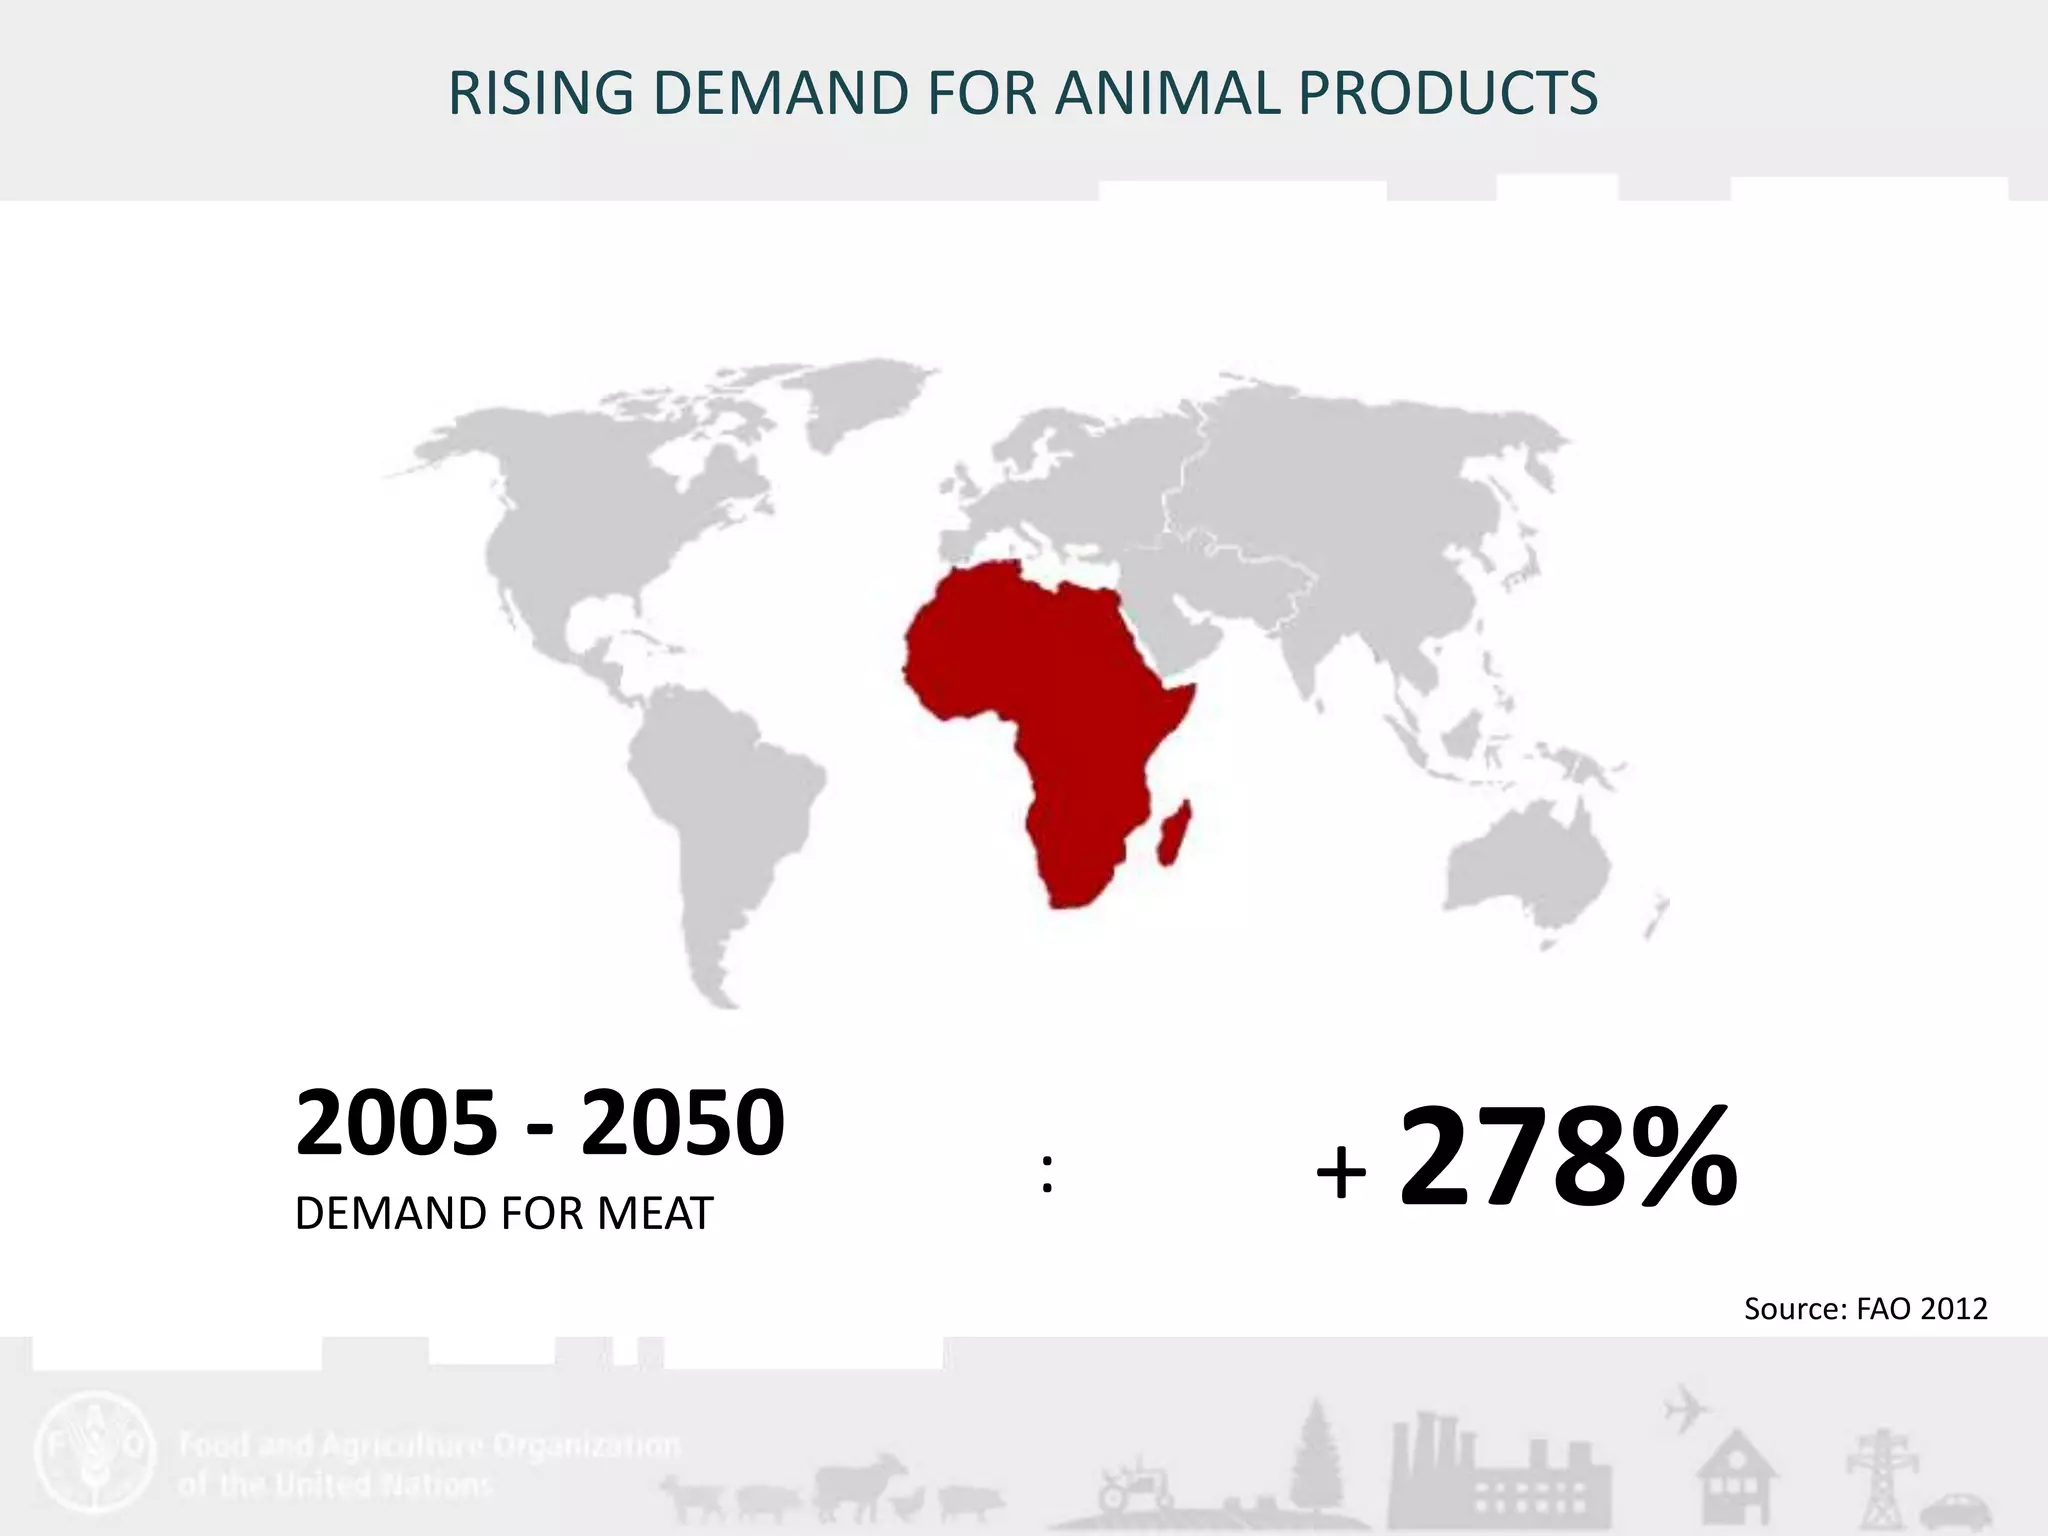
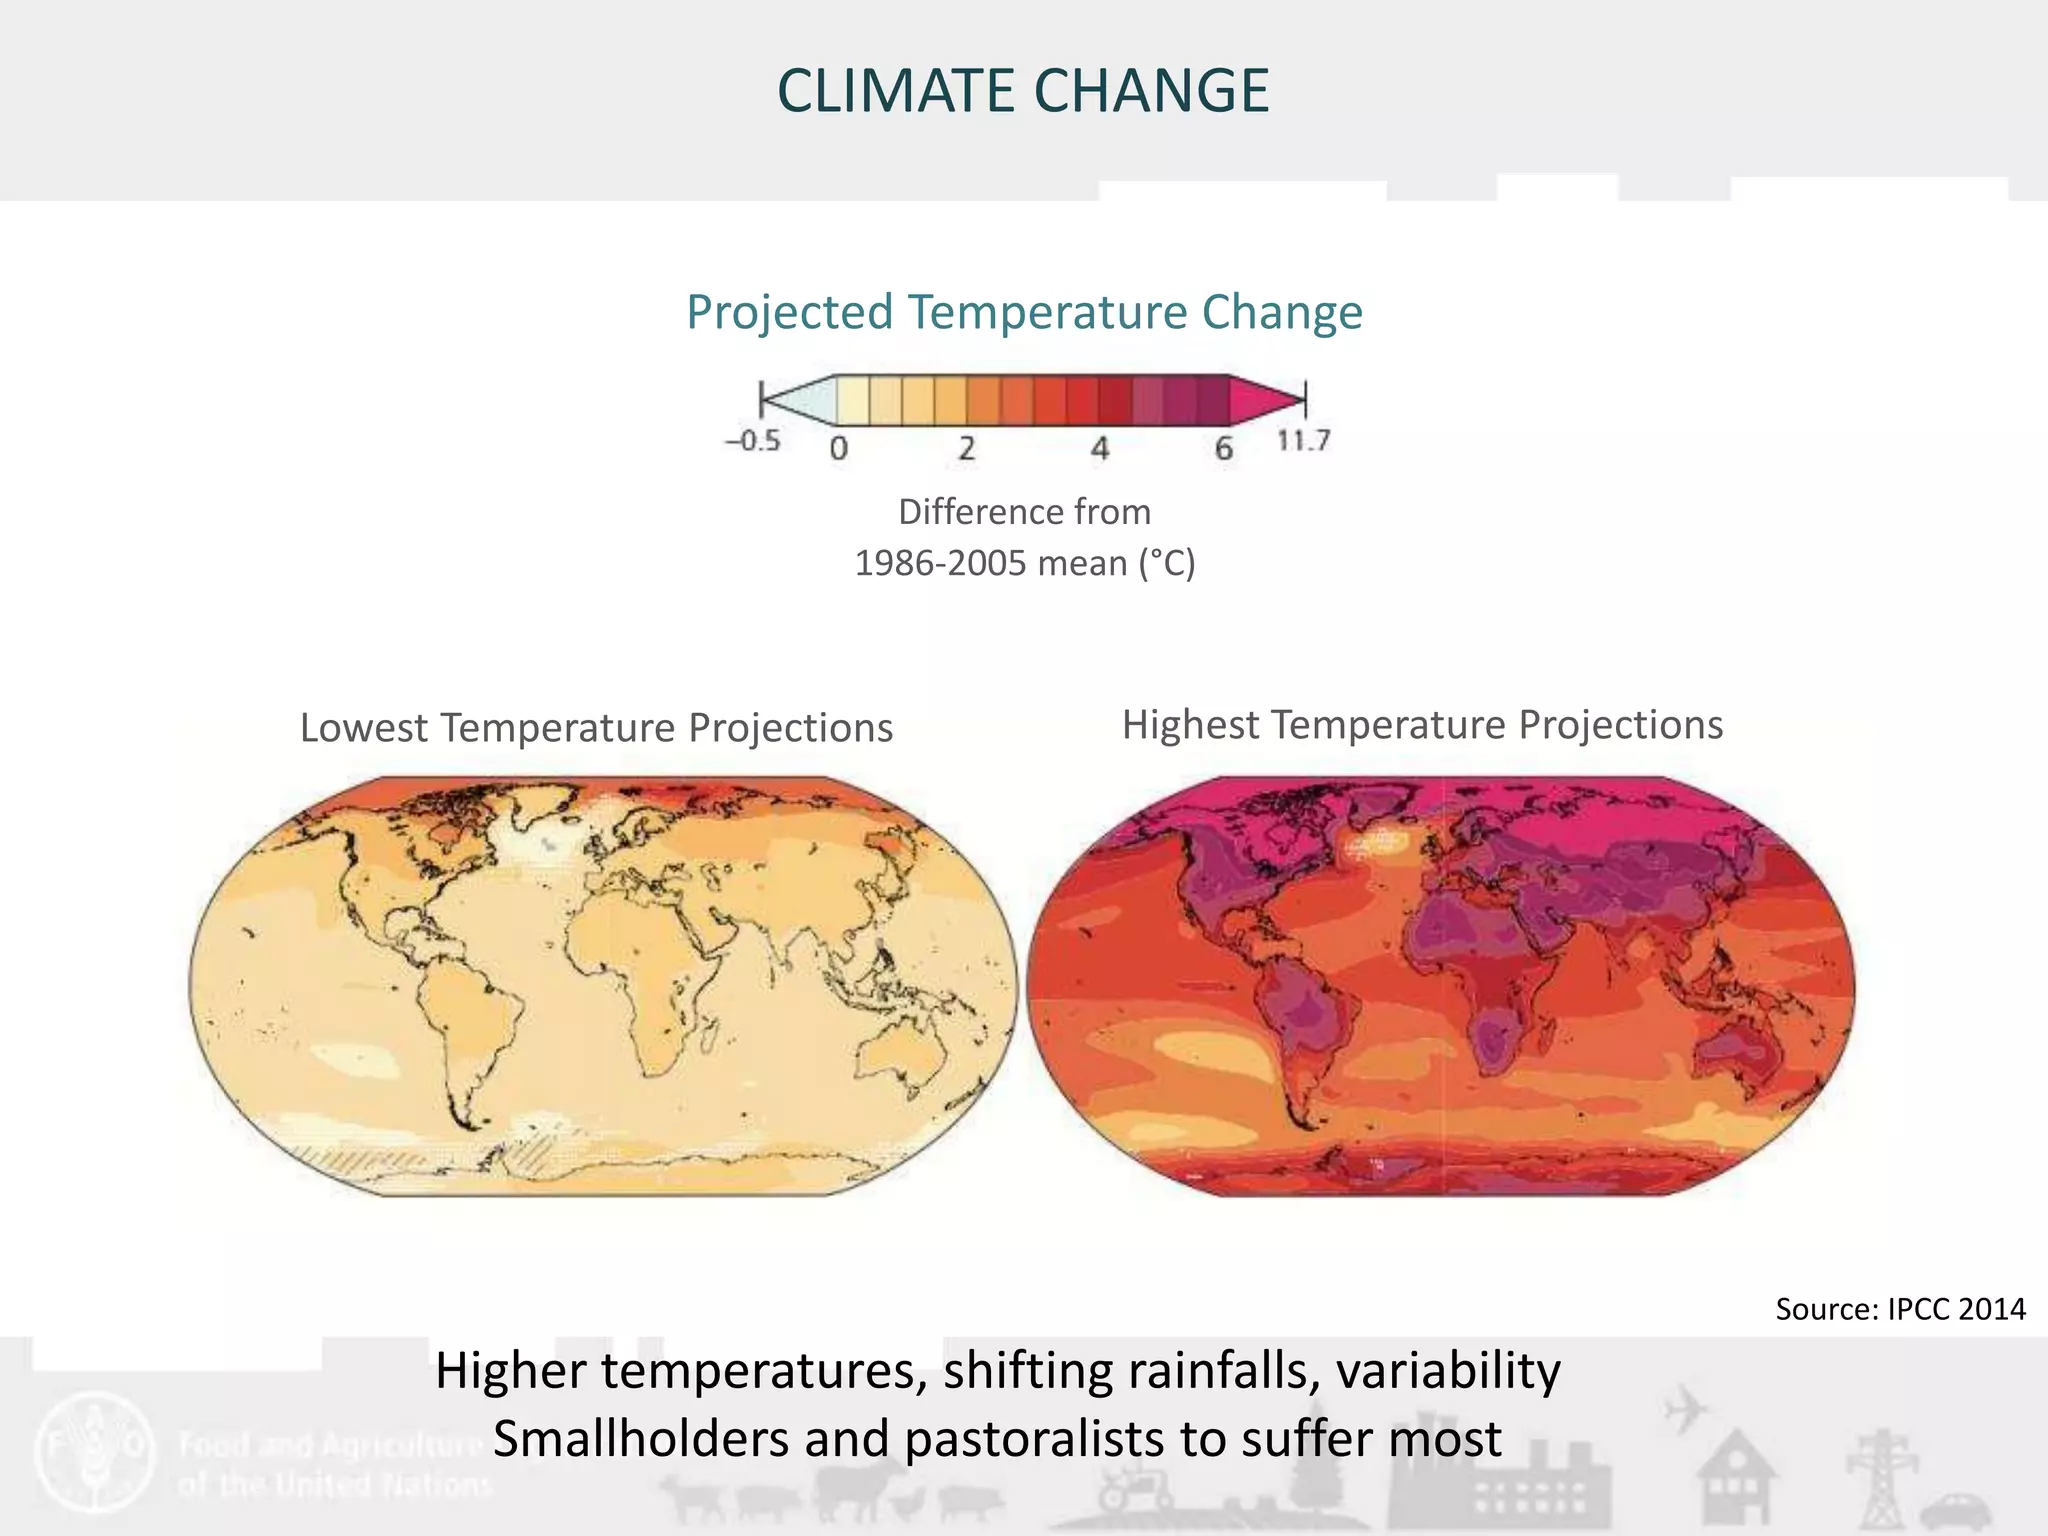
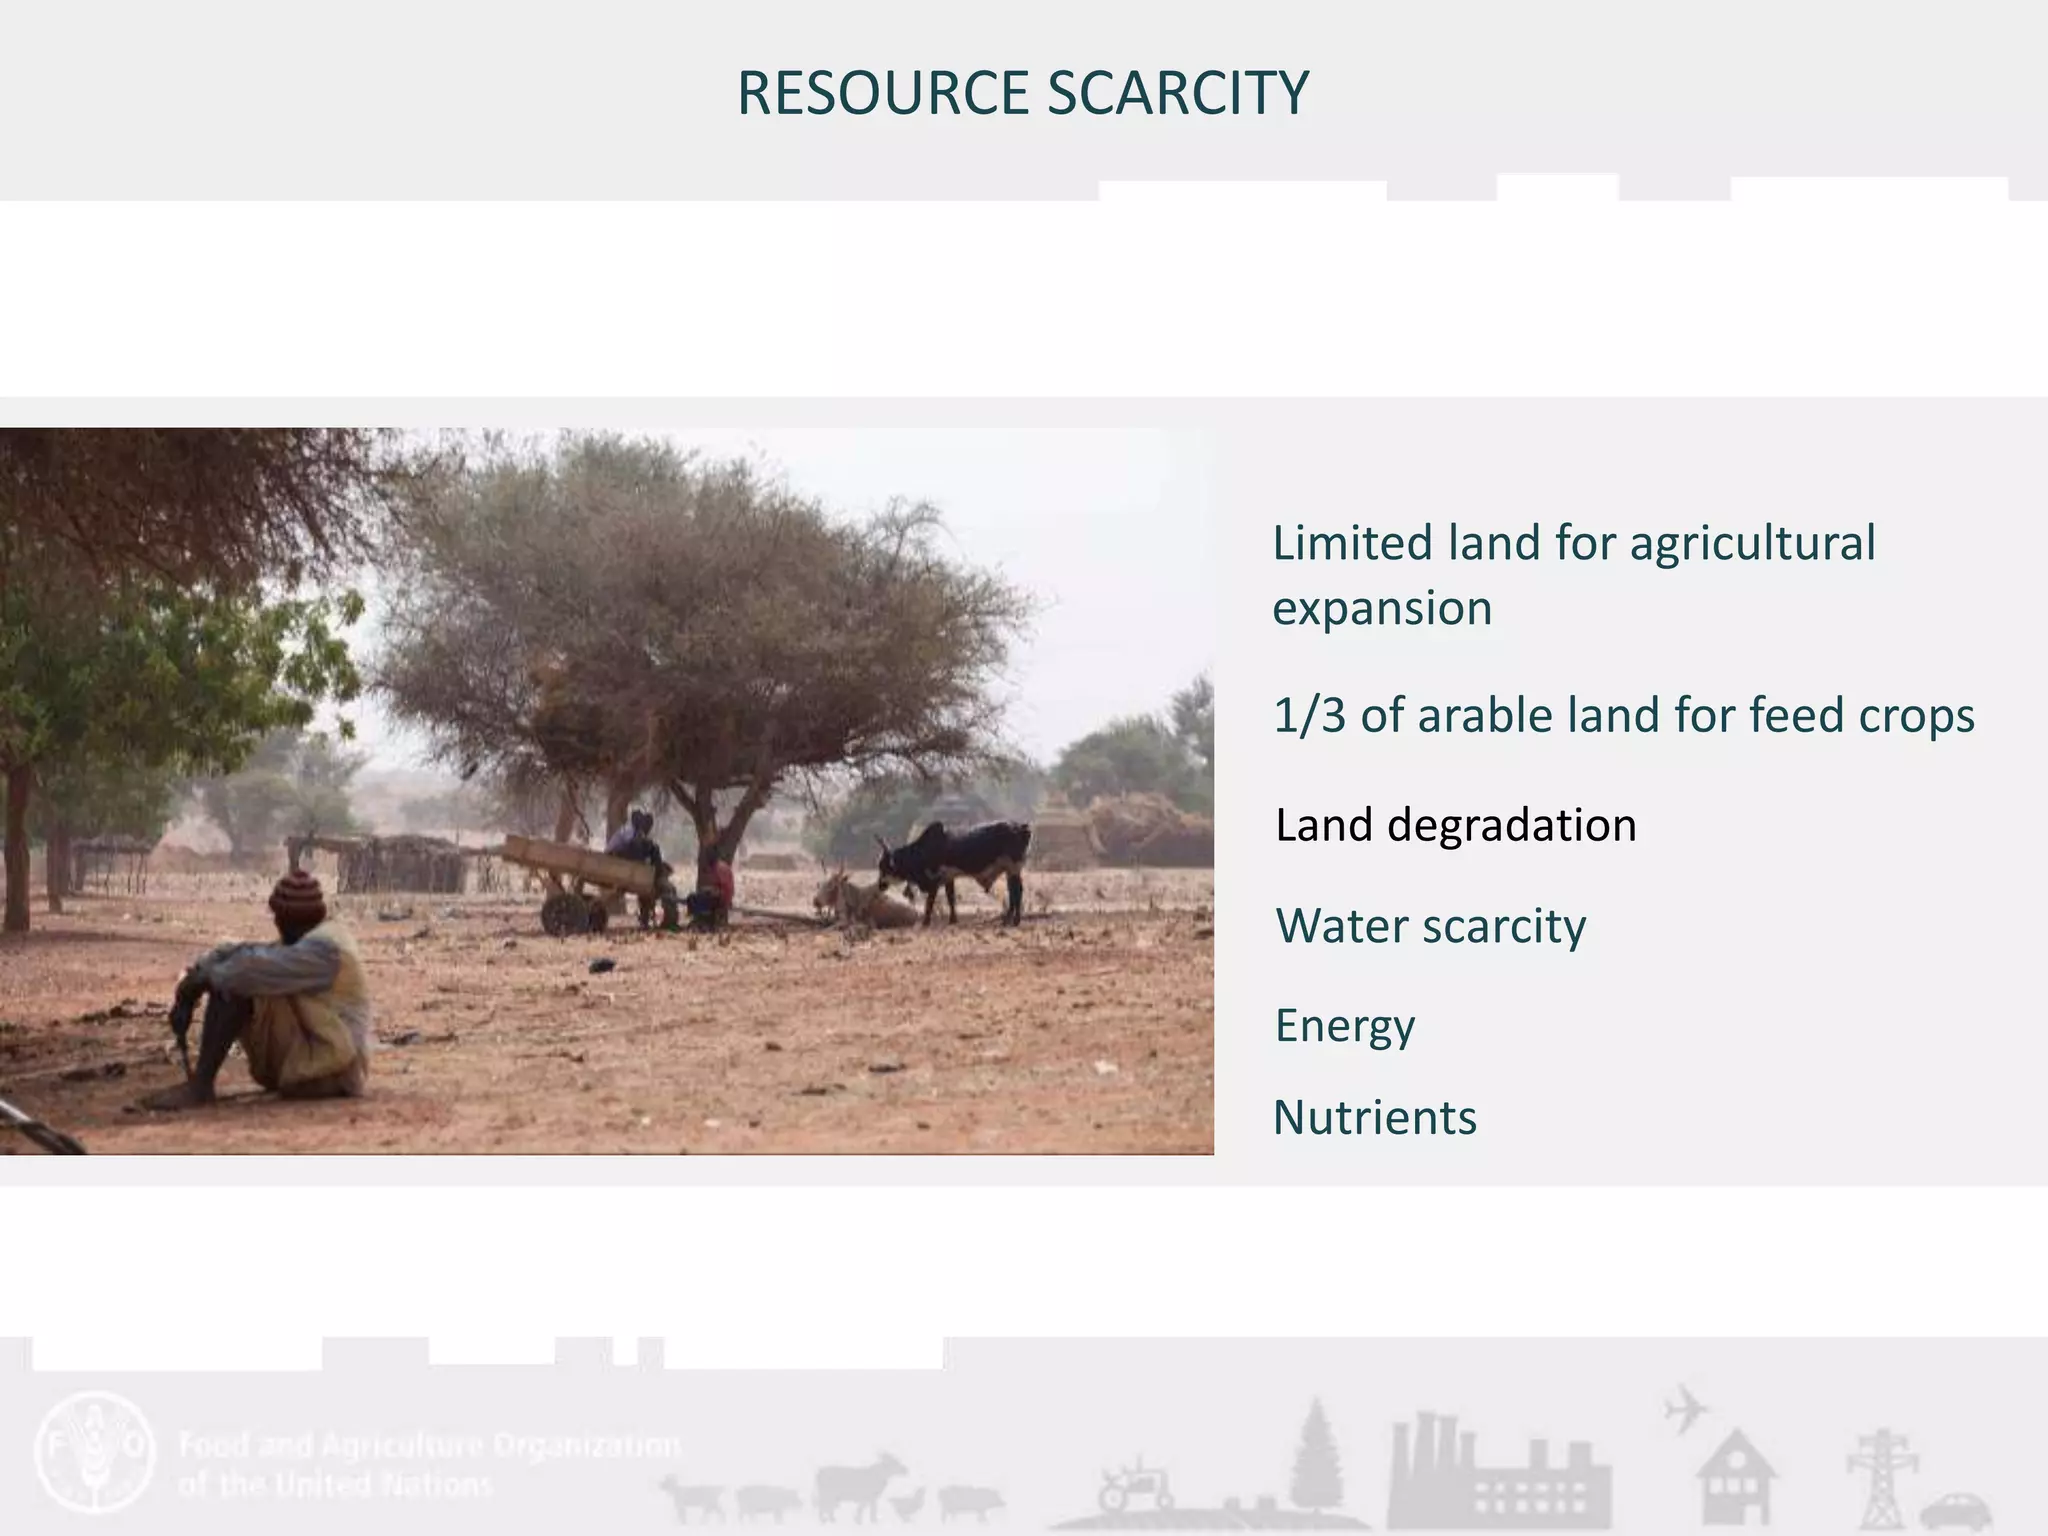
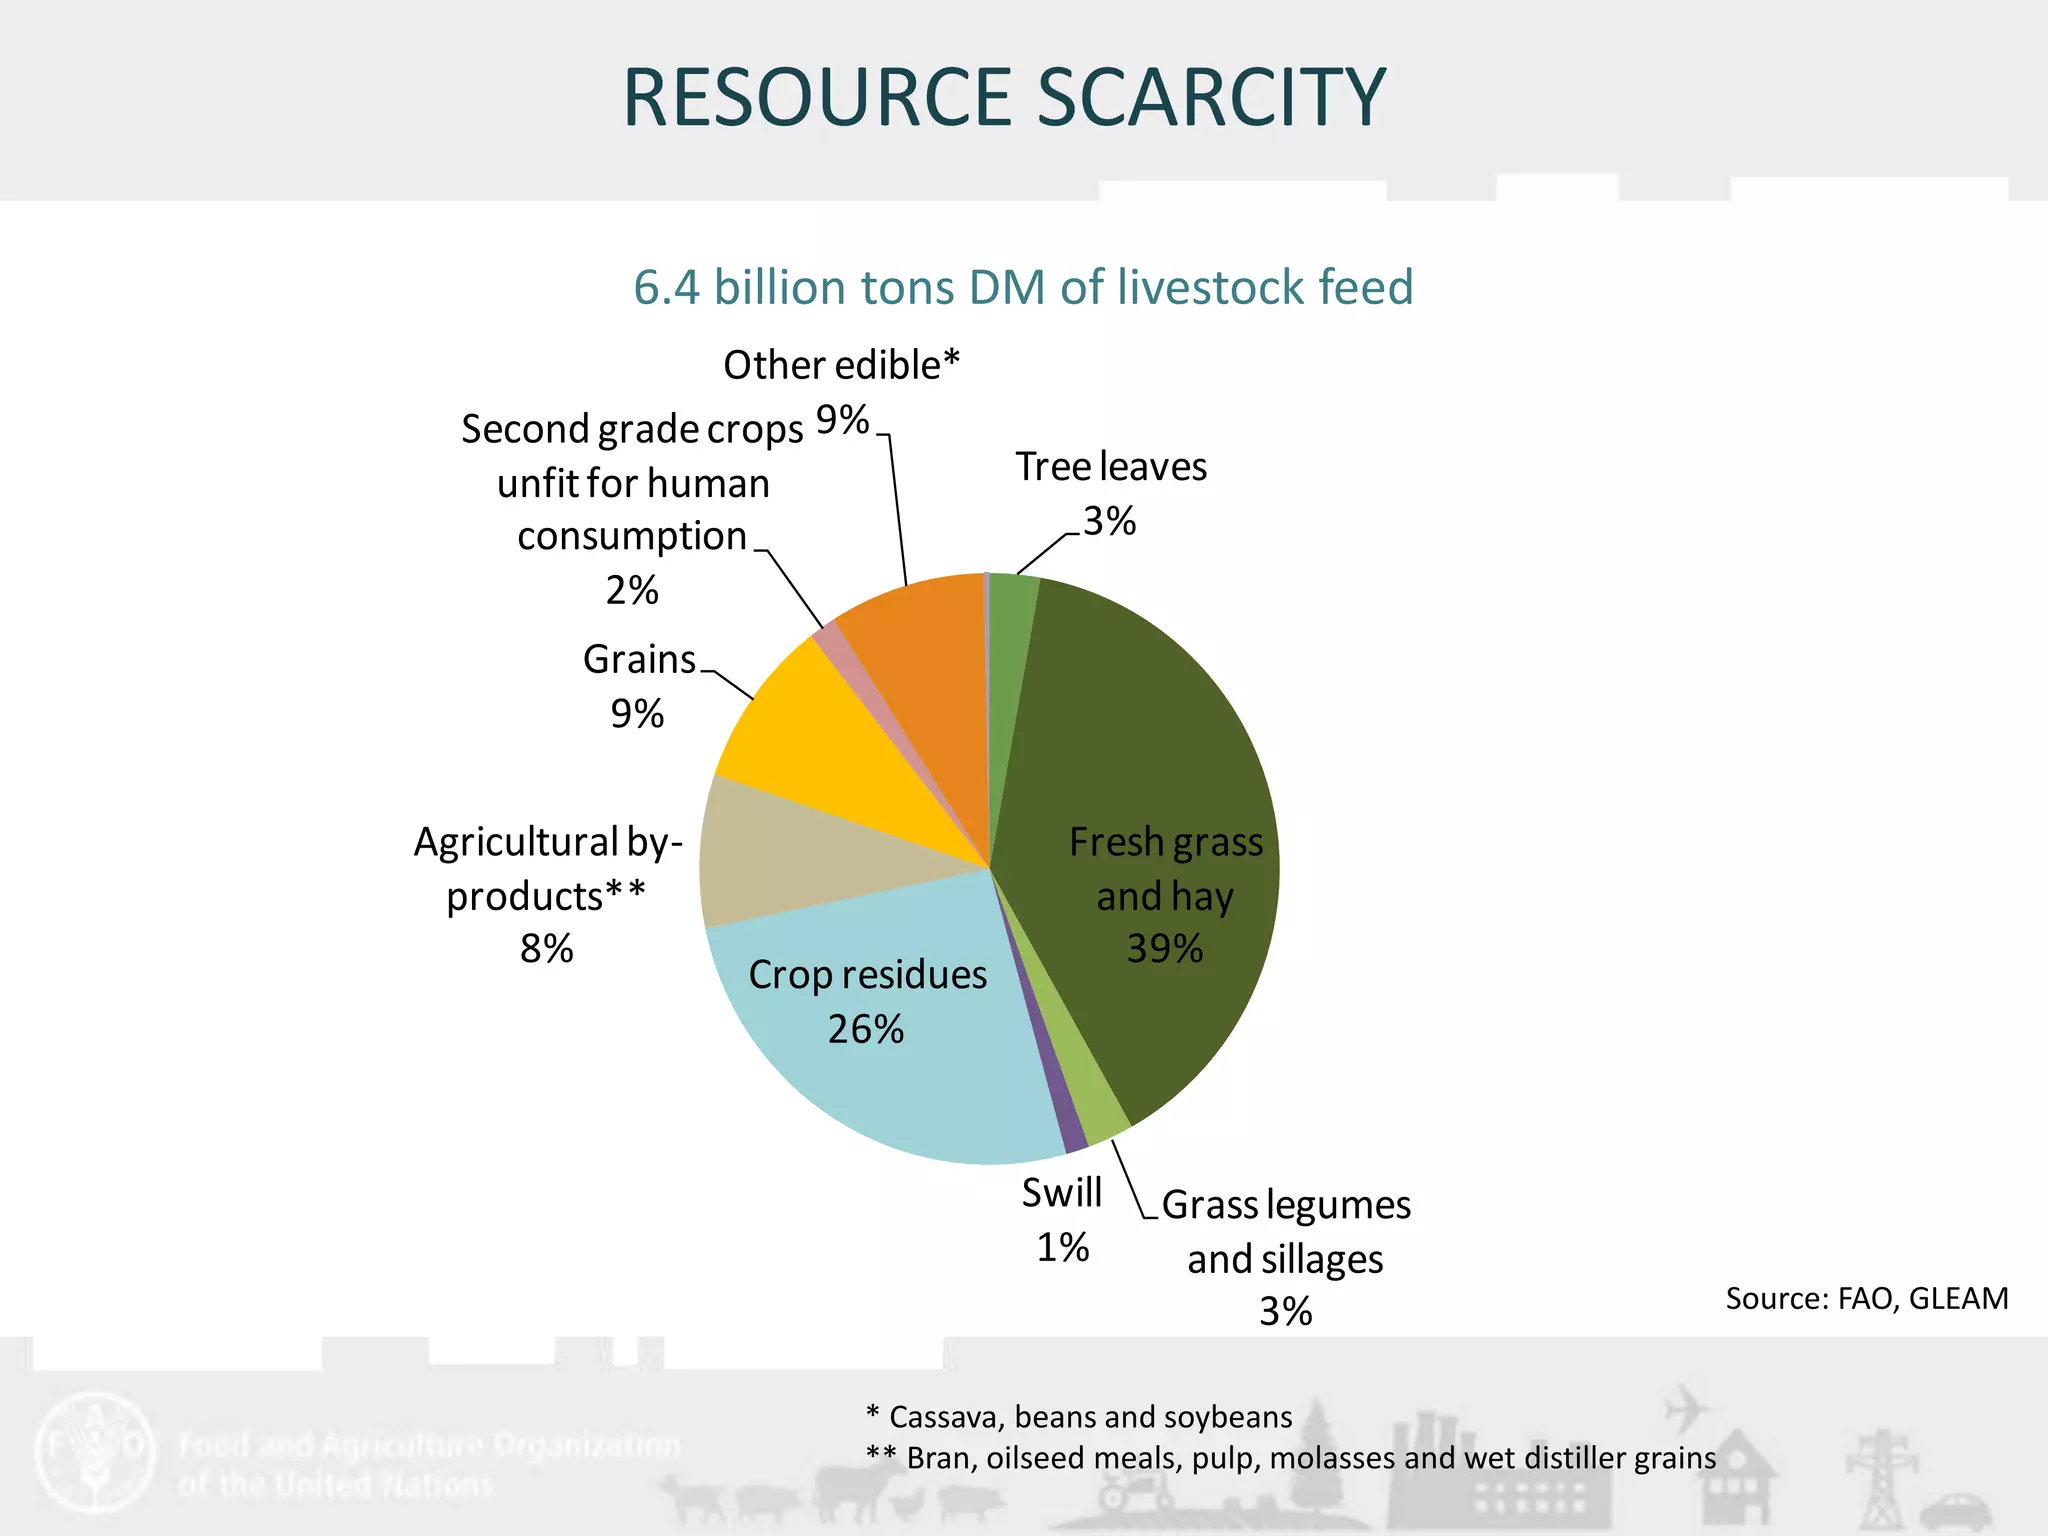
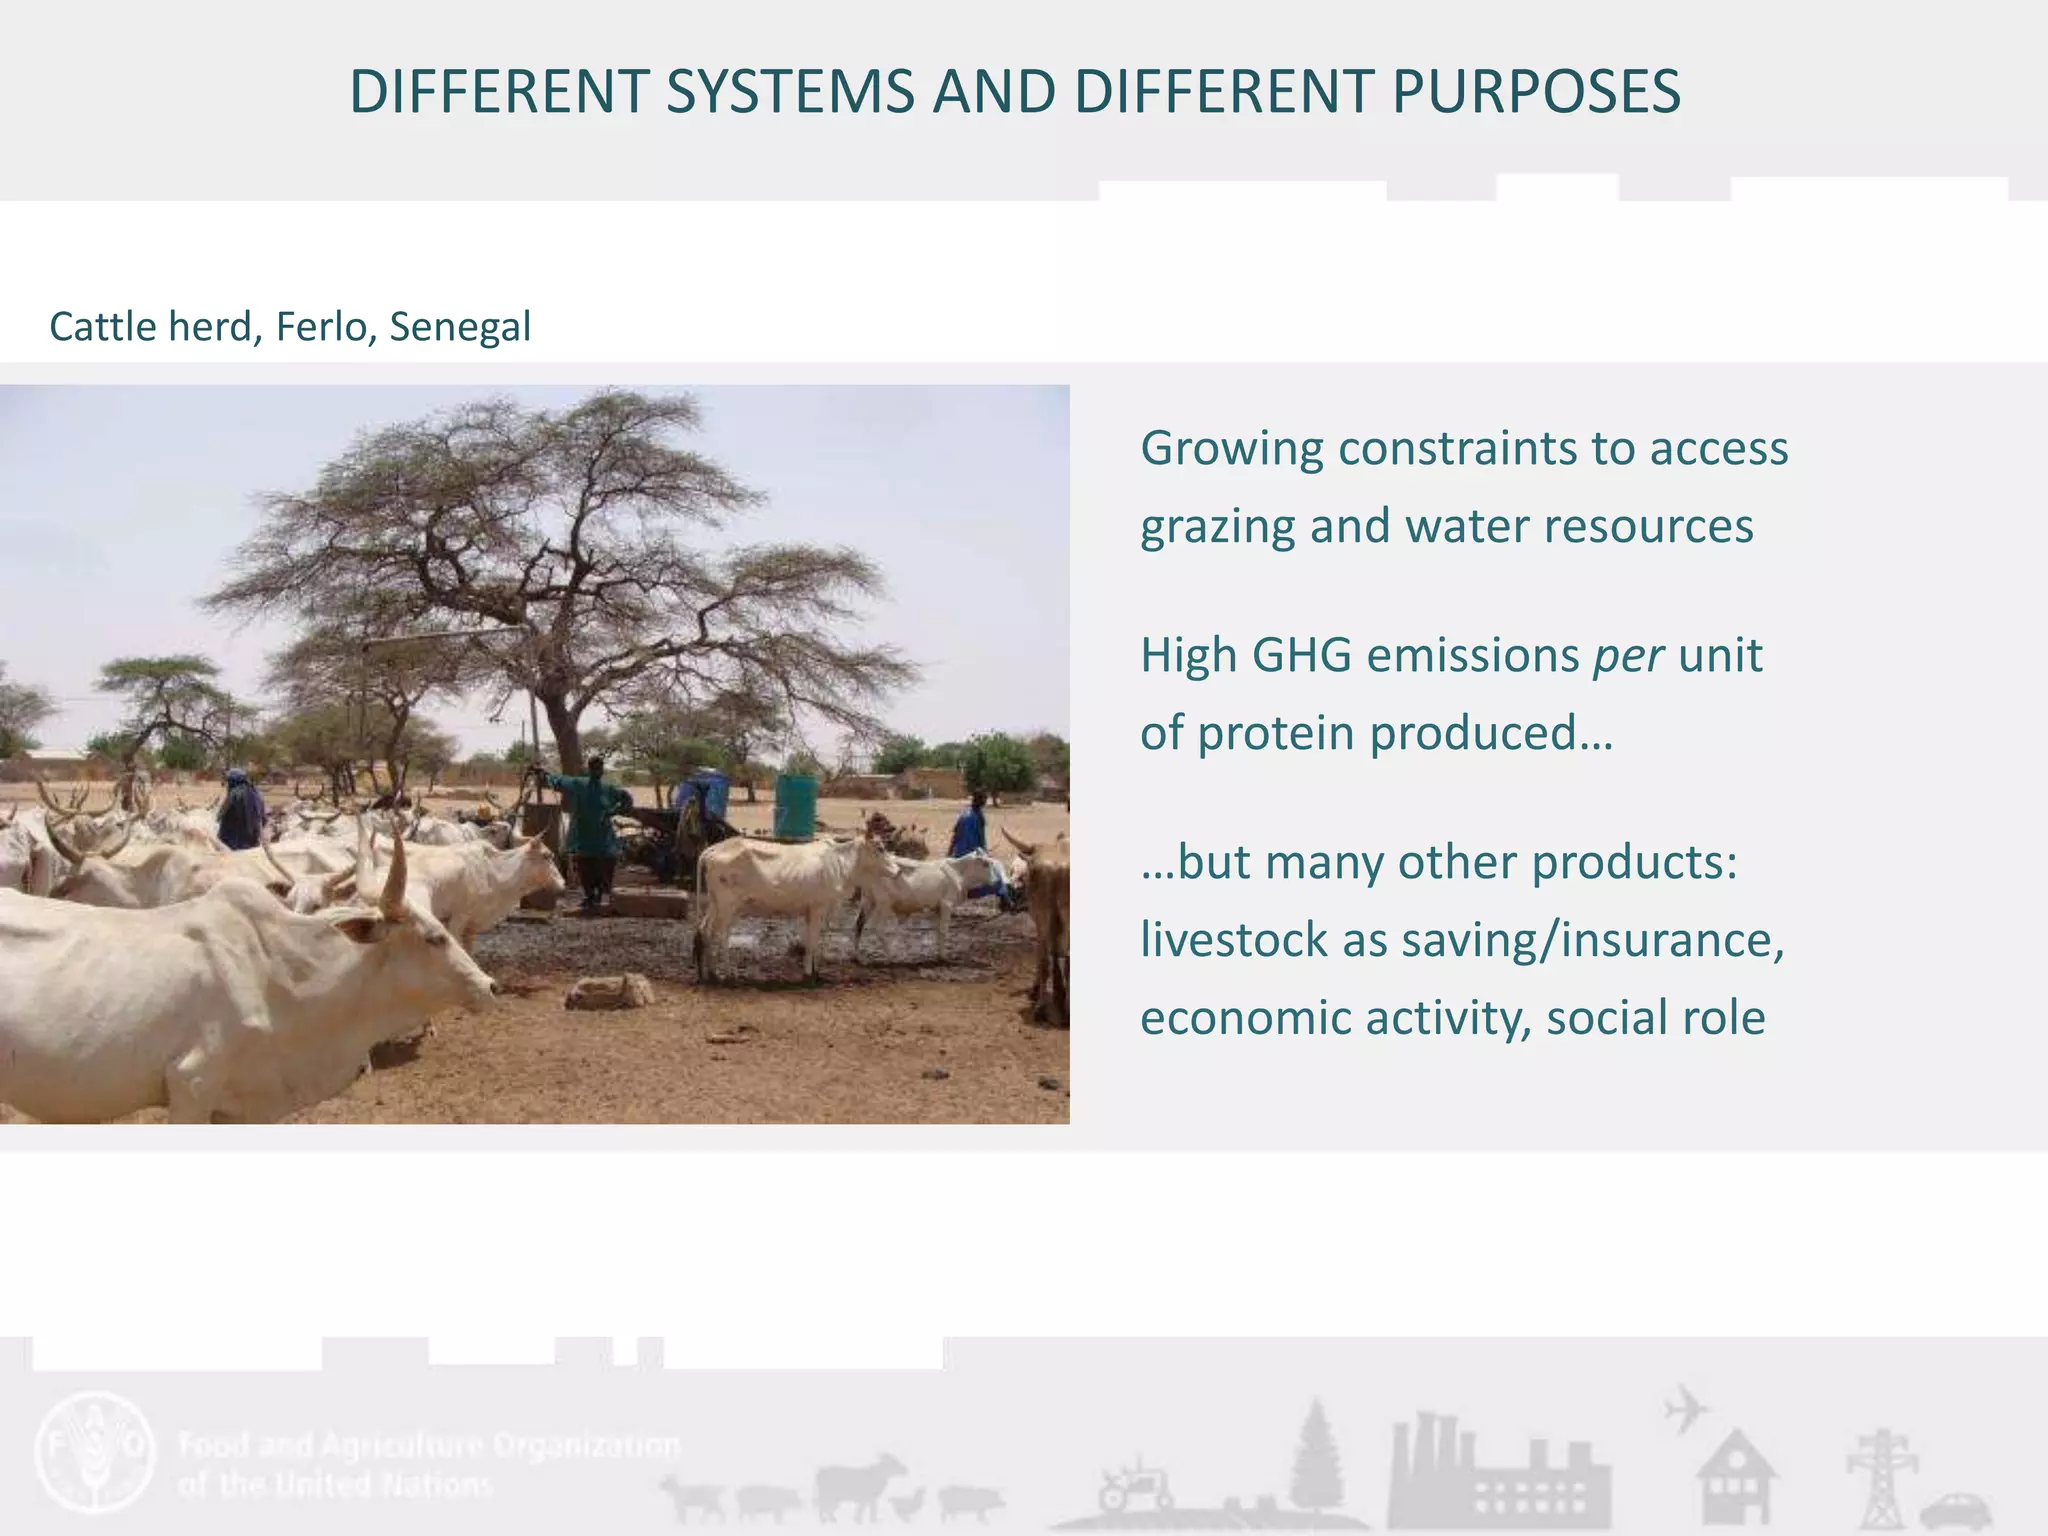
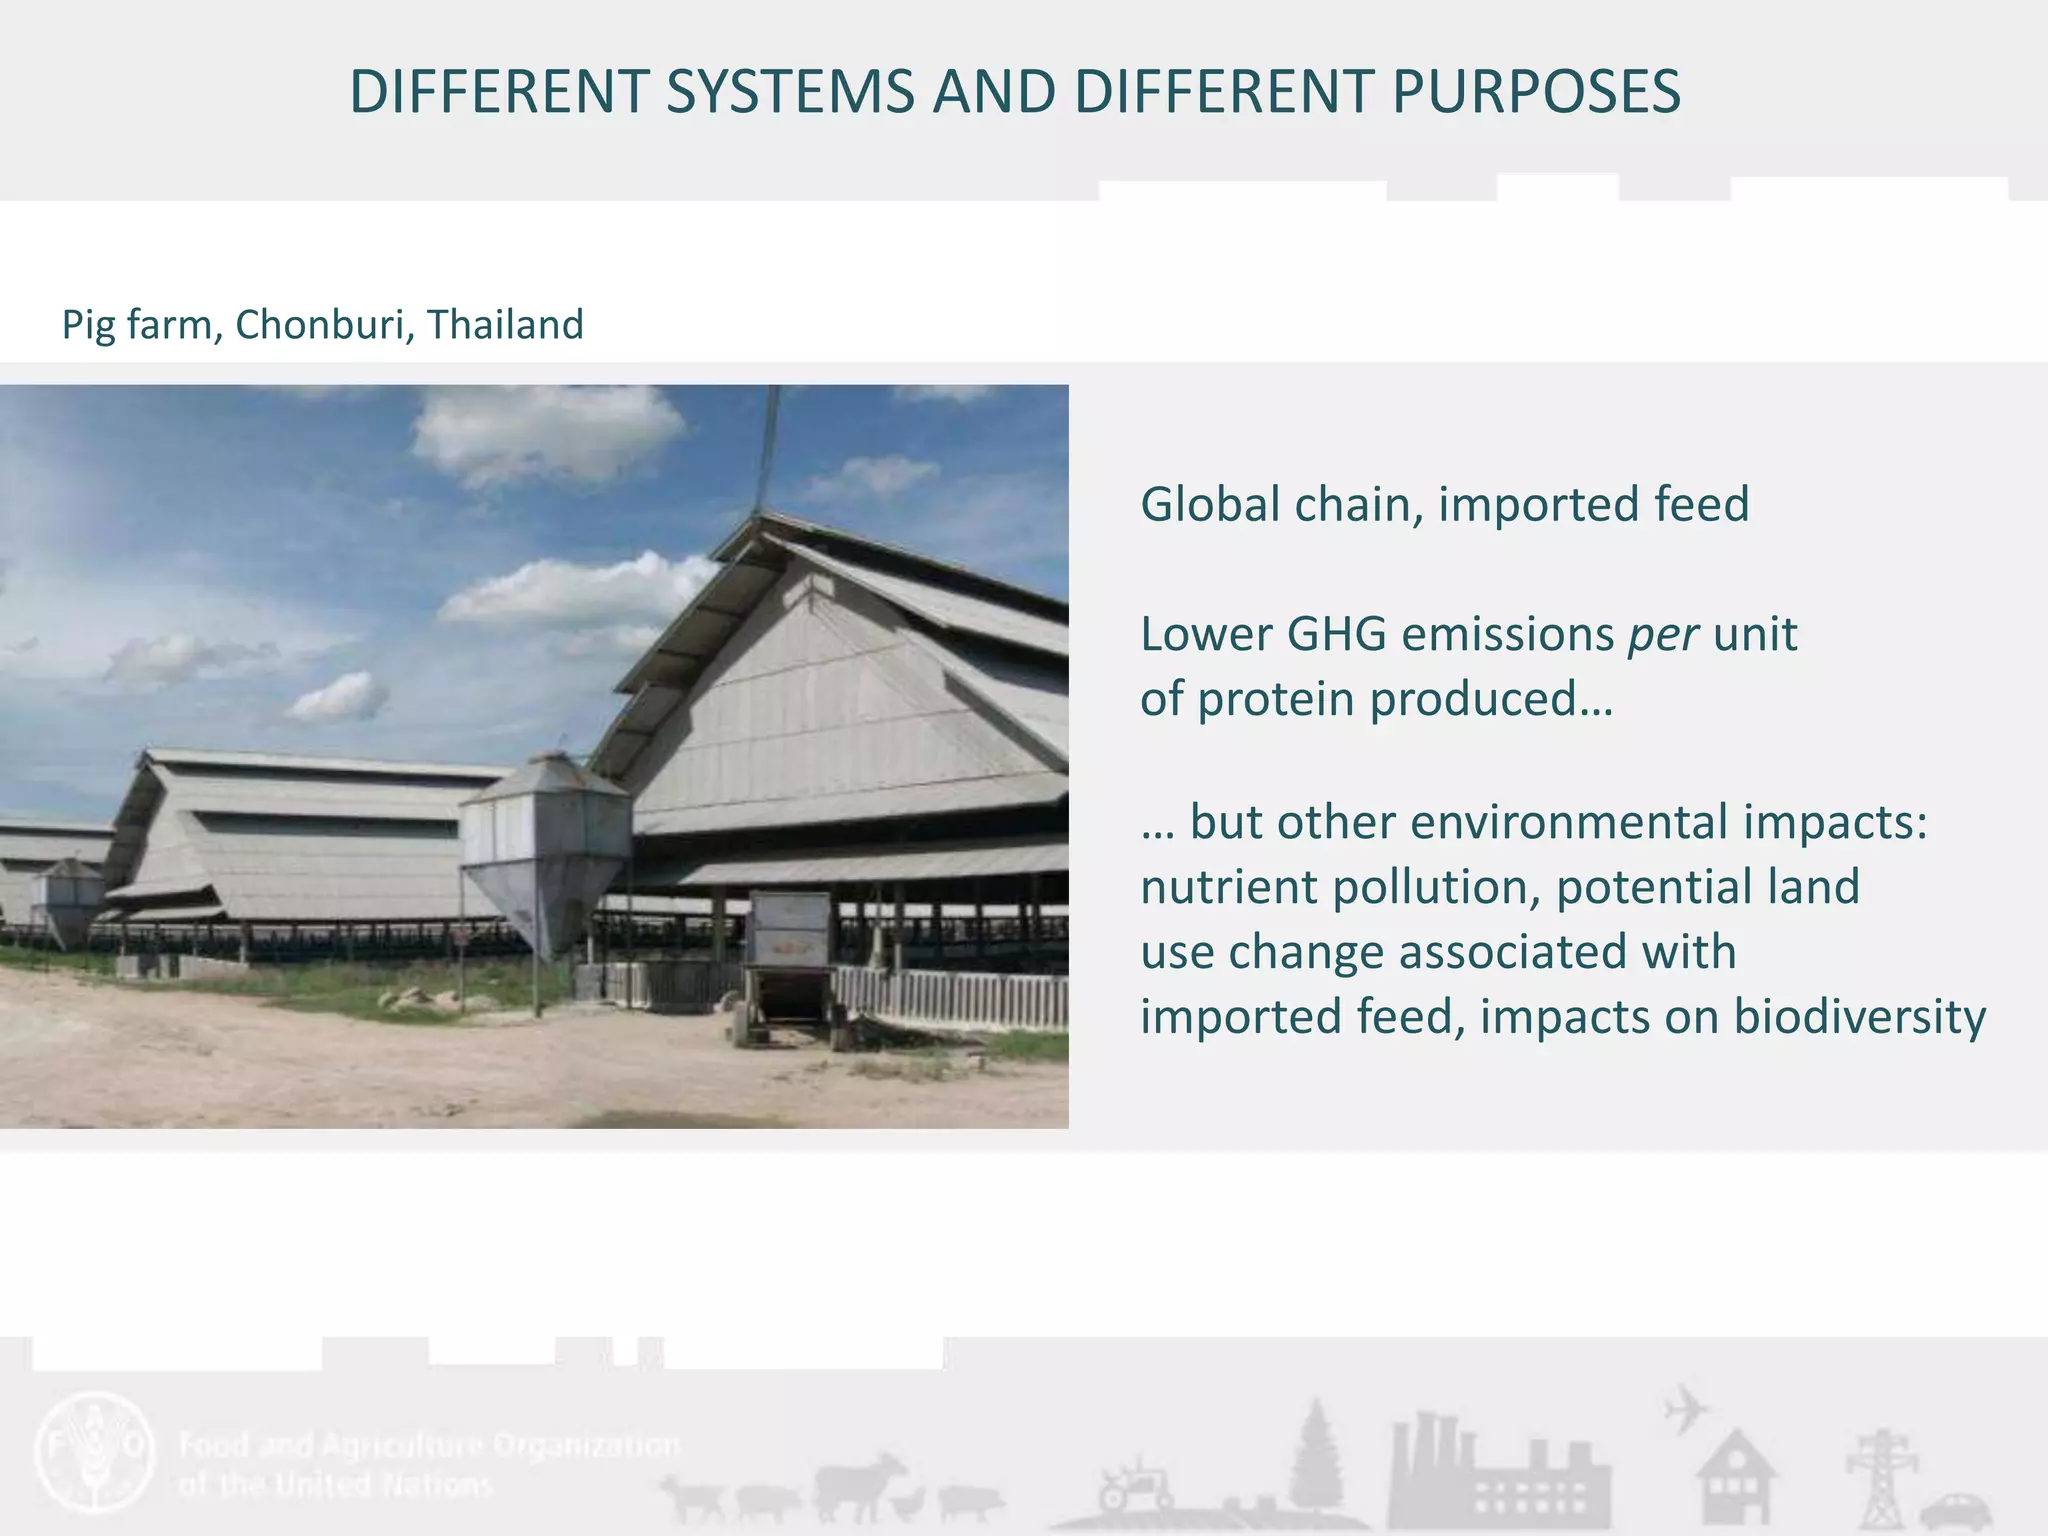
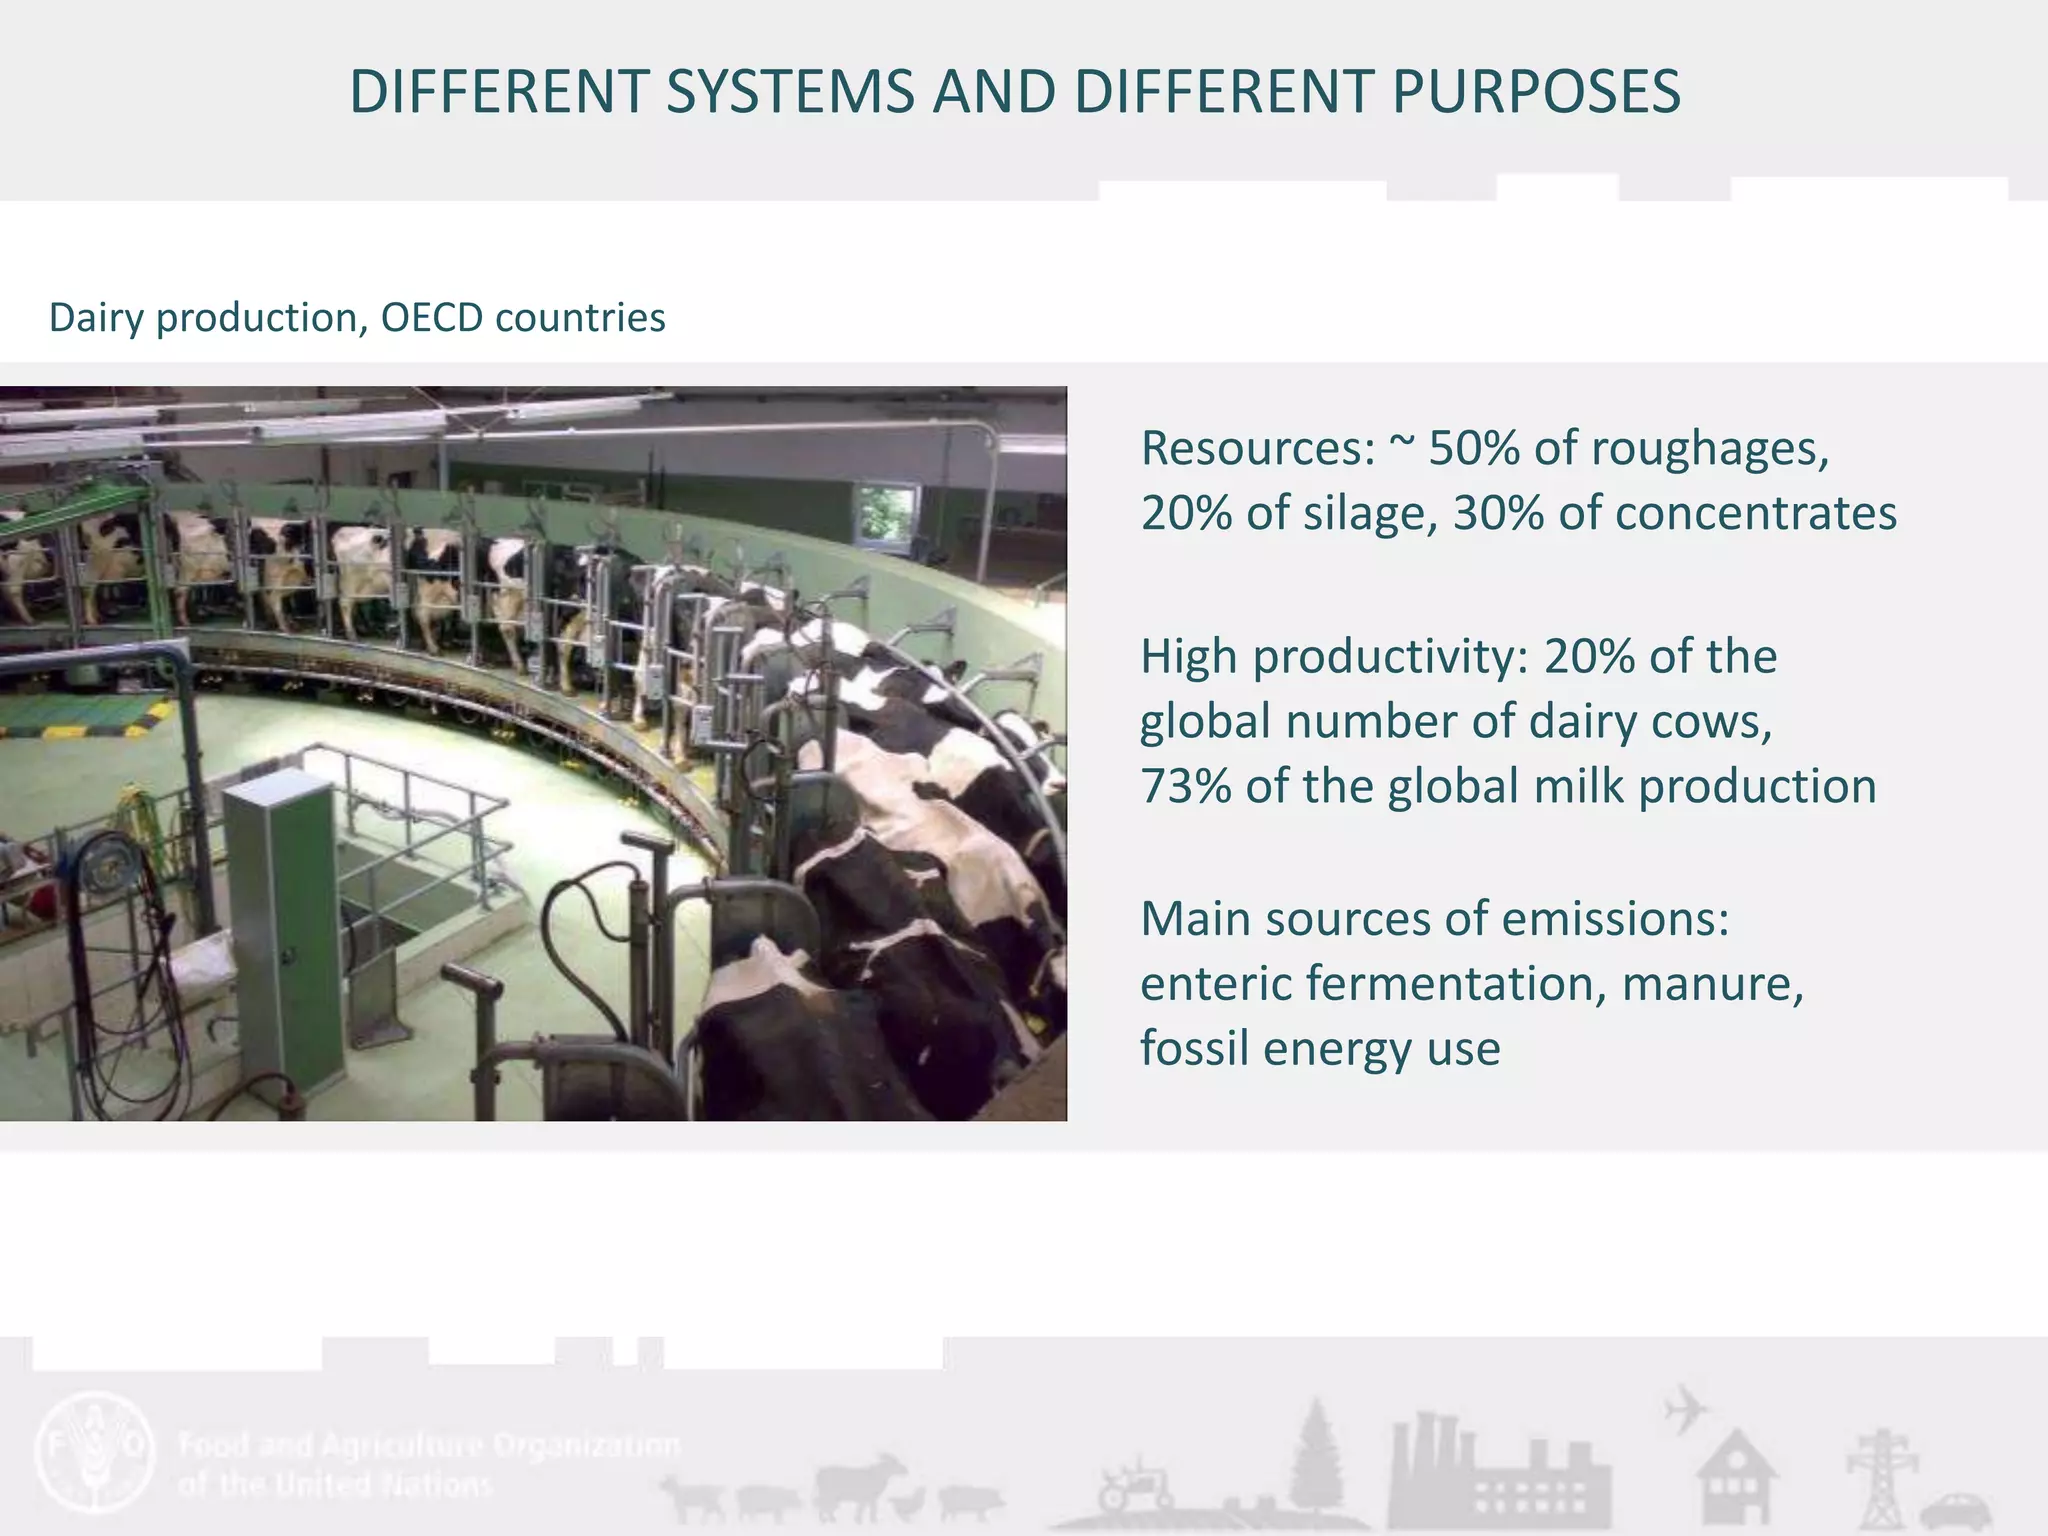
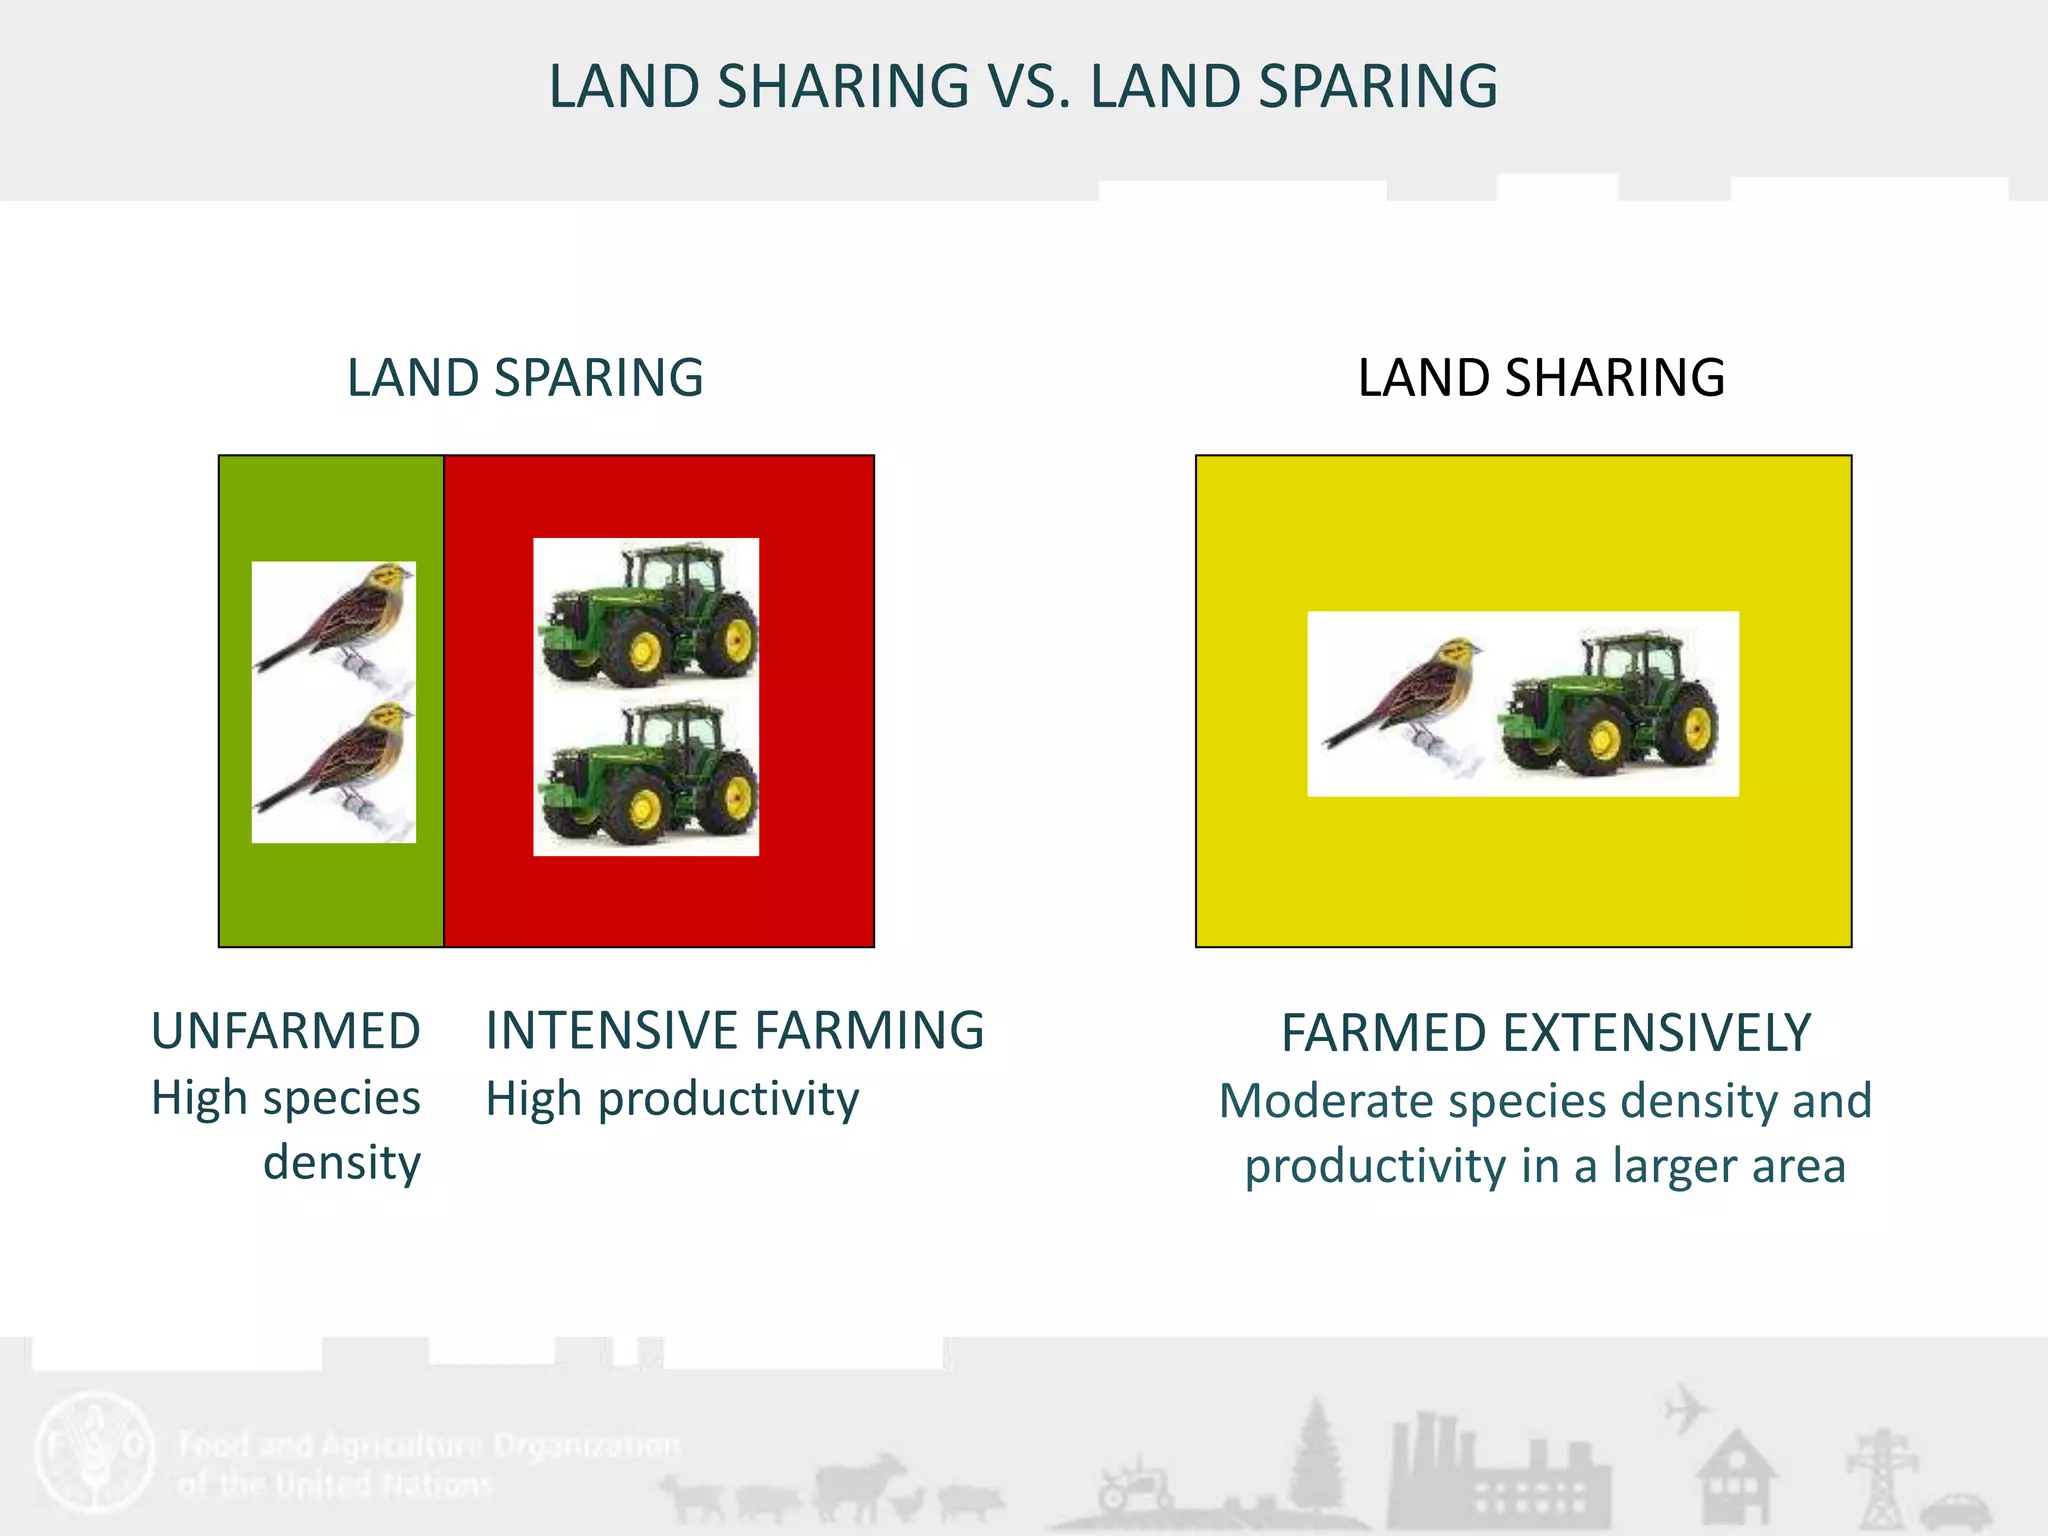
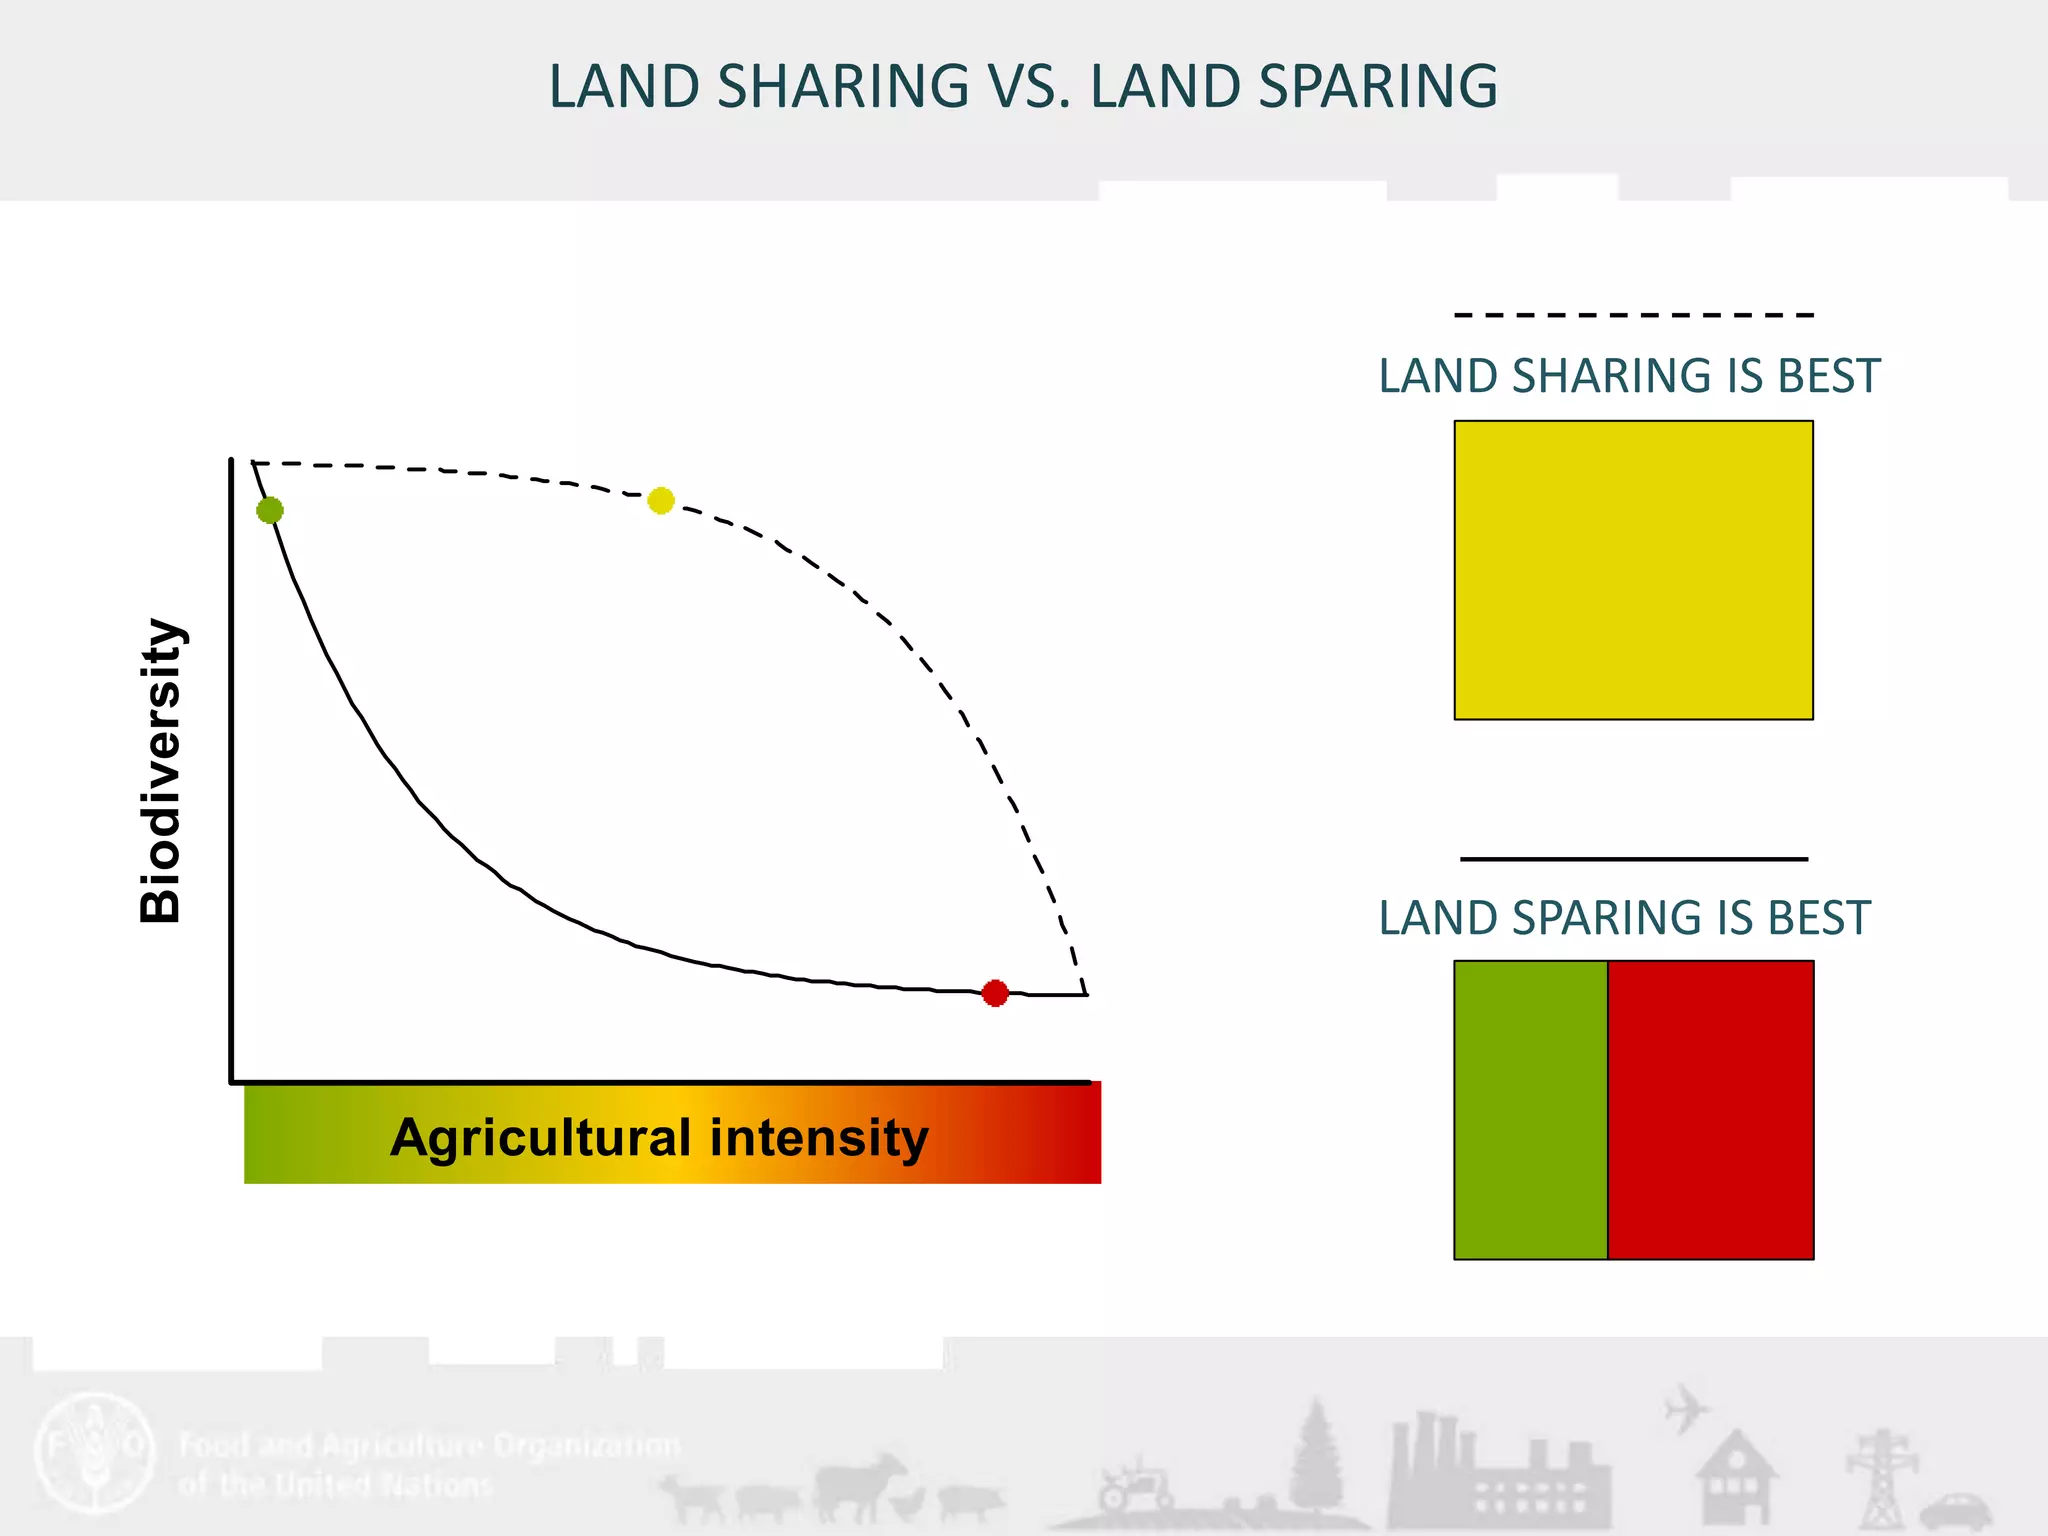

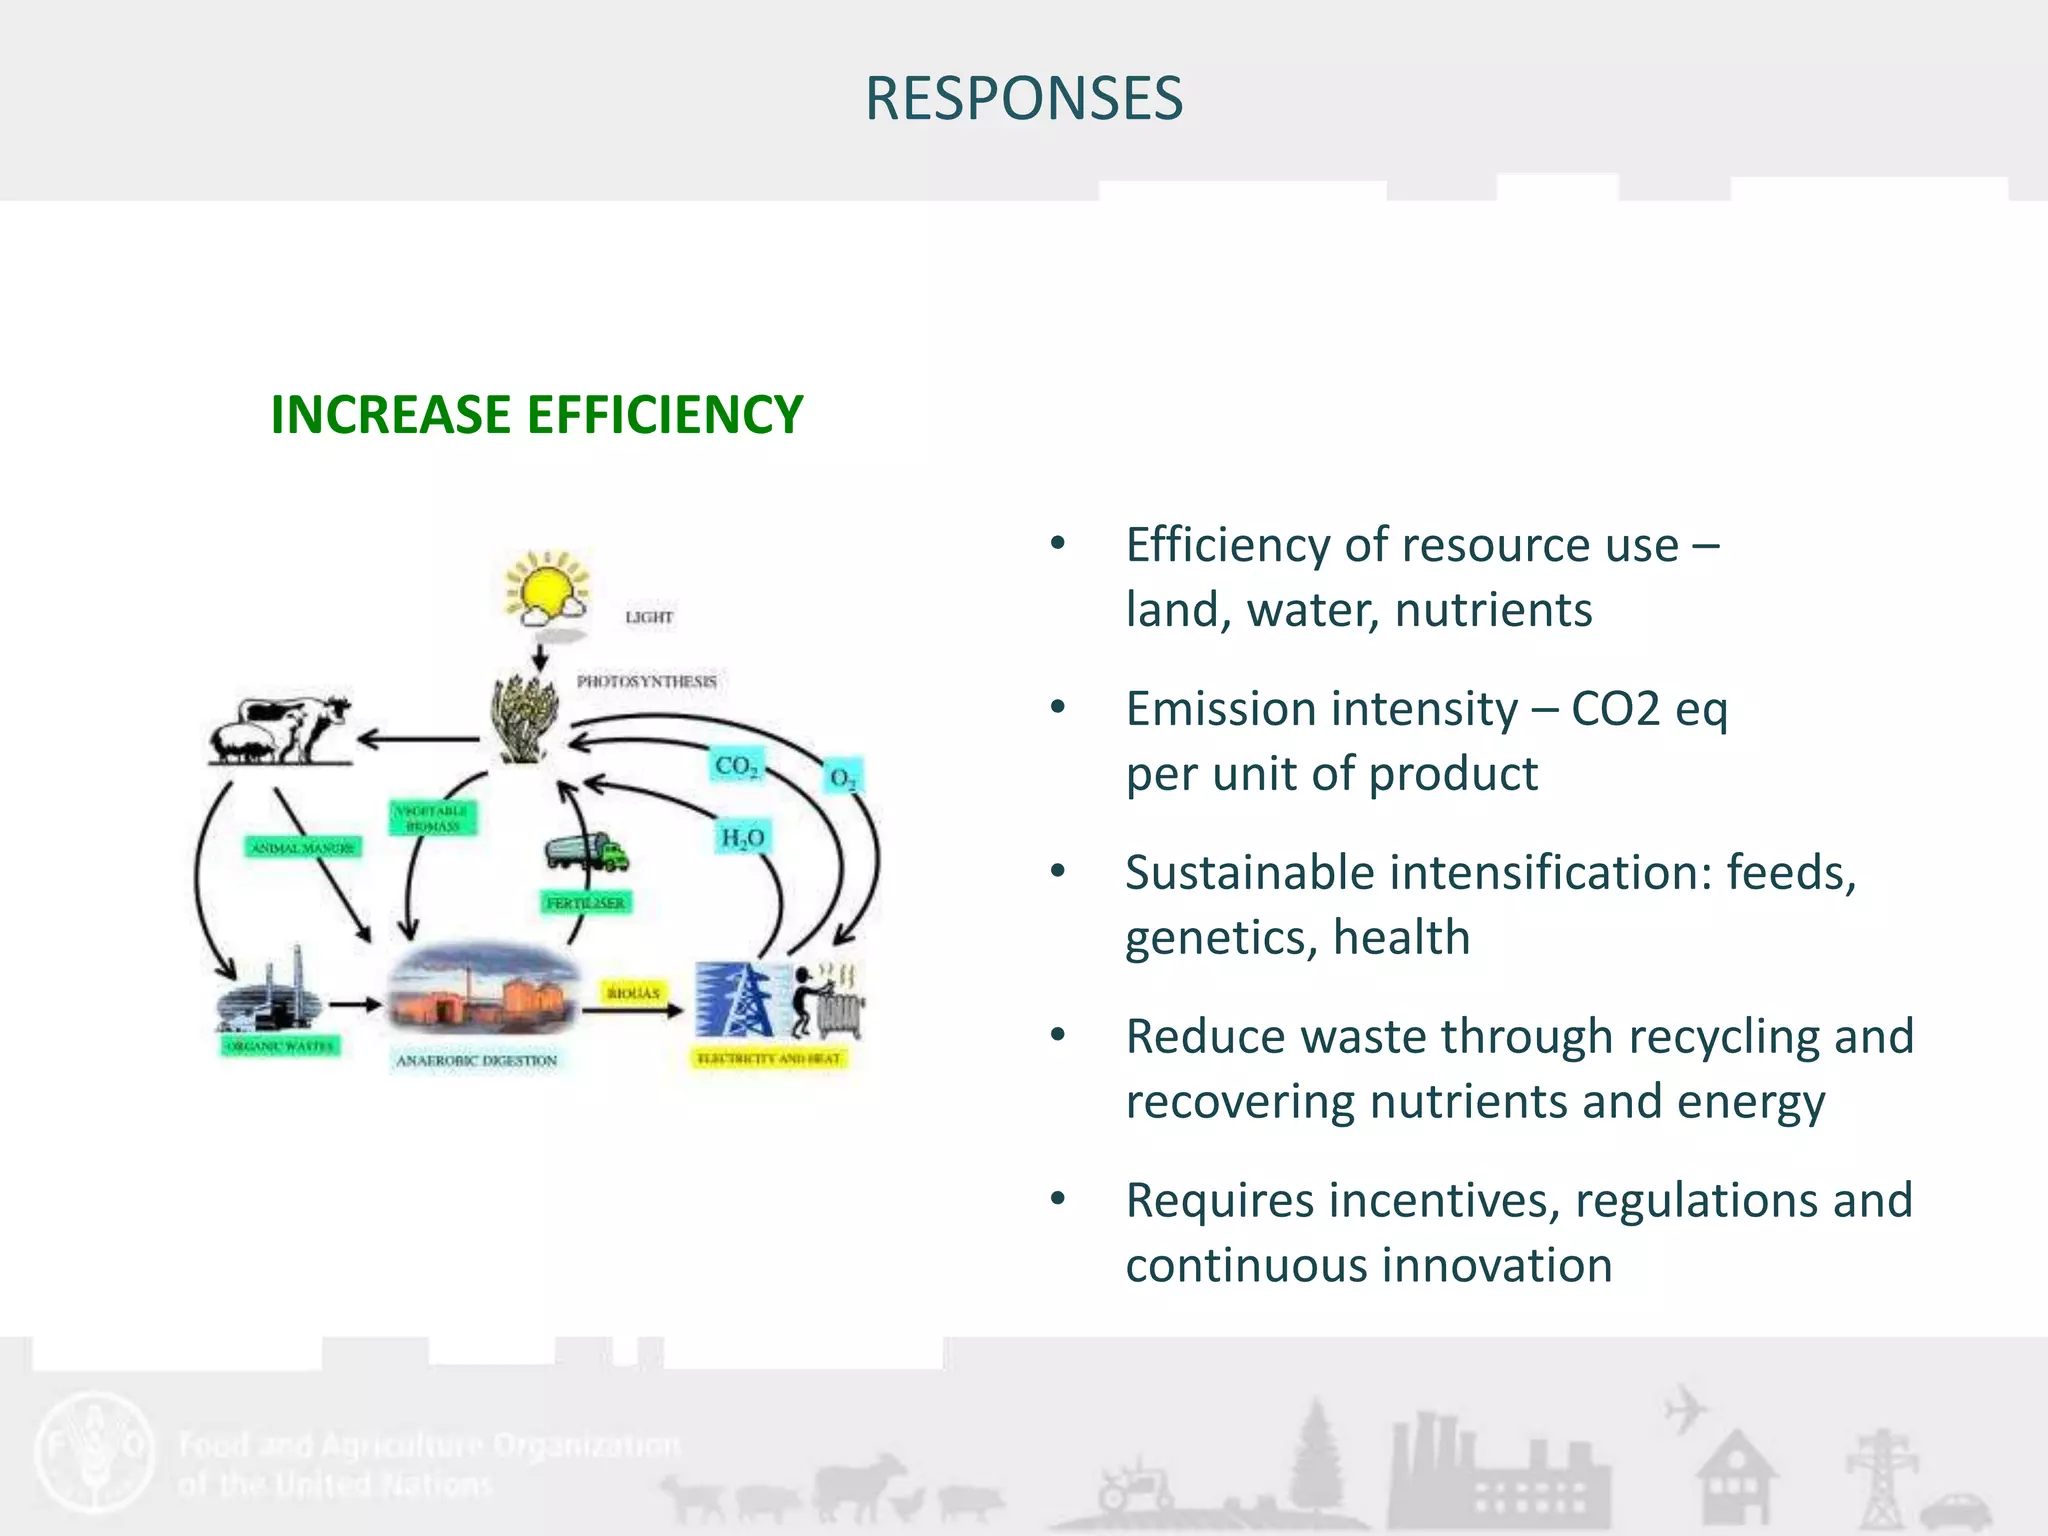

The document discusses the challenges and opportunities related to livestock production in the context of increasing global demand, climate change, and resource scarcity. It highlights the significant environmental impacts of livestock, including greenhouse gas emissions and biodiversity concerns, while emphasizing the need for sustainable practices and policies to improve resource efficiency and resilience. It calls for proactive approaches to balance livestock's role in food security with its environmental responsibilities.


