Downloaded 1,485 times
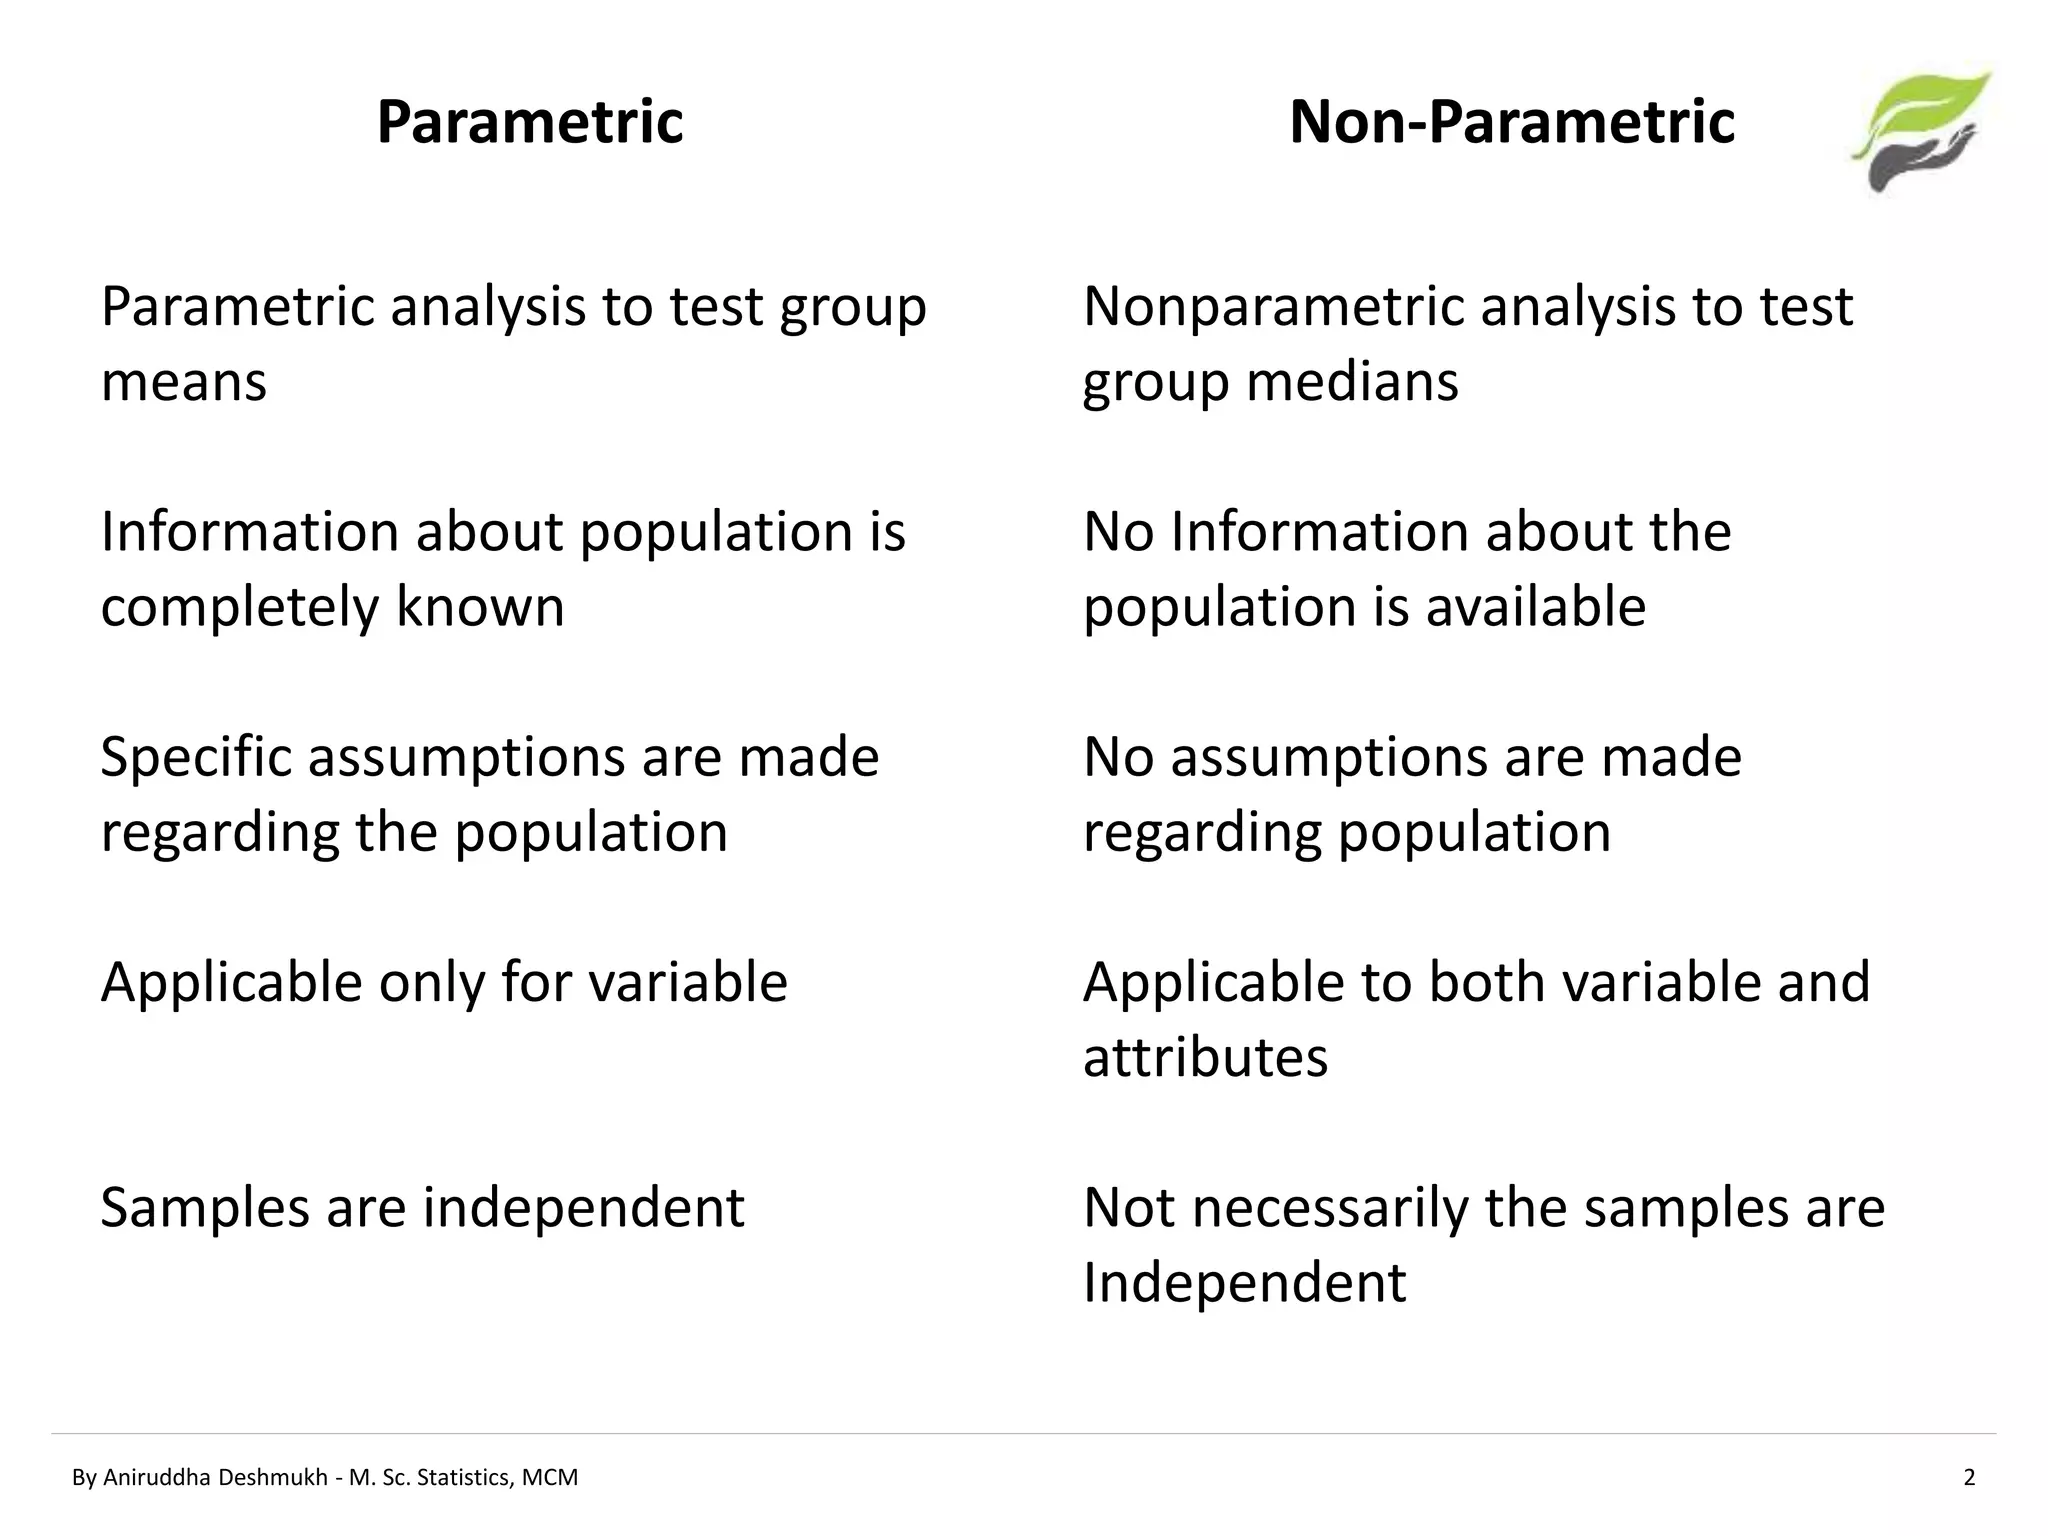
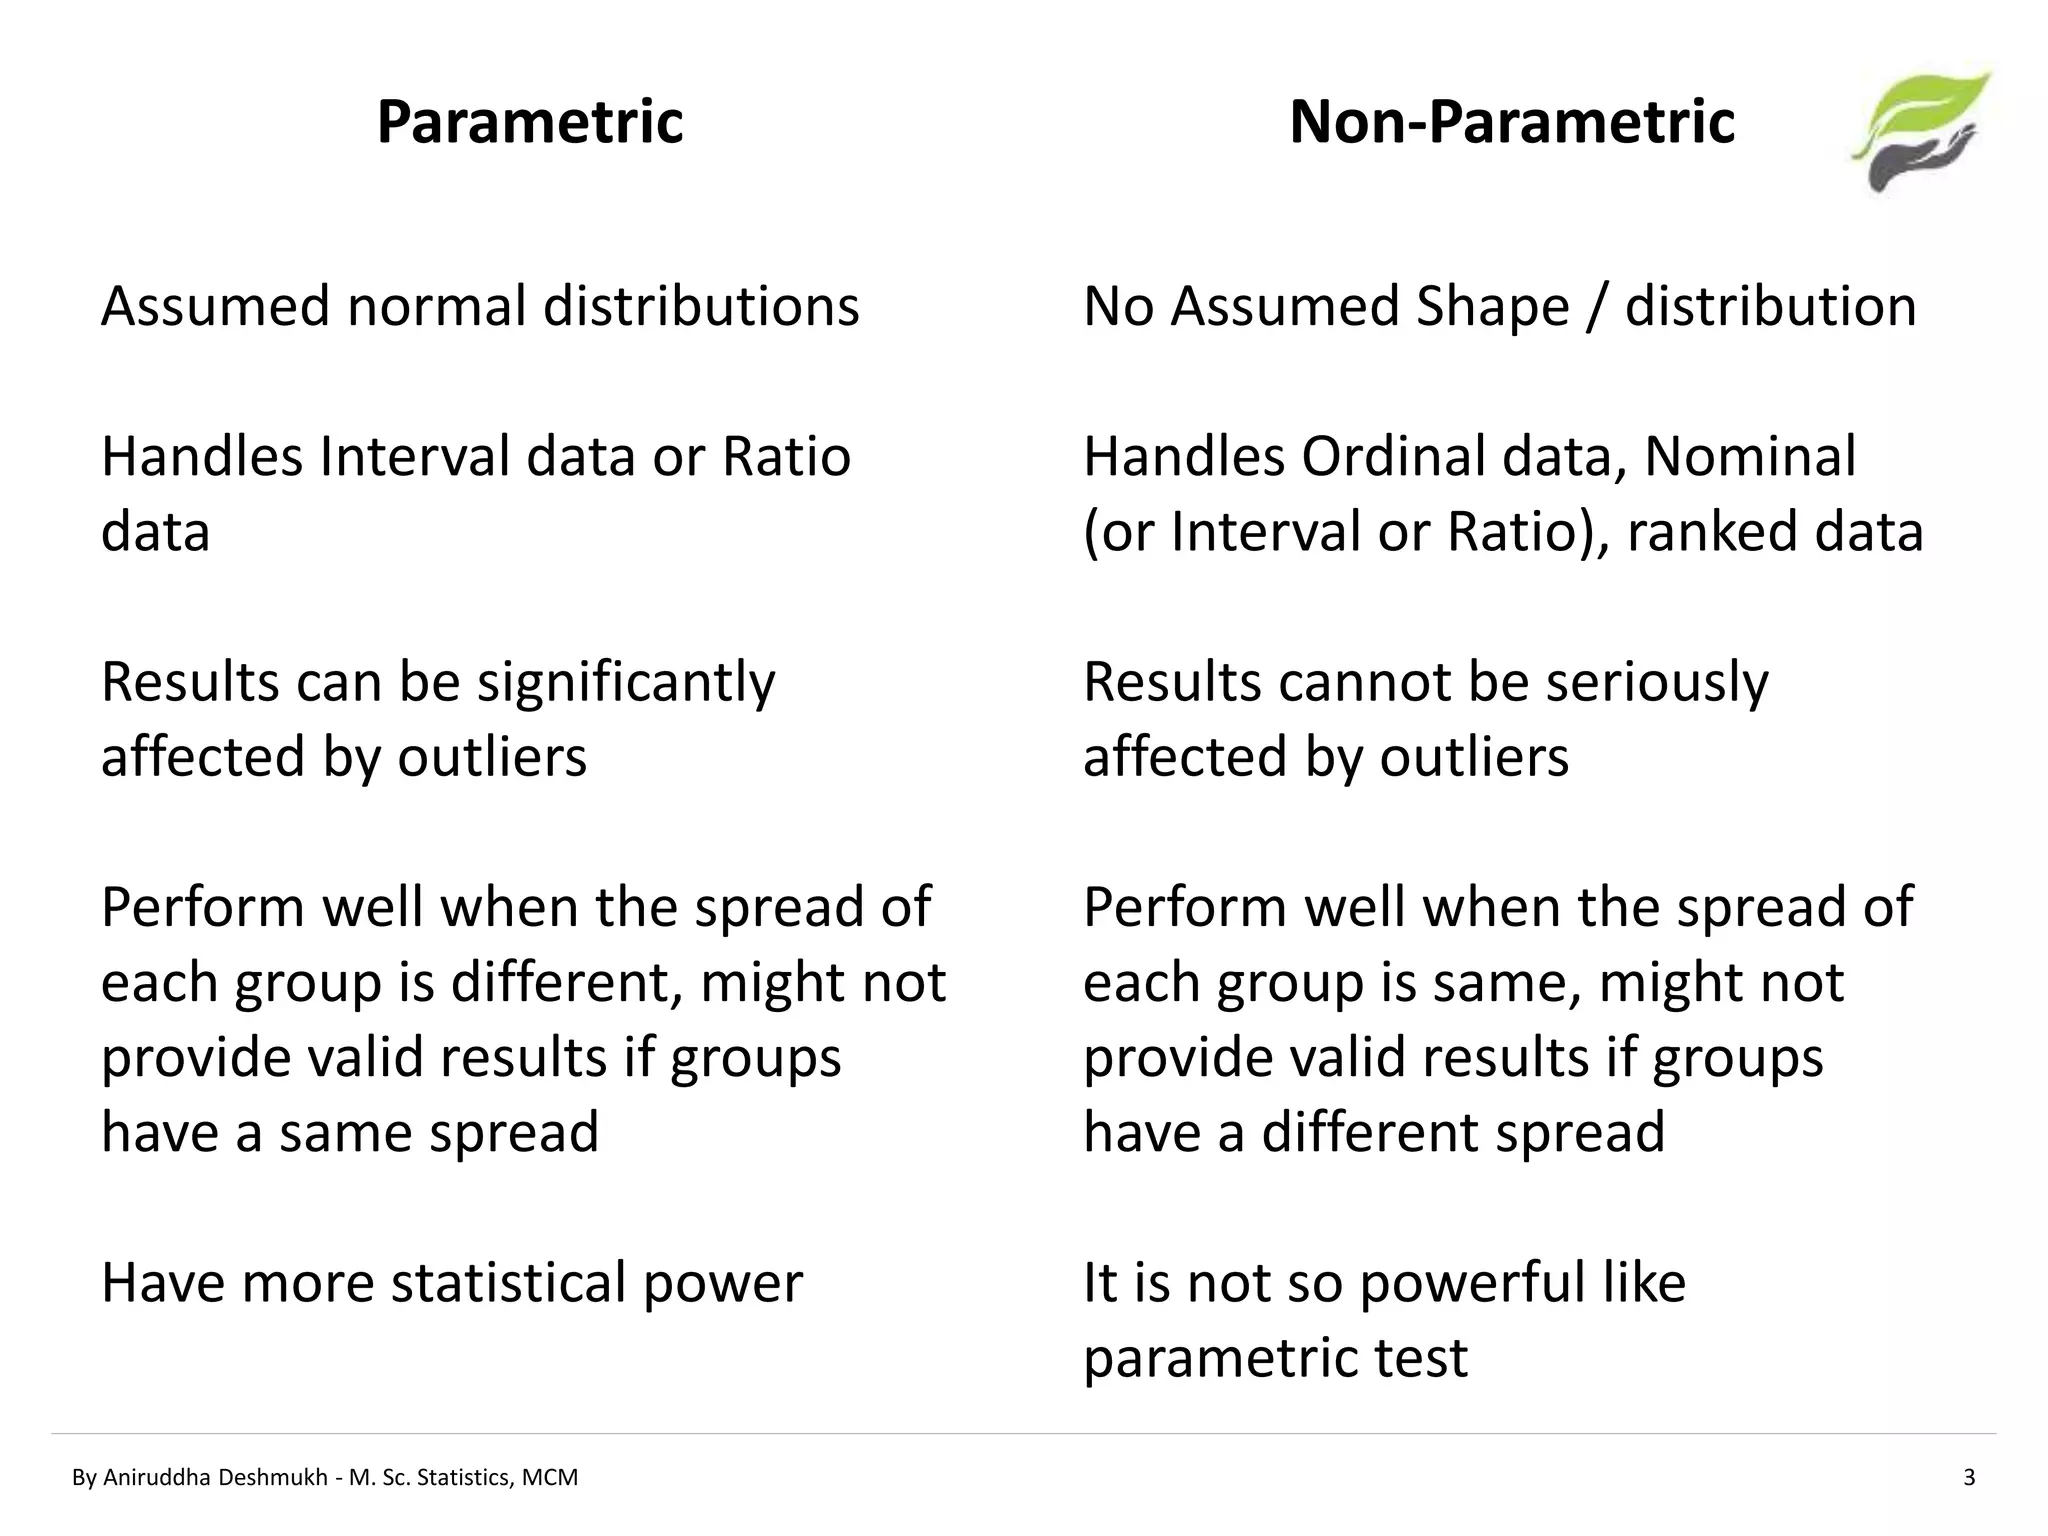

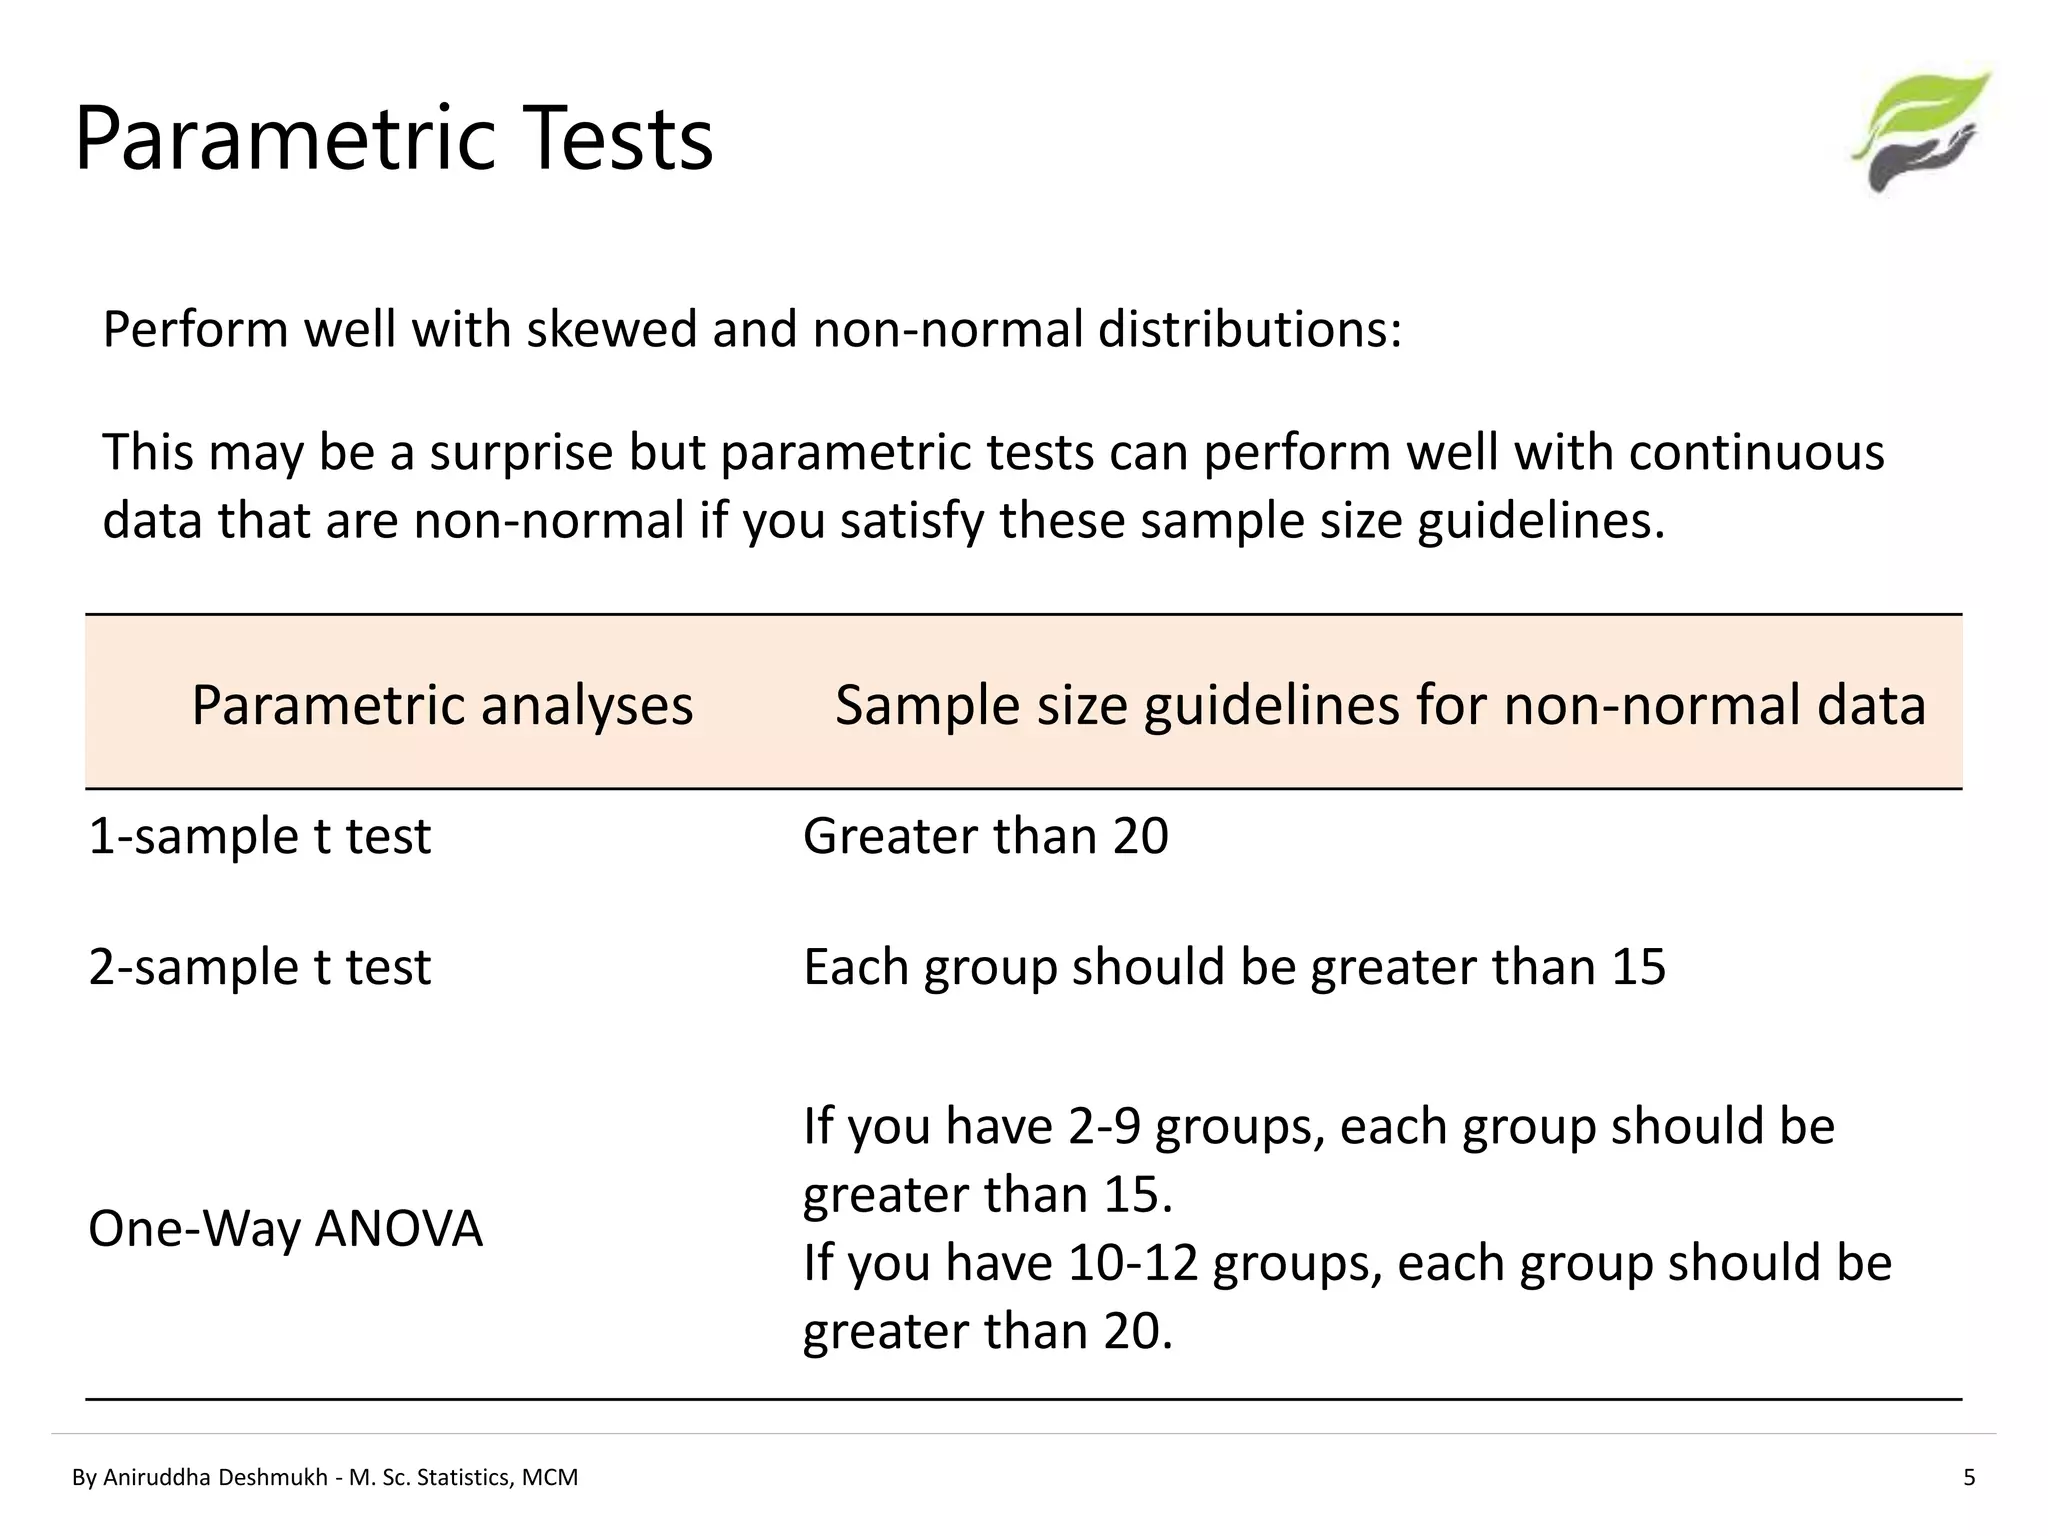
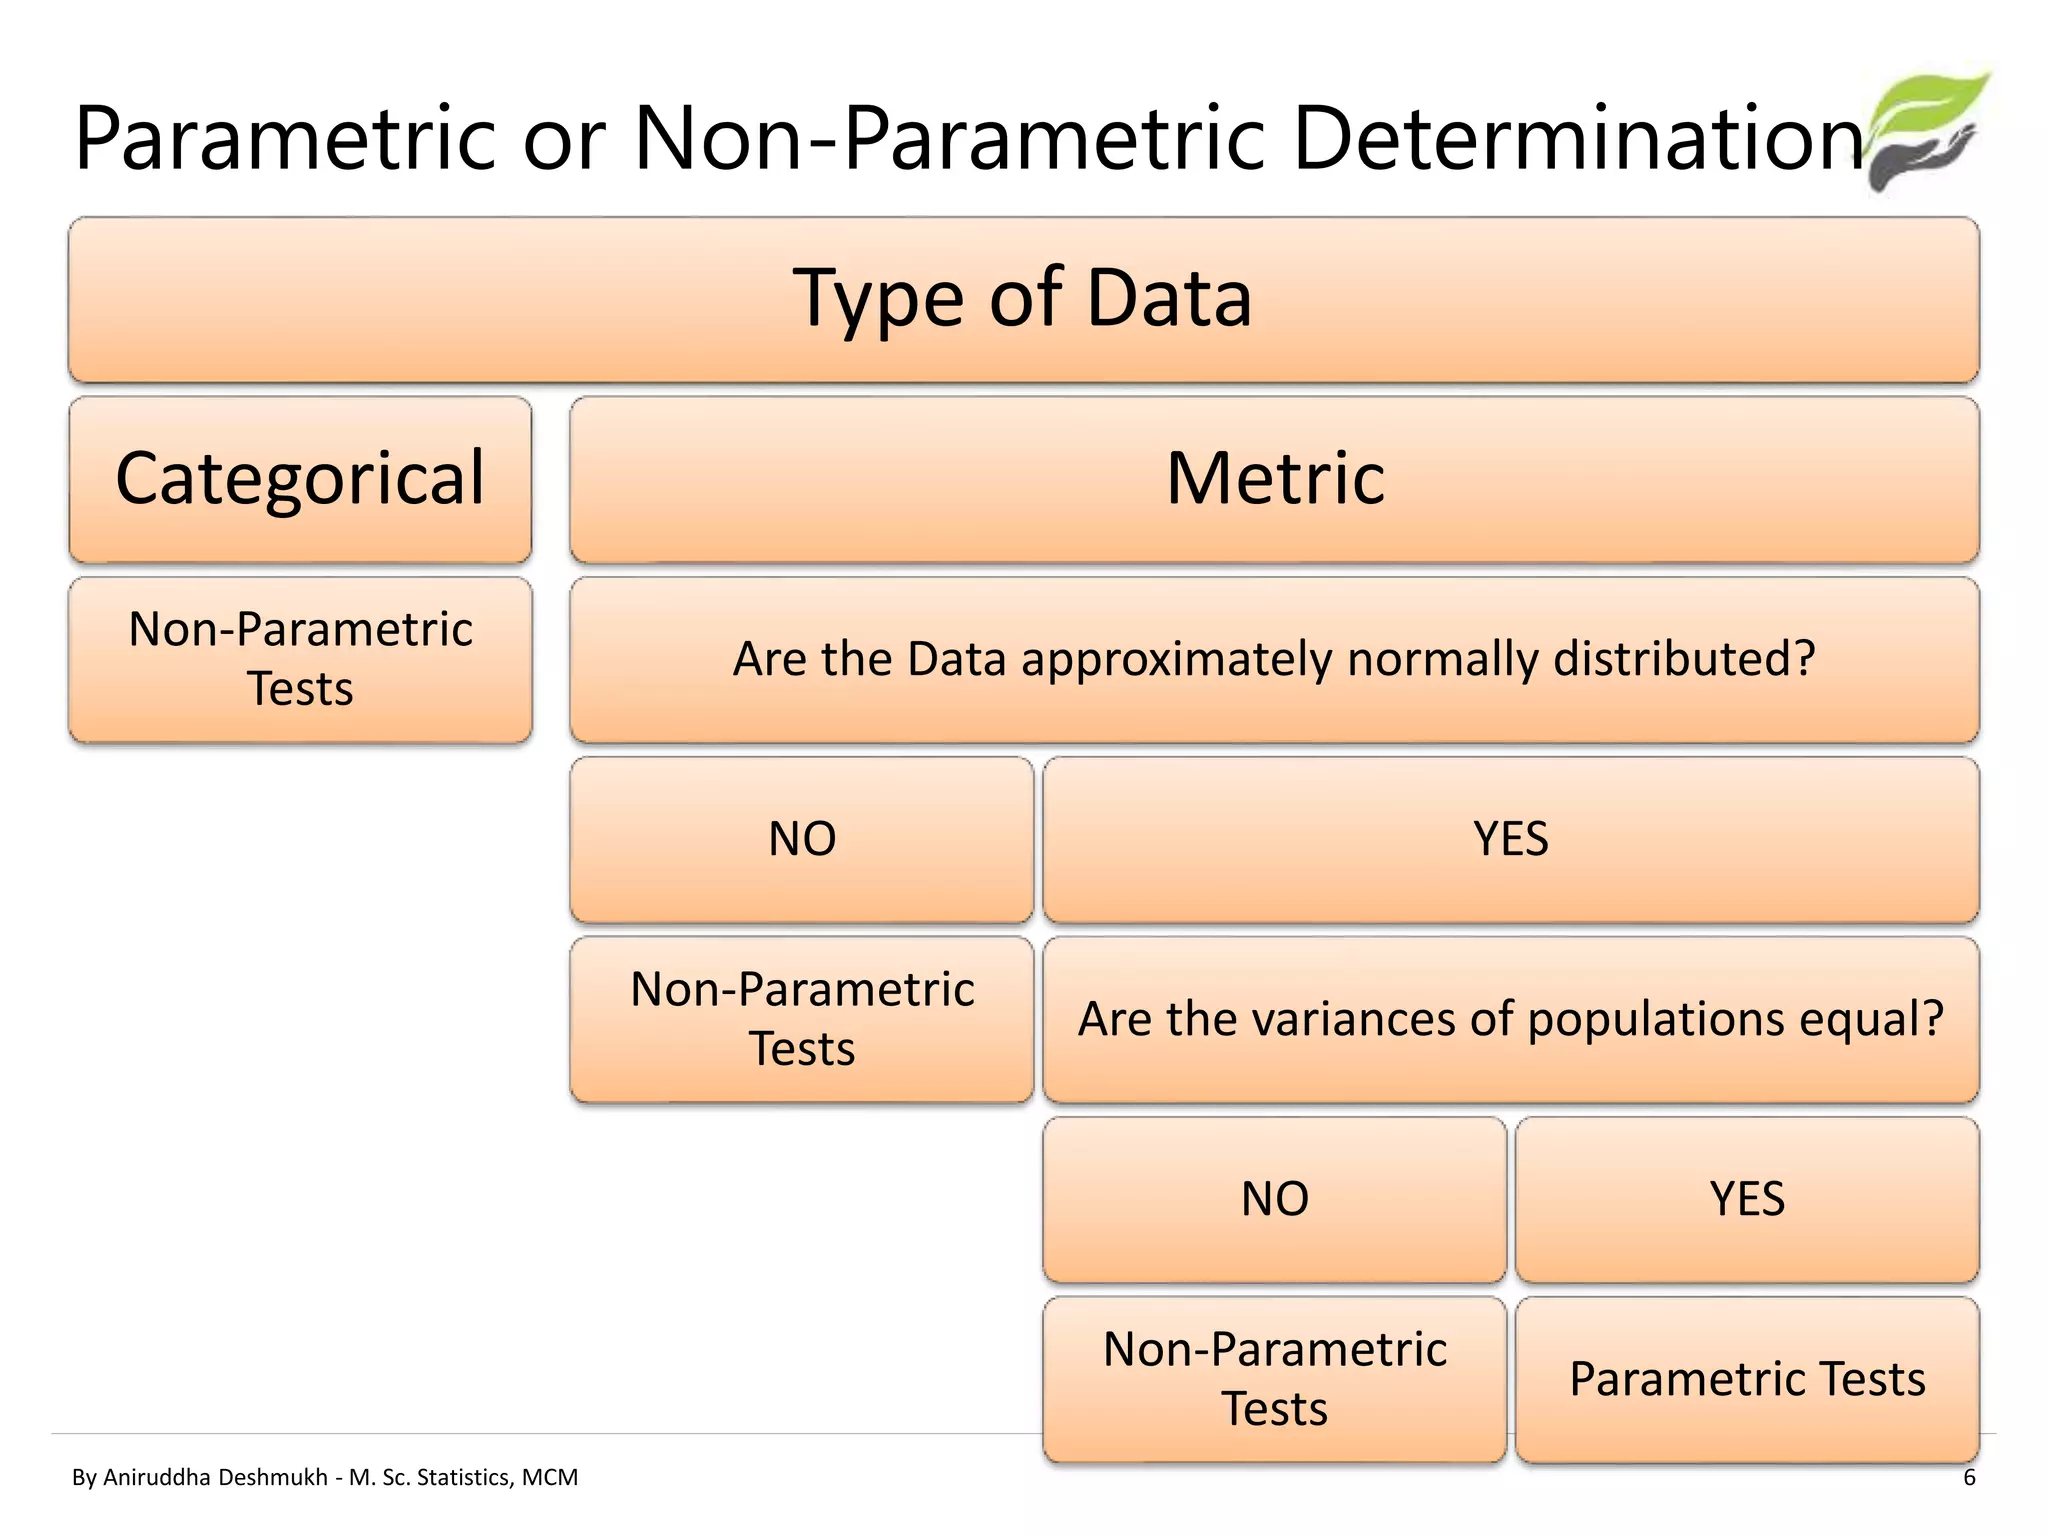
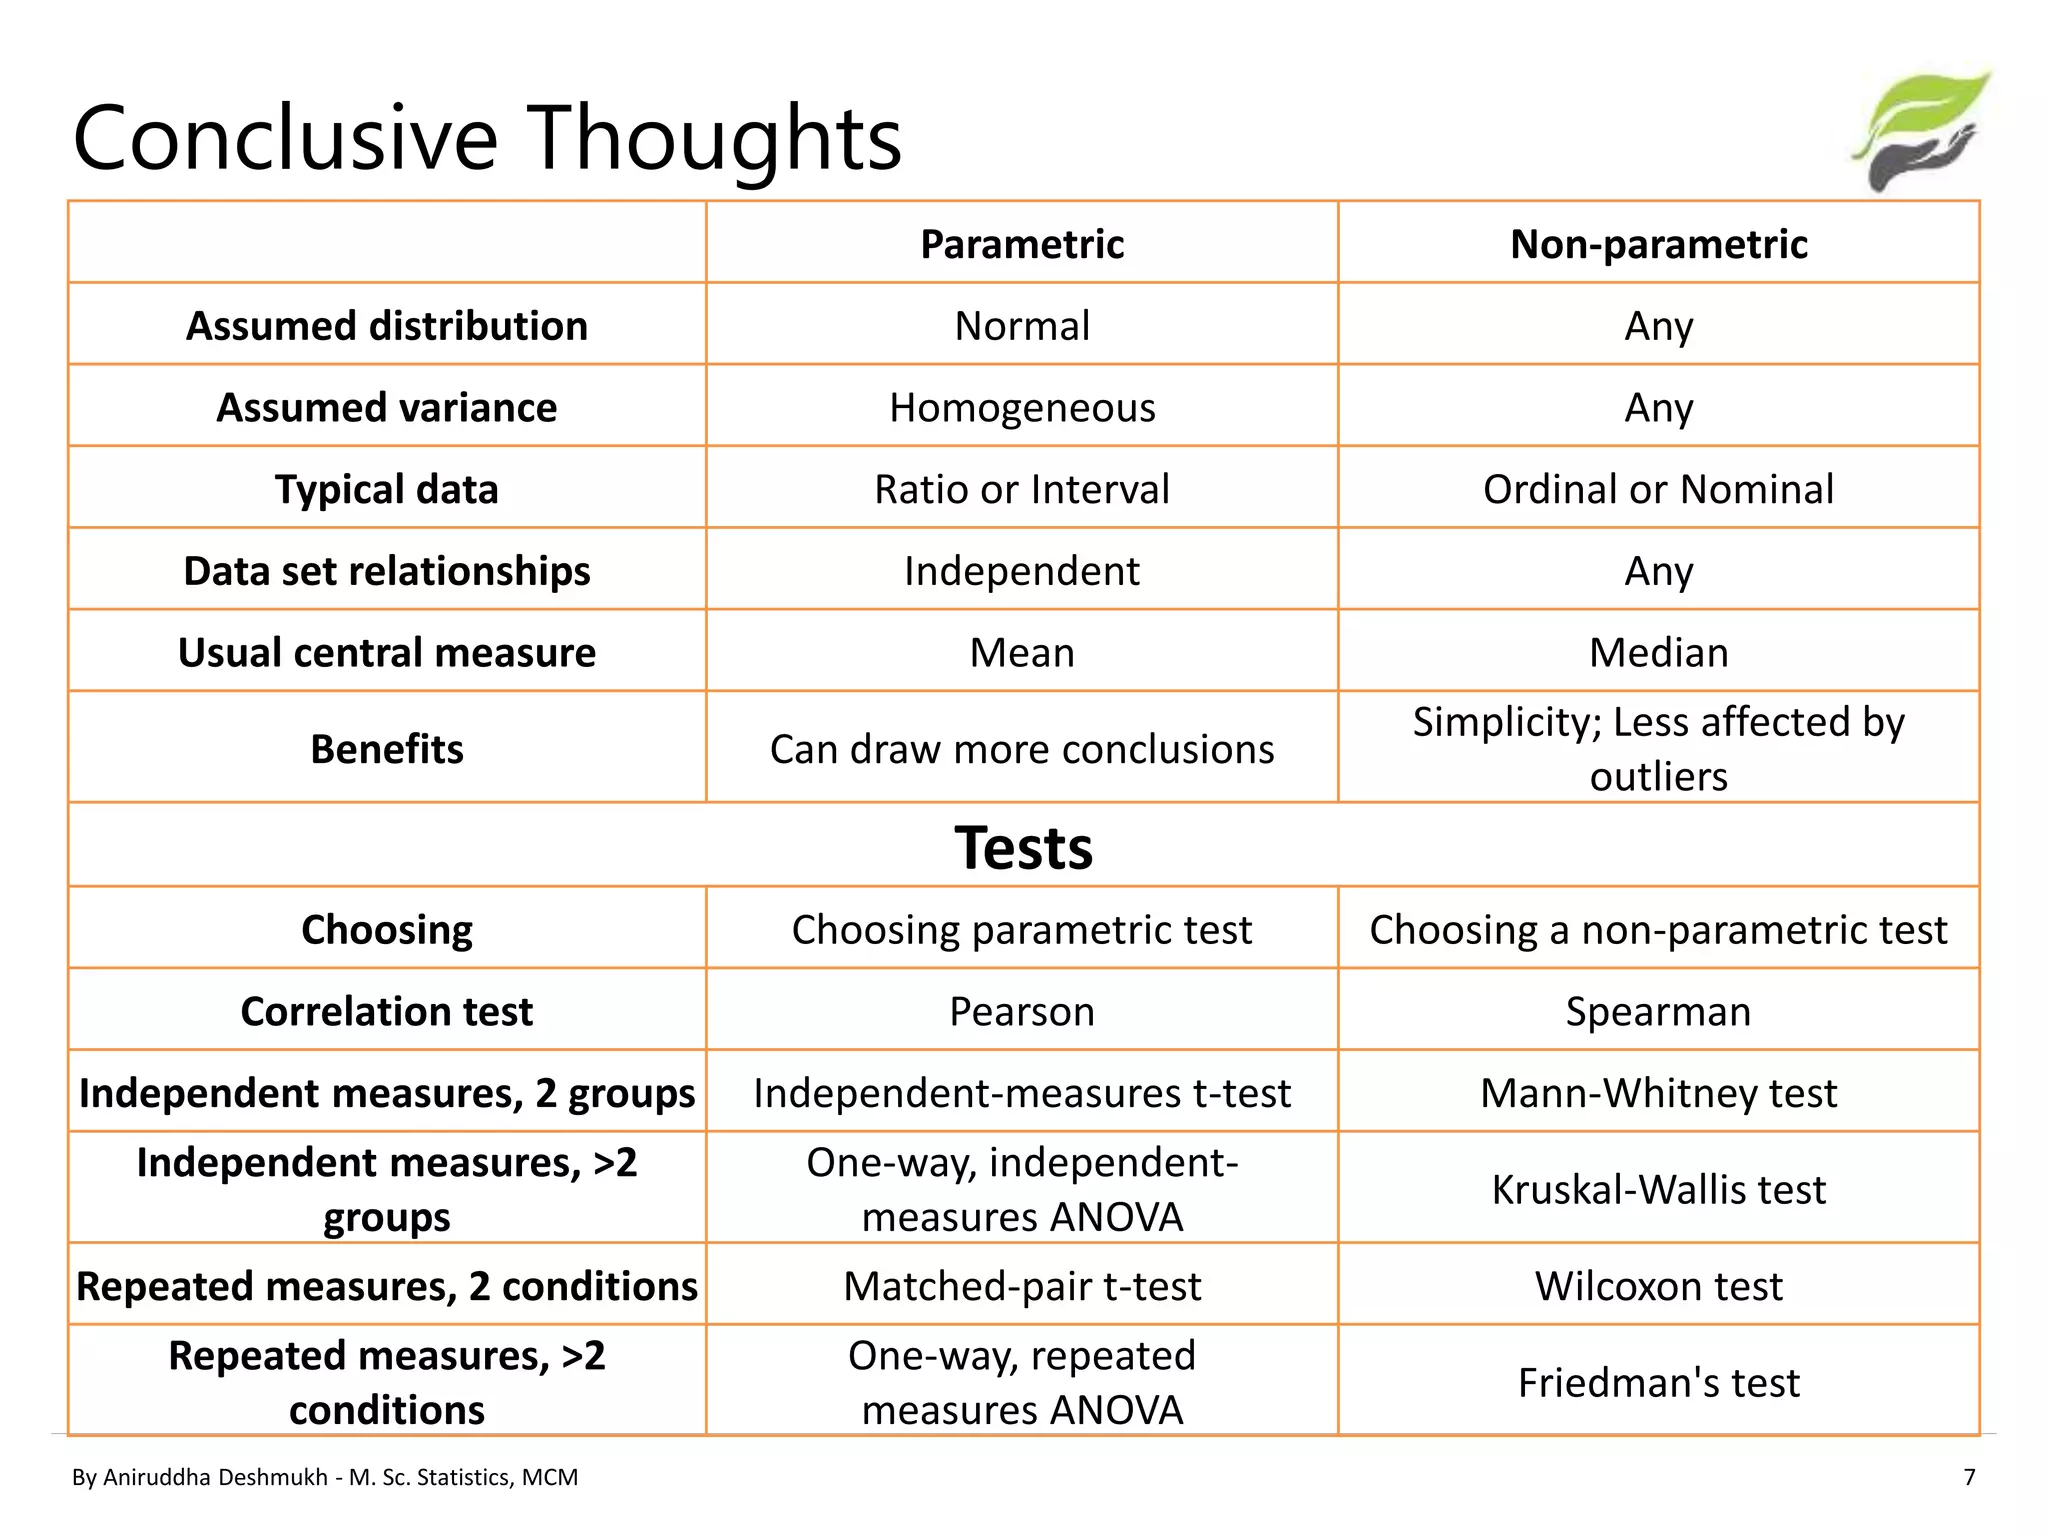


This document compares parametric and non-parametric statistical analyses. Parametric analyses make assumptions about the population distribution and variance, are applicable to interval/ratio data, and can be affected by outliers. Non-parametric analyses make no assumptions, can be used with ordinal/nominal data, and are not affected by outliers. The document provides examples of common parametric tests (t-tests, ANOVA) and non-parametric alternatives (Mann-Whitney, Kruskal-Wallis), and guidelines for determining whether a parametric or non-parametric approach is more appropriate.


