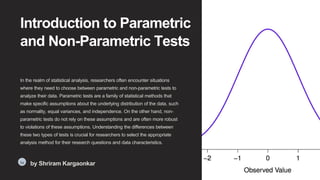
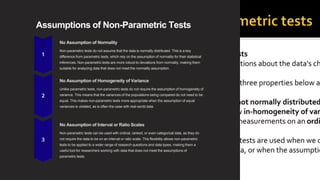
SlideShare a Scribd company logo
1 of 10
Introduction to Parametric
and Non-Parametric Tests
In the realm of statistical analysis, researchers often encounter situations
where they need to choose between parametric and non-parametric tests to
analyze their data. Parametric tests are a family of statistical methods that
make specific assumptions about the underlying distribution of the data, such
as normality, equal variances, and independence. On the other hand, non-
parametric tests do not rely on these assumptions and are often more robust
to violations of these assumptions. Understanding the differences between
these two types of tests is crucial for researchers to select the appropriate
analysis method for their research questions and data characteristics.
Sa
by Shriram Kargaonkar
Definition of Parametric Tests
Defined by
Underlying
Assumptions
Parametric tests are a class
of statistical tests that make
specific assumptions about
the underlying distribution of
the data. These
assumptions typically
include that the data follows
a normal distribution, has
equal variances across
groups, and has
independence between
observations. Parametric
tests are designed to be
more powerful and precise
when these assumptions
are met, as they can
leverage information about
the shape and parameters
of the underlying
distribution.
Rely on Population
Parameters
Parametric tests use
information about the
population parameters,
such as the mean and
standard deviation, to make
inferences about the data.
This allows them to provide
more detailed and robust
conclusions compared to
non-parametric tests, which
make fewer assumptions
about the underlying
distribution. Parametric
tests are often the preferred
choice when the necessary
assumptions can be
confidently met.
Widely Used in
Research
Parametric tests are widely
used across various fields
of research, including
psychology, biology, and
economics. They are a
fundamental part of the
statistical toolbox and are
often the starting point for
data analysis. Researchers
rely on parametric tests to
draw conclusions about
populations, test
hypotheses, and quantify
the strength of relationships
between variables.
Assumptions of Parametric Tests
Parametric tests are a class of statistical tests that make certain assumptions about the underlying
distribution of the data being analyzed. These assumptions are crucial for the validity and reliability of the test
results. The key assumptions of parametric tests include:
1. Normality: Parametric tests assume that the data is normally distributed, meaning that the distribution
of the variable follows a bell-shaped curve. This assumption is important because many statistical
methods, such as t-tests and ANOVA, rely on the normal distribution for their validity.
2. Homogeneity of Variance: Parametric tests also assume that the variance (or spread) of the data is
the same across the different groups or conditions being compared. This assumption is known as
homogeneity of variance or homoscedasticity.
3. Independence: Parametric tests require that the observations in the data set are independent of one
another. This means that the value of one observation should not depend on the value of another
observation.
4. Interval or Ratio Scale: Parametric tests assume that the data is measured on an interval or ratio
scale, meaning that the differences between the values are meaningful and can be interpreted
numerically.
If these assumptions are not met, the validity of the parametric test results may be compromised, and the
conclusions drawn from the analysis may be inaccurate or misleading. In such cases, it may be necessary to
use non-parametric tests, which have different assumptions and are more robust to violations of the
parametric test assumptions.
Understanding Non-
Parametric Tests
Non-parametric tests are a class of statistical methods that do not rely on
specific assumptions about the shape of the data distribution, such as the
normal distribution. These tests are used when the data does not meet the
requirements of parametric tests, such as when the data is not normally
distributed or when the variances are not equal.
Non-parametric tests are based on ranking or ordering the data rather than
using the actual data values directly. This approach makes them more robust
and less affected by outliers or violations of assumptions. Non-parametric
tests are often preferred when the sample size is small, the data is ordinal or
ranked, or when the distribution of the data is unknown or cannot be
assumed to be normal.
Assumptions of Non-Parametric Tests
No Assumption of Normality
Non-parametric tests do not assume that the data is normally distributed. This is a key
difference from parametric tests, which rely on the assumption of normality for their statistical
inferences. Non-parametric tests are more robust to deviations from normality, making them
suitable for analyzing data that does not meet the normality assumption.
No Assumption of Homogeneity of Variance
Unlike parametric tests, non-parametric tests do not require the assumption of homogeneity of
variance. This means that the variances of the populations being compared do not need to be
equal. This makes non-parametric tests more appropriate when the assumption of equal
variances is violated, as is often the case with real-world data.
No Assumption of Interval or Ratio Scales
Non-parametric tests can be used with ordinal, ranked, or even categorical data, as they do
not require the data to be on an interval or ratio scale. This flexibility allows non-parametric
tests to be applied to a wider range of research questions and data types, making them a
useful tool for researchers working with data that does not meet the assumptions of
parametric tests.
Advantages of Parametric Tests
Statistical Power
Parametric tests generally have higher
statistical power compared to non-parametric
tests when the data meets the necessary
assumptions. This means they are more likely
to detect an effect or difference if one truly
exists, reducing the risk of a false negative
result.
Precision and Sensitivity
Parametric tests can provide more precise
and sensitive measurements because they
make use of the full information contained in
the data, such as the means and variances.
This allows for more nuanced analyses and
the detection of smaller effects.
Familiarity and Interpretability
Parametric tests are widely used and well-
understood statistical methods, with a rich
body of literature and established
conventions. This familiarity makes the results
more interpretable and easier to communicate
to a broader audience.
Parametric Modeling
Parametric tests can be used to fit complex
statistical models that allow for the exploration
of relationships between multiple variables.
This flexibility is valuable in many research
and applied settings where understanding
these relationships is important.
Advantages of Non-Parametric Tests
Flexibility
Non-parametric tests
are more flexible than
parametric tests
because they do not
rely on strict
assumptions about the
underlying distribution
of the data. This
makes them well-
suited for analyzing
data that may not
follow a normal
distribution or have
equal variances, which
are common
assumptions of
parametric tests.
Robustness
Non-parametric tests
are more robust to
outliers and extreme
values in the data.
Parametric tests can
be heavily influenced
by outliers, which can
skew the results. Non-
parametric tests, on
the other hand, are
less sensitive to these
extreme values,
making them more
reliable for datasets
with unusual
distributions.
Ordinal Data
Non-parametric tests
are particularly useful
for analyzing ordinal
data, which are data
that can be ranked but
do not have a
meaningful numerical
scale. Parametric
tests, which rely on
numerical values, are
not well-suited for this
type of data, whereas
non-parametric tests
can effectively analyze
ordinal data.
Small Sample
Sizes
Non-parametric tests
can be more effective
than parametric tests
when the sample size
is small. Parametric
tests often require
larger sample sizes to
ensure the
assumptions are met,
whereas non-
parametric tests can
provide reliable results
even with smaller
datasets.
Situations Requiring Non-Parametric
Tests
1
Small Samples
When the sample size is small and the distribution of the data is unknown.
2
Non-Normal Distributions
When the data does not follow a normal distribution.
3
Ordinal Data
For data measured on an ordinal scale, such as ratings or
rankings.
4
Heterogeneous Variances
When the variances of the populations are not
equal.
Non-parametric tests are often required when the assumptions of parametric tests are violated. This can
occur in a variety of situations, such as when the sample size is small, the data does not follow a normal
distribution, the data is measured on an ordinal scale, or the variances of the populations are not equal. In
these cases, non-parametric tests can provide more robust and reliable results than their parametric
counterparts.
For example, if you're comparing the median income of two different neighborhoods, a non-parametric test
like the Mann-Whitney U test would be appropriate, as the income data may not follow a normal distribution.
Examples of Parametric and Non-
Parametric Tests
Parametric tests are widely used statistical
methods that make assumptions about the
underlying distribution of the data, such as
normality and equal variances. Some common
examples of parametric tests include:
1. t-test: Used to compare the means of
two groups, such as comparing the
average test scores of a control group
and an experimental group.
2. ANOVA (Analysis of Variance): Used to
compare the means of three or more
groups, such as comparing the
performance of different treatment
groups in a clinical trial.
3. Pearson's correlation: Used to measure
the linear relationship between two
continuous variables, such as the
relationship between income and
education level.
On the other hand, non-parametric tests are more
flexible and do not make assumptions about the
underlying data distribution. Some examples of
non-parametric tests include:
1. Mann-Whitney U test: Used to compare
Conclusion and Takeaways
In conclusion, the key differences between parametric and non-parametric tests lie in their underlying
assumptions and the type of data they can effectively analyze. Parametric tests, such as the t-test and
ANOVA, rely on specific assumptions about the distribution of the data, including normality and homogeneity
of variance. These tests are powerful when the assumptions are met, providing robust and precise results. In
contrast, non-parametric tests, like the Mann-Whitney U test and the Kruskal-Wallis test, make fewer
assumptions about the data distribution and are more flexible in their application. They are particularly useful
when the data is ordinal, skewed, or does not follow a normal distribution.
The choice between parametric and non-parametric tests ultimately depends on the characteristics of the
data and the research question at hand. Parametric tests are generally preferred when the assumptions are
met, as they offer greater statistical power and the ability to make more precise inferences. However, when
the assumptions are violated, non-parametric tests become the more appropriate choice, as they can provide
reliable and valid results without the need for strict distributional assumptions. Researchers should carefully
evaluate the assumptions of their data and select the most appropriate statistical test to ensure accurate and
meaningful conclusions.
In summary, understanding the differences between parametric and non-parametric tests, their assumptions,
and their respective strengths and weaknesses is crucial for researchers to select the most suitable analytical
approach for their specific research questions and data characteristics. By considering these factors,
researchers can ensure the validity and reliability of their findings and draw meaningful insights from their
data.

More Related Content

Similar to Introduction-to-Parametric-and-Non-Parametric-Tests.pptx

ANALYSIS ANDINTERPRETATION OF DATA Analysis and Interpr.docx
ANALYSIS ANDINTERPRETATION  OF DATA Analysis and Interpr.docxANALYSIS ANDINTERPRETATION  OF DATA Analysis and Interpr.docx
ANALYSIS ANDINTERPRETATION OF DATA Analysis and Interpr.docxcullenrjzsme
 
Parametric and nonparametric test
Parametric and nonparametric testParametric and nonparametric test
Parametric and nonparametric testponnienselvi
 
Analyzing quantitative data
Analyzing quantitative dataAnalyzing quantitative data
Analyzing quantitative datamostafasharafiye
 
statistical analysis.pptx
statistical analysis.pptxstatistical analysis.pptx
statistical analysis.pptxhayatalakoum1
 
Data analysis powerpoint
Data analysis powerpointData analysis powerpoint
Data analysis powerpointjamiebrandon
 
Statistics  What you Need to KnowIntroductionOften, when peop.docx
Statistics  What you Need to KnowIntroductionOften, when peop.docxStatistics  What you Need to KnowIntroductionOften, when peop.docx
Statistics  What you Need to KnowIntroductionOften, when peop.docxdessiechisomjj4
 
When to use, What Statistical Test for data Analysis modified.pptx
When to use, What Statistical Test for data Analysis modified.pptxWhen to use, What Statistical Test for data Analysis modified.pptx
When to use, What Statistical Test for data Analysis modified.pptxAsokan R
 
ANALYZING DATA BY BY SELLIGER AND SHAOAMY (1989)
ANALYZING DATA BY BY SELLIGER AND SHAOAMY (1989)ANALYZING DATA BY BY SELLIGER AND SHAOAMY (1989)
ANALYZING DATA BY BY SELLIGER AND SHAOAMY (1989)Lenis Beatriz Marquez Vidal
 
Alternatives to t test
Alternatives to t testAlternatives to t test
Alternatives to t testLONDIWE SHANGE
 
Bio-Statistics in Bio-Medical research
Bio-Statistics in Bio-Medical researchBio-Statistics in Bio-Medical research
Bio-Statistics in Bio-Medical researchShinjan Patra
 
Need a nonplagiarised paper and a form completed by 1006015 before.docx
Need a nonplagiarised paper and a form completed by 1006015 before.docxNeed a nonplagiarised paper and a form completed by 1006015 before.docx
Need a nonplagiarised paper and a form completed by 1006015 before.docxlea6nklmattu
 
·Quantitative Data Analysis StatisticsIntroductionUnd.docx
·Quantitative Data Analysis StatisticsIntroductionUnd.docx·Quantitative Data Analysis StatisticsIntroductionUnd.docx
·Quantitative Data Analysis StatisticsIntroductionUnd.docxlanagore871
 
Biostatistics clinical research & trials
Biostatistics clinical research & trialsBiostatistics clinical research & trials
Biostatistics clinical research & trialseclinicaltools
 
PUB- Advanced Statistical Methods in Meta-analysis Enhancing Accuracy, Reliab...
PUB- Advanced Statistical Methods in Meta-analysis Enhancing Accuracy, Reliab...PUB- Advanced Statistical Methods in Meta-analysis Enhancing Accuracy, Reliab...
PUB- Advanced Statistical Methods in Meta-analysis Enhancing Accuracy, Reliab...pubrica101
 

Similar to Introduction-to-Parametric-and-Non-Parametric-Tests.pptx (20)

ANALYSIS ANDINTERPRETATION OF DATA Analysis and Interpr.docx
ANALYSIS ANDINTERPRETATION  OF DATA Analysis and Interpr.docxANALYSIS ANDINTERPRETATION  OF DATA Analysis and Interpr.docx
ANALYSIS ANDINTERPRETATION OF DATA Analysis and Interpr.docx
 
Parametric and nonparametric test
Parametric and nonparametric testParametric and nonparametric test
Parametric and nonparametric test
 
O1
O1O1
O1
 
Analyzing quantitative data
Analyzing quantitative dataAnalyzing quantitative data
Analyzing quantitative data
 
Non parametric test
Non parametric testNon parametric test
Non parametric test
 
statistical analysis.pptx
statistical analysis.pptxstatistical analysis.pptx
statistical analysis.pptx
 
t-test Parametric test Biostatics and Research Methodology
t-test Parametric test Biostatics and Research Methodologyt-test Parametric test Biostatics and Research Methodology
t-test Parametric test Biostatics and Research Methodology
 
Data analysis powerpoint
Data analysis powerpointData analysis powerpoint
Data analysis powerpoint
 
Bgy5901
Bgy5901Bgy5901
Bgy5901
 
Statistics  What you Need to KnowIntroductionOften, when peop.docx
Statistics  What you Need to KnowIntroductionOften, when peop.docxStatistics  What you Need to KnowIntroductionOften, when peop.docx
Statistics  What you Need to KnowIntroductionOften, when peop.docx
 
When to use, What Statistical Test for data Analysis modified.pptx
When to use, What Statistical Test for data Analysis modified.pptxWhen to use, What Statistical Test for data Analysis modified.pptx
When to use, What Statistical Test for data Analysis modified.pptx
 
Chi-Square Test Non Parametric Test Categorical Variable
Chi-Square Test Non Parametric Test Categorical VariableChi-Square Test Non Parametric Test Categorical Variable
Chi-Square Test Non Parametric Test Categorical Variable
 
Non parametric presentation
Non parametric presentationNon parametric presentation
Non parametric presentation
 
ANALYZING DATA BY BY SELLIGER AND SHAOAMY (1989)
ANALYZING DATA BY BY SELLIGER AND SHAOAMY (1989)ANALYZING DATA BY BY SELLIGER AND SHAOAMY (1989)
ANALYZING DATA BY BY SELLIGER AND SHAOAMY (1989)
 
Alternatives to t test
Alternatives to t testAlternatives to t test
Alternatives to t test
 
Bio-Statistics in Bio-Medical research
Bio-Statistics in Bio-Medical researchBio-Statistics in Bio-Medical research
Bio-Statistics in Bio-Medical research
 
Need a nonplagiarised paper and a form completed by 1006015 before.docx
Need a nonplagiarised paper and a form completed by 1006015 before.docxNeed a nonplagiarised paper and a form completed by 1006015 before.docx
Need a nonplagiarised paper and a form completed by 1006015 before.docx
 
·Quantitative Data Analysis StatisticsIntroductionUnd.docx
·Quantitative Data Analysis StatisticsIntroductionUnd.docx·Quantitative Data Analysis StatisticsIntroductionUnd.docx
·Quantitative Data Analysis StatisticsIntroductionUnd.docx
 
Biostatistics clinical research & trials
Biostatistics clinical research & trialsBiostatistics clinical research & trials
Biostatistics clinical research & trials
 
PUB- Advanced Statistical Methods in Meta-analysis Enhancing Accuracy, Reliab...
PUB- Advanced Statistical Methods in Meta-analysis Enhancing Accuracy, Reliab...PUB- Advanced Statistical Methods in Meta-analysis Enhancing Accuracy, Reliab...
PUB- Advanced Statistical Methods in Meta-analysis Enhancing Accuracy, Reliab...
 

More from ShriramKargaonkar

Chi-square-Distribution: Introduction & Applications
Chi-square-Distribution: Introduction & ApplicationsChi-square-Distribution: Introduction & Applications
Chi-square-Distribution: Introduction & ApplicationsShriramKargaonkar
 
Introduction-to-Tests based on T-distribution.pptx
Introduction-to-Tests based on T-distribution.pptxIntroduction-to-Tests based on T-distribution.pptx
Introduction-to-Tests based on T-distribution.pptxShriramKargaonkar
 
Introduction-to-Hypothesis-Testing Explained in detail
Introduction-to-Hypothesis-Testing Explained in detailIntroduction-to-Hypothesis-Testing Explained in detail
Introduction-to-Hypothesis-Testing Explained in detailShriramKargaonkar
 
Introduction-to-Non-Linear-Regression.pptx
Introduction-to-Non-Linear-Regression.pptxIntroduction-to-Non-Linear-Regression.pptx
Introduction-to-Non-Linear-Regression.pptxShriramKargaonkar
 
REGRESSION ANALYSIS THEORY EXPLAINED HERE
REGRESSION ANALYSIS THEORY EXPLAINED HEREREGRESSION ANALYSIS THEORY EXPLAINED HERE
REGRESSION ANALYSIS THEORY EXPLAINED HEREShriramKargaonkar
 
2. Introduction-to-Measures-of-Central-Tendency.pptx
2. Introduction-to-Measures-of-Central-Tendency.pptx2. Introduction-to-Measures-of-Central-Tendency.pptx
2. Introduction-to-Measures-of-Central-Tendency.pptxShriramKargaonkar
 
An-Introduction-to-Correlation-and-Linear-Regression FYBSc(IT) SNK.pptx
An-Introduction-to-Correlation-and-Linear-Regression FYBSc(IT) SNK.pptxAn-Introduction-to-Correlation-and-Linear-Regression FYBSc(IT) SNK.pptx
An-Introduction-to-Correlation-and-Linear-Regression FYBSc(IT) SNK.pptxShriramKargaonkar
 
PPT Concepts Relating to Testing of Hypothesis.pptx
PPT Concepts Relating to Testing of Hypothesis.pptxPPT Concepts Relating to Testing of Hypothesis.pptx
PPT Concepts Relating to Testing of Hypothesis.pptxShriramKargaonkar
 
Population and Sample Testing of Hypothesis
Population and Sample Testing of HypothesisPopulation and Sample Testing of Hypothesis
Population and Sample Testing of HypothesisShriramKargaonkar
 
MS 1_Definition of Statistics.pptx
MS 1_Definition of Statistics.pptxMS 1_Definition of Statistics.pptx
MS 1_Definition of Statistics.pptxShriramKargaonkar
 
Population and Sample CPDTH.pptx
Population and Sample CPDTH.pptxPopulation and Sample CPDTH.pptx
Population and Sample CPDTH.pptxShriramKargaonkar
 
3. Concepts Relating to Testing of Hypothesis.pptx
3. Concepts Relating to Testing of Hypothesis.pptx3. Concepts Relating to Testing of Hypothesis.pptx
3. Concepts Relating to Testing of Hypothesis.pptxShriramKargaonkar
 

More from ShriramKargaonkar (16)

Chi-square-Distribution: Introduction & Applications
Chi-square-Distribution: Introduction & ApplicationsChi-square-Distribution: Introduction & Applications
Chi-square-Distribution: Introduction & Applications
 
Introduction-to-Tests based on T-distribution.pptx
Introduction-to-Tests based on T-distribution.pptxIntroduction-to-Tests based on T-distribution.pptx
Introduction-to-Tests based on T-distribution.pptx
 
Introduction-to-Hypothesis-Testing Explained in detail
Introduction-to-Hypothesis-Testing Explained in detailIntroduction-to-Hypothesis-Testing Explained in detail
Introduction-to-Hypothesis-Testing Explained in detail
 
Introduction-to-Non-Linear-Regression.pptx
Introduction-to-Non-Linear-Regression.pptxIntroduction-to-Non-Linear-Regression.pptx
Introduction-to-Non-Linear-Regression.pptx
 
REGRESSION ANALYSIS THEORY EXPLAINED HERE
REGRESSION ANALYSIS THEORY EXPLAINED HEREREGRESSION ANALYSIS THEORY EXPLAINED HERE
REGRESSION ANALYSIS THEORY EXPLAINED HERE
 
2. Introduction-to-Measures-of-Central-Tendency.pptx
2. Introduction-to-Measures-of-Central-Tendency.pptx2. Introduction-to-Measures-of-Central-Tendency.pptx
2. Introduction-to-Measures-of-Central-Tendency.pptx
 
An-Introduction-to-Correlation-and-Linear-Regression FYBSc(IT) SNK.pptx
An-Introduction-to-Correlation-and-Linear-Regression FYBSc(IT) SNK.pptxAn-Introduction-to-Correlation-and-Linear-Regression FYBSc(IT) SNK.pptx
An-Introduction-to-Correlation-and-Linear-Regression FYBSc(IT) SNK.pptx
 
PPT Concepts Relating to Testing of Hypothesis.pptx
PPT Concepts Relating to Testing of Hypothesis.pptxPPT Concepts Relating to Testing of Hypothesis.pptx
PPT Concepts Relating to Testing of Hypothesis.pptx
 
Population and Sample Testing of Hypothesis
Population and Sample Testing of HypothesisPopulation and Sample Testing of Hypothesis
Population and Sample Testing of Hypothesis
 
MS 1_Definition of Statistics.pptx
MS 1_Definition of Statistics.pptxMS 1_Definition of Statistics.pptx
MS 1_Definition of Statistics.pptx
 
DS-Intro.pptx
DS-Intro.pptxDS-Intro.pptx
DS-Intro.pptx
 
MS-Intro.pptx
MS-Intro.pptxMS-Intro.pptx
MS-Intro.pptx
 
DS 4_CT_1.pptx
DS 4_CT_1.pptxDS 4_CT_1.pptx
DS 4_CT_1.pptx
 
Sampling Methods.pptx
Sampling Methods.pptxSampling Methods.pptx
Sampling Methods.pptx
 
Population and Sample CPDTH.pptx
Population and Sample CPDTH.pptxPopulation and Sample CPDTH.pptx
Population and Sample CPDTH.pptx
 
3. Concepts Relating to Testing of Hypothesis.pptx
3. Concepts Relating to Testing of Hypothesis.pptx3. Concepts Relating to Testing of Hypothesis.pptx
3. Concepts Relating to Testing of Hypothesis.pptx
 

Recently uploaded

Beyond the EU: DORA and NIS 2 Directive's Global Impact
Beyond the EU: DORA and NIS 2 Directive's Global ImpactBeyond the EU: DORA and NIS 2 Directive's Global Impact
Beyond the EU: DORA and NIS 2 Directive's Global ImpactPECB
 
Introduction to ArtificiaI Intelligence in Higher Education
Introduction to ArtificiaI Intelligence in Higher EducationIntroduction to ArtificiaI Intelligence in Higher Education
Introduction to ArtificiaI Intelligence in Higher Educationpboyjonauth
 
Industrial Policy - 1948, 1956, 1973, 1977, 1980, 1991
Industrial Policy - 1948, 1956, 1973, 1977, 1980, 1991Industrial Policy - 1948, 1956, 1973, 1977, 1980, 1991
Industrial Policy - 1948, 1956, 1973, 1977, 1980, 1991RKavithamani
 
1029-Danh muc Sach Giao Khoa khoi 6.pdf
1029-Danh muc Sach Giao Khoa khoi  6.pdf1029-Danh muc Sach Giao Khoa khoi  6.pdf
1029-Danh muc Sach Giao Khoa khoi 6.pdfQucHHunhnh
 
Interactive Powerpoint_How to Master effective communication
Interactive Powerpoint_How to Master effective communicationInteractive Powerpoint_How to Master effective communication
Interactive Powerpoint_How to Master effective communicationnomboosow
 
Mastering the Unannounced Regulatory Inspection
Mastering the Unannounced Regulatory InspectionMastering the Unannounced Regulatory Inspection
Mastering the Unannounced Regulatory InspectionSafetyChain Software
 
CARE OF CHILD IN INCUBATOR..........pptx
CARE OF CHILD IN INCUBATOR..........pptxCARE OF CHILD IN INCUBATOR..........pptx
CARE OF CHILD IN INCUBATOR..........pptxGaneshChakor2
 
18-04-UA_REPORT_MEDIALITERAСY_INDEX-DM_23-1-final-eng.pdf
18-04-UA_REPORT_MEDIALITERAСY_INDEX-DM_23-1-final-eng.pdf18-04-UA_REPORT_MEDIALITERAСY_INDEX-DM_23-1-final-eng.pdf
18-04-UA_REPORT_MEDIALITERAСY_INDEX-DM_23-1-final-eng.pdfssuser54595a
 
1029 - Danh muc Sach Giao Khoa 10 . pdf
1029 -  Danh muc Sach Giao Khoa 10 . pdf1029 -  Danh muc Sach Giao Khoa 10 . pdf
1029 - Danh muc Sach Giao Khoa 10 . pdfQucHHunhnh
 
Accessible design: Minimum effort, maximum impact
Accessible design: Minimum effort, maximum impactAccessible design: Minimum effort, maximum impact
Accessible design: Minimum effort, maximum impactdawncurless
 
Web & Social Media Analytics Previous Year Question Paper.pdf
Web & Social Media Analytics Previous Year Question Paper.pdfWeb & Social Media Analytics Previous Year Question Paper.pdf
Web & Social Media Analytics Previous Year Question Paper.pdfJayanti Pande
 
BASLIQ CURRENT LOOKBOOK LOOKBOOK(1) (1).pdf
BASLIQ CURRENT LOOKBOOK  LOOKBOOK(1) (1).pdfBASLIQ CURRENT LOOKBOOK  LOOKBOOK(1) (1).pdf
BASLIQ CURRENT LOOKBOOK LOOKBOOK(1) (1).pdfSoniaTolstoy
 
Kisan Call Centre - To harness potential of ICT in Agriculture by answer farm...
Kisan Call Centre - To harness potential of ICT in Agriculture by answer farm...Kisan Call Centre - To harness potential of ICT in Agriculture by answer farm...
Kisan Call Centre - To harness potential of ICT in Agriculture by answer farm...Krashi Coaching
 
Presentation by Andreas Schleicher Tackling the School Absenteeism Crisis 30 ...
Presentation by Andreas Schleicher Tackling the School Absenteeism Crisis 30 ...Presentation by Andreas Schleicher Tackling the School Absenteeism Crisis 30 ...
Presentation by Andreas Schleicher Tackling the School Absenteeism Crisis 30 ...EduSkills OECD
 
Software Engineering Methodologies (overview)
Software Engineering Methodologies (overview)Software Engineering Methodologies (overview)
Software Engineering Methodologies (overview)eniolaolutunde
 
URLs and Routing in the Odoo 17 Website App
URLs and Routing in the Odoo 17 Website AppURLs and Routing in the Odoo 17 Website App
URLs and Routing in the Odoo 17 Website AppCeline George
 
Organic Name Reactions for the students and aspirants of Chemistry12th.pptx
Organic Name Reactions  for the students and aspirants of Chemistry12th.pptxOrganic Name Reactions  for the students and aspirants of Chemistry12th.pptx
Organic Name Reactions for the students and aspirants of Chemistry12th.pptxVS Mahajan Coaching Centre
 
Nutritional Needs Presentation - HLTH 104
Nutritional Needs Presentation - HLTH 104Nutritional Needs Presentation - HLTH 104
Nutritional Needs Presentation - HLTH 104misteraugie
 

Recently uploaded (20)

Beyond the EU: DORA and NIS 2 Directive's Global Impact
Beyond the EU: DORA and NIS 2 Directive's Global ImpactBeyond the EU: DORA and NIS 2 Directive's Global Impact
Beyond the EU: DORA and NIS 2 Directive's Global Impact
 
Introduction to ArtificiaI Intelligence in Higher Education
Introduction to ArtificiaI Intelligence in Higher EducationIntroduction to ArtificiaI Intelligence in Higher Education
Introduction to ArtificiaI Intelligence in Higher Education
 
Mattingly "AI & Prompt Design: The Basics of Prompt Design"
Mattingly "AI & Prompt Design: The Basics of Prompt Design"Mattingly "AI & Prompt Design: The Basics of Prompt Design"
Mattingly "AI & Prompt Design: The Basics of Prompt Design"
 
Industrial Policy - 1948, 1956, 1973, 1977, 1980, 1991
Industrial Policy - 1948, 1956, 1973, 1977, 1980, 1991Industrial Policy - 1948, 1956, 1973, 1977, 1980, 1991
Industrial Policy - 1948, 1956, 1973, 1977, 1980, 1991
 
1029-Danh muc Sach Giao Khoa khoi 6.pdf
1029-Danh muc Sach Giao Khoa khoi  6.pdf1029-Danh muc Sach Giao Khoa khoi  6.pdf
1029-Danh muc Sach Giao Khoa khoi 6.pdf
 
Interactive Powerpoint_How to Master effective communication
Interactive Powerpoint_How to Master effective communicationInteractive Powerpoint_How to Master effective communication
Interactive Powerpoint_How to Master effective communication
 
Mastering the Unannounced Regulatory Inspection
Mastering the Unannounced Regulatory InspectionMastering the Unannounced Regulatory Inspection
Mastering the Unannounced Regulatory Inspection
 
CARE OF CHILD IN INCUBATOR..........pptx
CARE OF CHILD IN INCUBATOR..........pptxCARE OF CHILD IN INCUBATOR..........pptx
CARE OF CHILD IN INCUBATOR..........pptx
 
Staff of Color (SOC) Retention Efforts DDSD
Staff of Color (SOC) Retention Efforts DDSDStaff of Color (SOC) Retention Efforts DDSD
Staff of Color (SOC) Retention Efforts DDSD
 
18-04-UA_REPORT_MEDIALITERAСY_INDEX-DM_23-1-final-eng.pdf
18-04-UA_REPORT_MEDIALITERAСY_INDEX-DM_23-1-final-eng.pdf18-04-UA_REPORT_MEDIALITERAСY_INDEX-DM_23-1-final-eng.pdf
18-04-UA_REPORT_MEDIALITERAСY_INDEX-DM_23-1-final-eng.pdf
 
1029 - Danh muc Sach Giao Khoa 10 . pdf
1029 -  Danh muc Sach Giao Khoa 10 . pdf1029 -  Danh muc Sach Giao Khoa 10 . pdf
1029 - Danh muc Sach Giao Khoa 10 . pdf
 
Accessible design: Minimum effort, maximum impact
Accessible design: Minimum effort, maximum impactAccessible design: Minimum effort, maximum impact
Accessible design: Minimum effort, maximum impact
 
Web & Social Media Analytics Previous Year Question Paper.pdf
Web & Social Media Analytics Previous Year Question Paper.pdfWeb & Social Media Analytics Previous Year Question Paper.pdf
Web & Social Media Analytics Previous Year Question Paper.pdf
 
BASLIQ CURRENT LOOKBOOK LOOKBOOK(1) (1).pdf
BASLIQ CURRENT LOOKBOOK  LOOKBOOK(1) (1).pdfBASLIQ CURRENT LOOKBOOK  LOOKBOOK(1) (1).pdf
BASLIQ CURRENT LOOKBOOK LOOKBOOK(1) (1).pdf
 
Kisan Call Centre - To harness potential of ICT in Agriculture by answer farm...
Kisan Call Centre - To harness potential of ICT in Agriculture by answer farm...Kisan Call Centre - To harness potential of ICT in Agriculture by answer farm...
Kisan Call Centre - To harness potential of ICT in Agriculture by answer farm...
 
Presentation by Andreas Schleicher Tackling the School Absenteeism Crisis 30 ...
Presentation by Andreas Schleicher Tackling the School Absenteeism Crisis 30 ...Presentation by Andreas Schleicher Tackling the School Absenteeism Crisis 30 ...
Presentation by Andreas Schleicher Tackling the School Absenteeism Crisis 30 ...
 
Software Engineering Methodologies (overview)
Software Engineering Methodologies (overview)Software Engineering Methodologies (overview)
Software Engineering Methodologies (overview)
 
URLs and Routing in the Odoo 17 Website App
URLs and Routing in the Odoo 17 Website AppURLs and Routing in the Odoo 17 Website App
URLs and Routing in the Odoo 17 Website App
 
Organic Name Reactions for the students and aspirants of Chemistry12th.pptx
Organic Name Reactions  for the students and aspirants of Chemistry12th.pptxOrganic Name Reactions  for the students and aspirants of Chemistry12th.pptx
Organic Name Reactions for the students and aspirants of Chemistry12th.pptx
 
Nutritional Needs Presentation - HLTH 104
Nutritional Needs Presentation - HLTH 104Nutritional Needs Presentation - HLTH 104
Nutritional Needs Presentation - HLTH 104
 

Introduction-to-Parametric-and-Non-Parametric-Tests.pptx

  • 1. Introduction to Parametric and Non-Parametric Tests In the realm of statistical analysis, researchers often encounter situations where they need to choose between parametric and non-parametric tests to analyze their data. Parametric tests are a family of statistical methods that make specific assumptions about the underlying distribution of the data, such as normality, equal variances, and independence. On the other hand, non- parametric tests do not rely on these assumptions and are often more robust to violations of these assumptions. Understanding the differences between these two types of tests is crucial for researchers to select the appropriate analysis method for their research questions and data characteristics. Sa by Shriram Kargaonkar
  • 2. Definition of Parametric Tests Defined by Underlying Assumptions Parametric tests are a class of statistical tests that make specific assumptions about the underlying distribution of the data. These assumptions typically include that the data follows a normal distribution, has equal variances across groups, and has independence between observations. Parametric tests are designed to be more powerful and precise when these assumptions are met, as they can leverage information about the shape and parameters of the underlying distribution. Rely on Population Parameters Parametric tests use information about the population parameters, such as the mean and standard deviation, to make inferences about the data. This allows them to provide more detailed and robust conclusions compared to non-parametric tests, which make fewer assumptions about the underlying distribution. Parametric tests are often the preferred choice when the necessary assumptions can be confidently met. Widely Used in Research Parametric tests are widely used across various fields of research, including psychology, biology, and economics. They are a fundamental part of the statistical toolbox and are often the starting point for data analysis. Researchers rely on parametric tests to draw conclusions about populations, test hypotheses, and quantify the strength of relationships between variables.
  • 3. Assumptions of Parametric Tests Parametric tests are a class of statistical tests that make certain assumptions about the underlying distribution of the data being analyzed. These assumptions are crucial for the validity and reliability of the test results. The key assumptions of parametric tests include: 1. Normality: Parametric tests assume that the data is normally distributed, meaning that the distribution of the variable follows a bell-shaped curve. This assumption is important because many statistical methods, such as t-tests and ANOVA, rely on the normal distribution for their validity. 2. Homogeneity of Variance: Parametric tests also assume that the variance (or spread) of the data is the same across the different groups or conditions being compared. This assumption is known as homogeneity of variance or homoscedasticity. 3. Independence: Parametric tests require that the observations in the data set are independent of one another. This means that the value of one observation should not depend on the value of another observation. 4. Interval or Ratio Scale: Parametric tests assume that the data is measured on an interval or ratio scale, meaning that the differences between the values are meaningful and can be interpreted numerically. If these assumptions are not met, the validity of the parametric test results may be compromised, and the conclusions drawn from the analysis may be inaccurate or misleading. In such cases, it may be necessary to use non-parametric tests, which have different assumptions and are more robust to violations of the parametric test assumptions.
  • 4. Understanding Non- Parametric Tests Non-parametric tests are a class of statistical methods that do not rely on specific assumptions about the shape of the data distribution, such as the normal distribution. These tests are used when the data does not meet the requirements of parametric tests, such as when the data is not normally distributed or when the variances are not equal. Non-parametric tests are based on ranking or ordering the data rather than using the actual data values directly. This approach makes them more robust and less affected by outliers or violations of assumptions. Non-parametric tests are often preferred when the sample size is small, the data is ordinal or ranked, or when the distribution of the data is unknown or cannot be assumed to be normal.
  • 5. Assumptions of Non-Parametric Tests No Assumption of Normality Non-parametric tests do not assume that the data is normally distributed. This is a key difference from parametric tests, which rely on the assumption of normality for their statistical inferences. Non-parametric tests are more robust to deviations from normality, making them suitable for analyzing data that does not meet the normality assumption. No Assumption of Homogeneity of Variance Unlike parametric tests, non-parametric tests do not require the assumption of homogeneity of variance. This means that the variances of the populations being compared do not need to be equal. This makes non-parametric tests more appropriate when the assumption of equal variances is violated, as is often the case with real-world data. No Assumption of Interval or Ratio Scales Non-parametric tests can be used with ordinal, ranked, or even categorical data, as they do not require the data to be on an interval or ratio scale. This flexibility allows non-parametric tests to be applied to a wider range of research questions and data types, making them a useful tool for researchers working with data that does not meet the assumptions of parametric tests.
  • 6. Advantages of Parametric Tests Statistical Power Parametric tests generally have higher statistical power compared to non-parametric tests when the data meets the necessary assumptions. This means they are more likely to detect an effect or difference if one truly exists, reducing the risk of a false negative result. Precision and Sensitivity Parametric tests can provide more precise and sensitive measurements because they make use of the full information contained in the data, such as the means and variances. This allows for more nuanced analyses and the detection of smaller effects. Familiarity and Interpretability Parametric tests are widely used and well- understood statistical methods, with a rich body of literature and established conventions. This familiarity makes the results more interpretable and easier to communicate to a broader audience. Parametric Modeling Parametric tests can be used to fit complex statistical models that allow for the exploration of relationships between multiple variables. This flexibility is valuable in many research and applied settings where understanding these relationships is important.
  • 7. Advantages of Non-Parametric Tests Flexibility Non-parametric tests are more flexible than parametric tests because they do not rely on strict assumptions about the underlying distribution of the data. This makes them well- suited for analyzing data that may not follow a normal distribution or have equal variances, which are common assumptions of parametric tests. Robustness Non-parametric tests are more robust to outliers and extreme values in the data. Parametric tests can be heavily influenced by outliers, which can skew the results. Non- parametric tests, on the other hand, are less sensitive to these extreme values, making them more reliable for datasets with unusual distributions. Ordinal Data Non-parametric tests are particularly useful for analyzing ordinal data, which are data that can be ranked but do not have a meaningful numerical scale. Parametric tests, which rely on numerical values, are not well-suited for this type of data, whereas non-parametric tests can effectively analyze ordinal data. Small Sample Sizes Non-parametric tests can be more effective than parametric tests when the sample size is small. Parametric tests often require larger sample sizes to ensure the assumptions are met, whereas non- parametric tests can provide reliable results even with smaller datasets.
  • 8. Situations Requiring Non-Parametric Tests 1 Small Samples When the sample size is small and the distribution of the data is unknown. 2 Non-Normal Distributions When the data does not follow a normal distribution. 3 Ordinal Data For data measured on an ordinal scale, such as ratings or rankings. 4 Heterogeneous Variances When the variances of the populations are not equal. Non-parametric tests are often required when the assumptions of parametric tests are violated. This can occur in a variety of situations, such as when the sample size is small, the data does not follow a normal distribution, the data is measured on an ordinal scale, or the variances of the populations are not equal. In these cases, non-parametric tests can provide more robust and reliable results than their parametric counterparts. For example, if you're comparing the median income of two different neighborhoods, a non-parametric test like the Mann-Whitney U test would be appropriate, as the income data may not follow a normal distribution.
  • 9. Examples of Parametric and Non- Parametric Tests Parametric tests are widely used statistical methods that make assumptions about the underlying distribution of the data, such as normality and equal variances. Some common examples of parametric tests include: 1. t-test: Used to compare the means of two groups, such as comparing the average test scores of a control group and an experimental group. 2. ANOVA (Analysis of Variance): Used to compare the means of three or more groups, such as comparing the performance of different treatment groups in a clinical trial. 3. Pearson's correlation: Used to measure the linear relationship between two continuous variables, such as the relationship between income and education level. On the other hand, non-parametric tests are more flexible and do not make assumptions about the underlying data distribution. Some examples of non-parametric tests include: 1. Mann-Whitney U test: Used to compare
  • 10. Conclusion and Takeaways In conclusion, the key differences between parametric and non-parametric tests lie in their underlying assumptions and the type of data they can effectively analyze. Parametric tests, such as the t-test and ANOVA, rely on specific assumptions about the distribution of the data, including normality and homogeneity of variance. These tests are powerful when the assumptions are met, providing robust and precise results. In contrast, non-parametric tests, like the Mann-Whitney U test and the Kruskal-Wallis test, make fewer assumptions about the data distribution and are more flexible in their application. They are particularly useful when the data is ordinal, skewed, or does not follow a normal distribution. The choice between parametric and non-parametric tests ultimately depends on the characteristics of the data and the research question at hand. Parametric tests are generally preferred when the assumptions are met, as they offer greater statistical power and the ability to make more precise inferences. However, when the assumptions are violated, non-parametric tests become the more appropriate choice, as they can provide reliable and valid results without the need for strict distributional assumptions. Researchers should carefully evaluate the assumptions of their data and select the most appropriate statistical test to ensure accurate and meaningful conclusions. In summary, understanding the differences between parametric and non-parametric tests, their assumptions, and their respective strengths and weaknesses is crucial for researchers to select the most suitable analytical approach for their specific research questions and data characteristics. By considering these factors, researchers can ensure the validity and reliability of their findings and draw meaningful insights from their data.