Downloaded 1,730 times


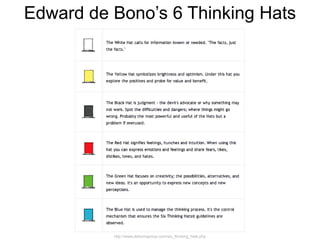

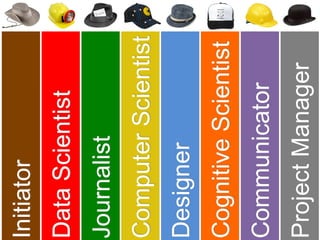
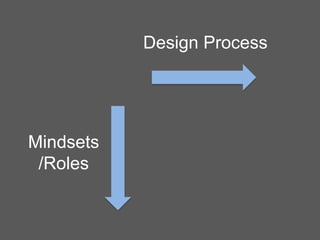


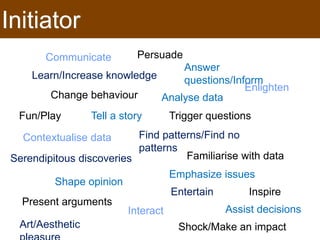


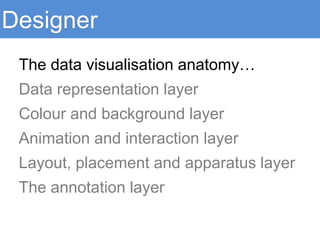
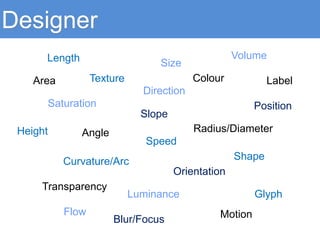


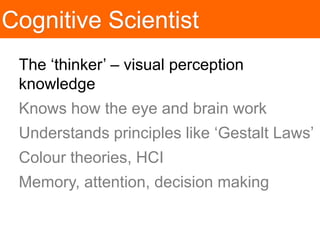
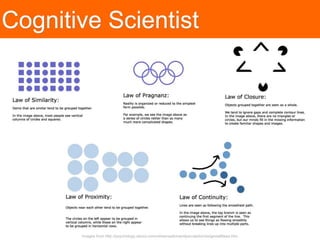


The document discusses the principles and roles involved in effective data visualization design, referencing Edward de Bono's '6 Thinking Hats' to introduce eight roles, including data scientist, journalist, computer scientist, and designer. It emphasizes the importance of human skills in visual communication, highlighting the need for collaboration among various experts to successfully convey data-driven narratives. The content is structured around the design process, focusing on cognitive understanding and the diverse capabilities needed to create compelling visual representations.