Matplotlib is a powerful Python library for 2D data visualization built on NumPy, introduced by John Hunter in 2002. It supports various plot types like line, bar, histogram, and scatter, and allows for multi-plot creation with the .subplot() method. It is essential for data analysis and can enhance machine learning models through effective visualization techniques.


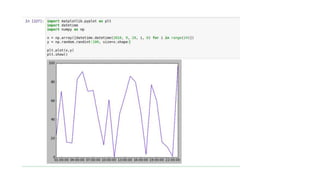
![Line plot :
• # importing matplotlib module
• from matplotlib import pyplot as plt
•
• # x-axis values
• x = [5, 2, 9, 4, 7]
•
• # Y-axis values
• y = [10, 5, 8, 4, 2]
•
• # Function to plot
• plt.plot(x,y)
•
• # function to show the plot
• plt.show()](https://image.slidesharecdn.com/introductiontomatplotlib-190615083154/85/Introduction-to-matplotlib-5-320.jpg)
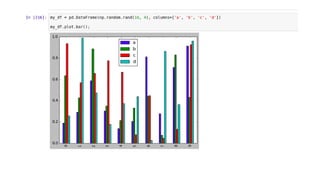
![Bar plot :
• # importing matplotlib module
• from matplotlib import pyplot as plt
•
• # x-axis values
• x = [5, 2, 9, 4, 7]
•
• # Y-axis values
• y = [10, 5, 8, 4, 2]
•
• # Function to plot the bar
• plt.bar(x,y)
•
• # function to show the plot
• plt.show()](https://image.slidesharecdn.com/introductiontomatplotlib-190615083154/85/Introduction-to-matplotlib-6-320.jpg)
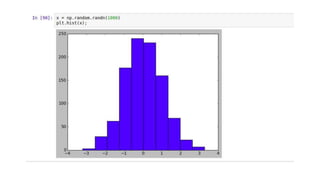
![Histogram :
• # importing matplotlib module
• from matplotlib import pyplot as plt
•
• # Y-axis values
• y = [10, 5, 8, 4, 2]
•
• # Function to plot histogram
• plt.hist(y)
•
• # Function to show the plot
• plt.show()](https://image.slidesharecdn.com/introductiontomatplotlib-190615083154/85/Introduction-to-matplotlib-7-320.jpg)
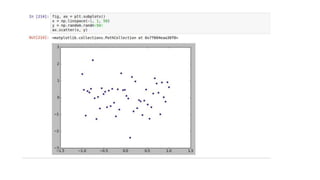
![Scatter Plot :
• # importing matplotlib module
• from matplotlib import pyplot as plt
•
• # x-axis values
• x = [5, 2, 9, 4, 7]
•
• # Y-axis values
• y = [10, 5, 8, 4, 2]
•
• # Function to plot scatter
• plt.scatter(x, y)
•
• # function to show the plot
• plt.show()](https://image.slidesharecdn.com/introductiontomatplotlib-190615083154/85/Introduction-to-matplotlib-8-320.jpg)


![Introduction to Pandas and Time Series Analysis [PyCon DE]](https://cdn.slidesharecdn.com/ss_thumbnails/introductiontopandasandtimeseriesanalysispyconde-170617163724-thumbnail.jpg?width=640&height=640&fit=bounds)