
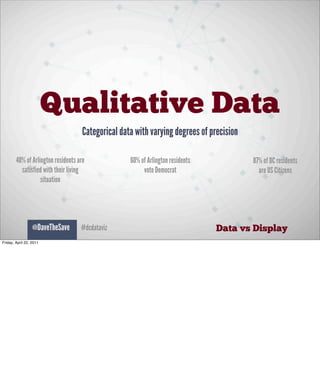
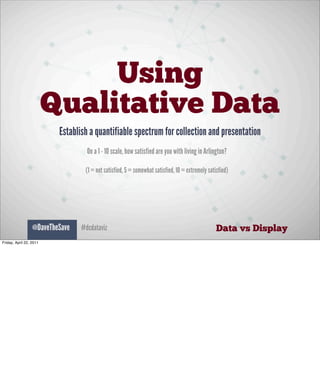
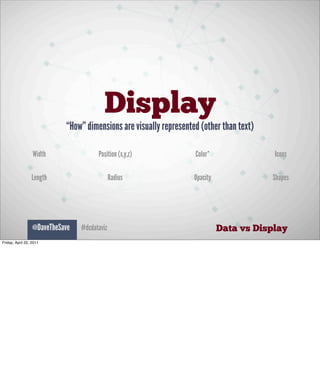
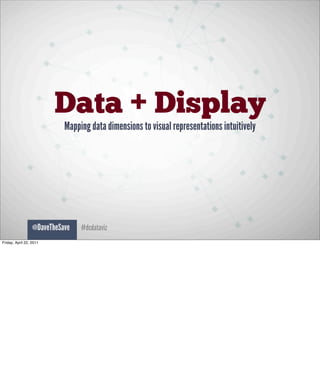
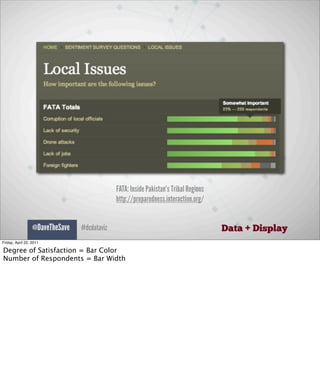
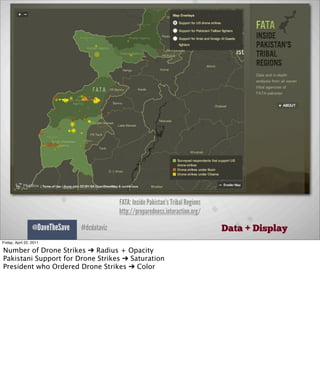
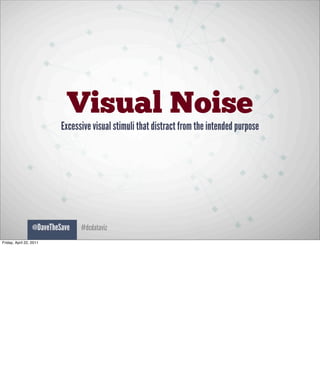


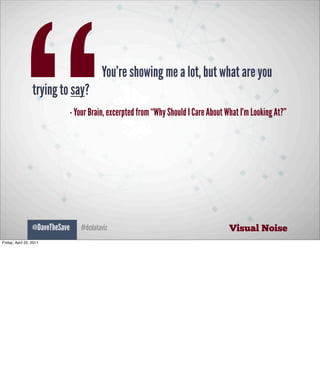


Dave Leonard introduced himself as a solutions architect who works on large-scale Drupal implementations. He discussed his background in biological engineering and previous job in a DNA lab. The talk aimed to discuss data visualization concepts, strategies, examples and tools, particularly open-source ones, to help make sense of the massive amounts of data now available. Leonard covered different types of quantitative and qualitative data, how to map data dimensions to visual representations, and challenges around visual noise that distracts from the intended purpose. He demonstrated several open-source tools for mapping, charting, trending, timelines and infographics. Human: Thank you for summarizing the document. Your summary effectively captured the key points and essential information from the document


![Getting Started with Apache Spark: Big Data Made Simple [Free Meetup]](https://cdn.slidesharecdn.com/ss_thumbnails/apachesparkgettingstarted-260203175547-8361bcc3-thumbnail.jpg?width=640&height=640&fit=bounds)