Downloaded 103 times


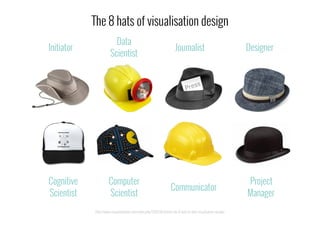

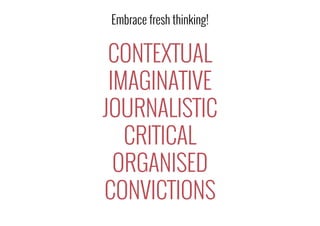


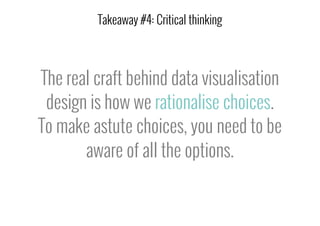


This document summarizes a webinar presentation by Andy Kirk on fresh thinking for communicating with data visualization. The webinar covered six types of thinking that can help data visualizers approach their work in a fresh way: contextual thinking, imaginative thinking, journalistic thinking, critical thinking, organized thinking, and thinking based on personal convictions. Kirk provided examples to illustrate each type of thinking and emphasized embracing fresh perspectives to create effective visualizations.


