Download to read offline


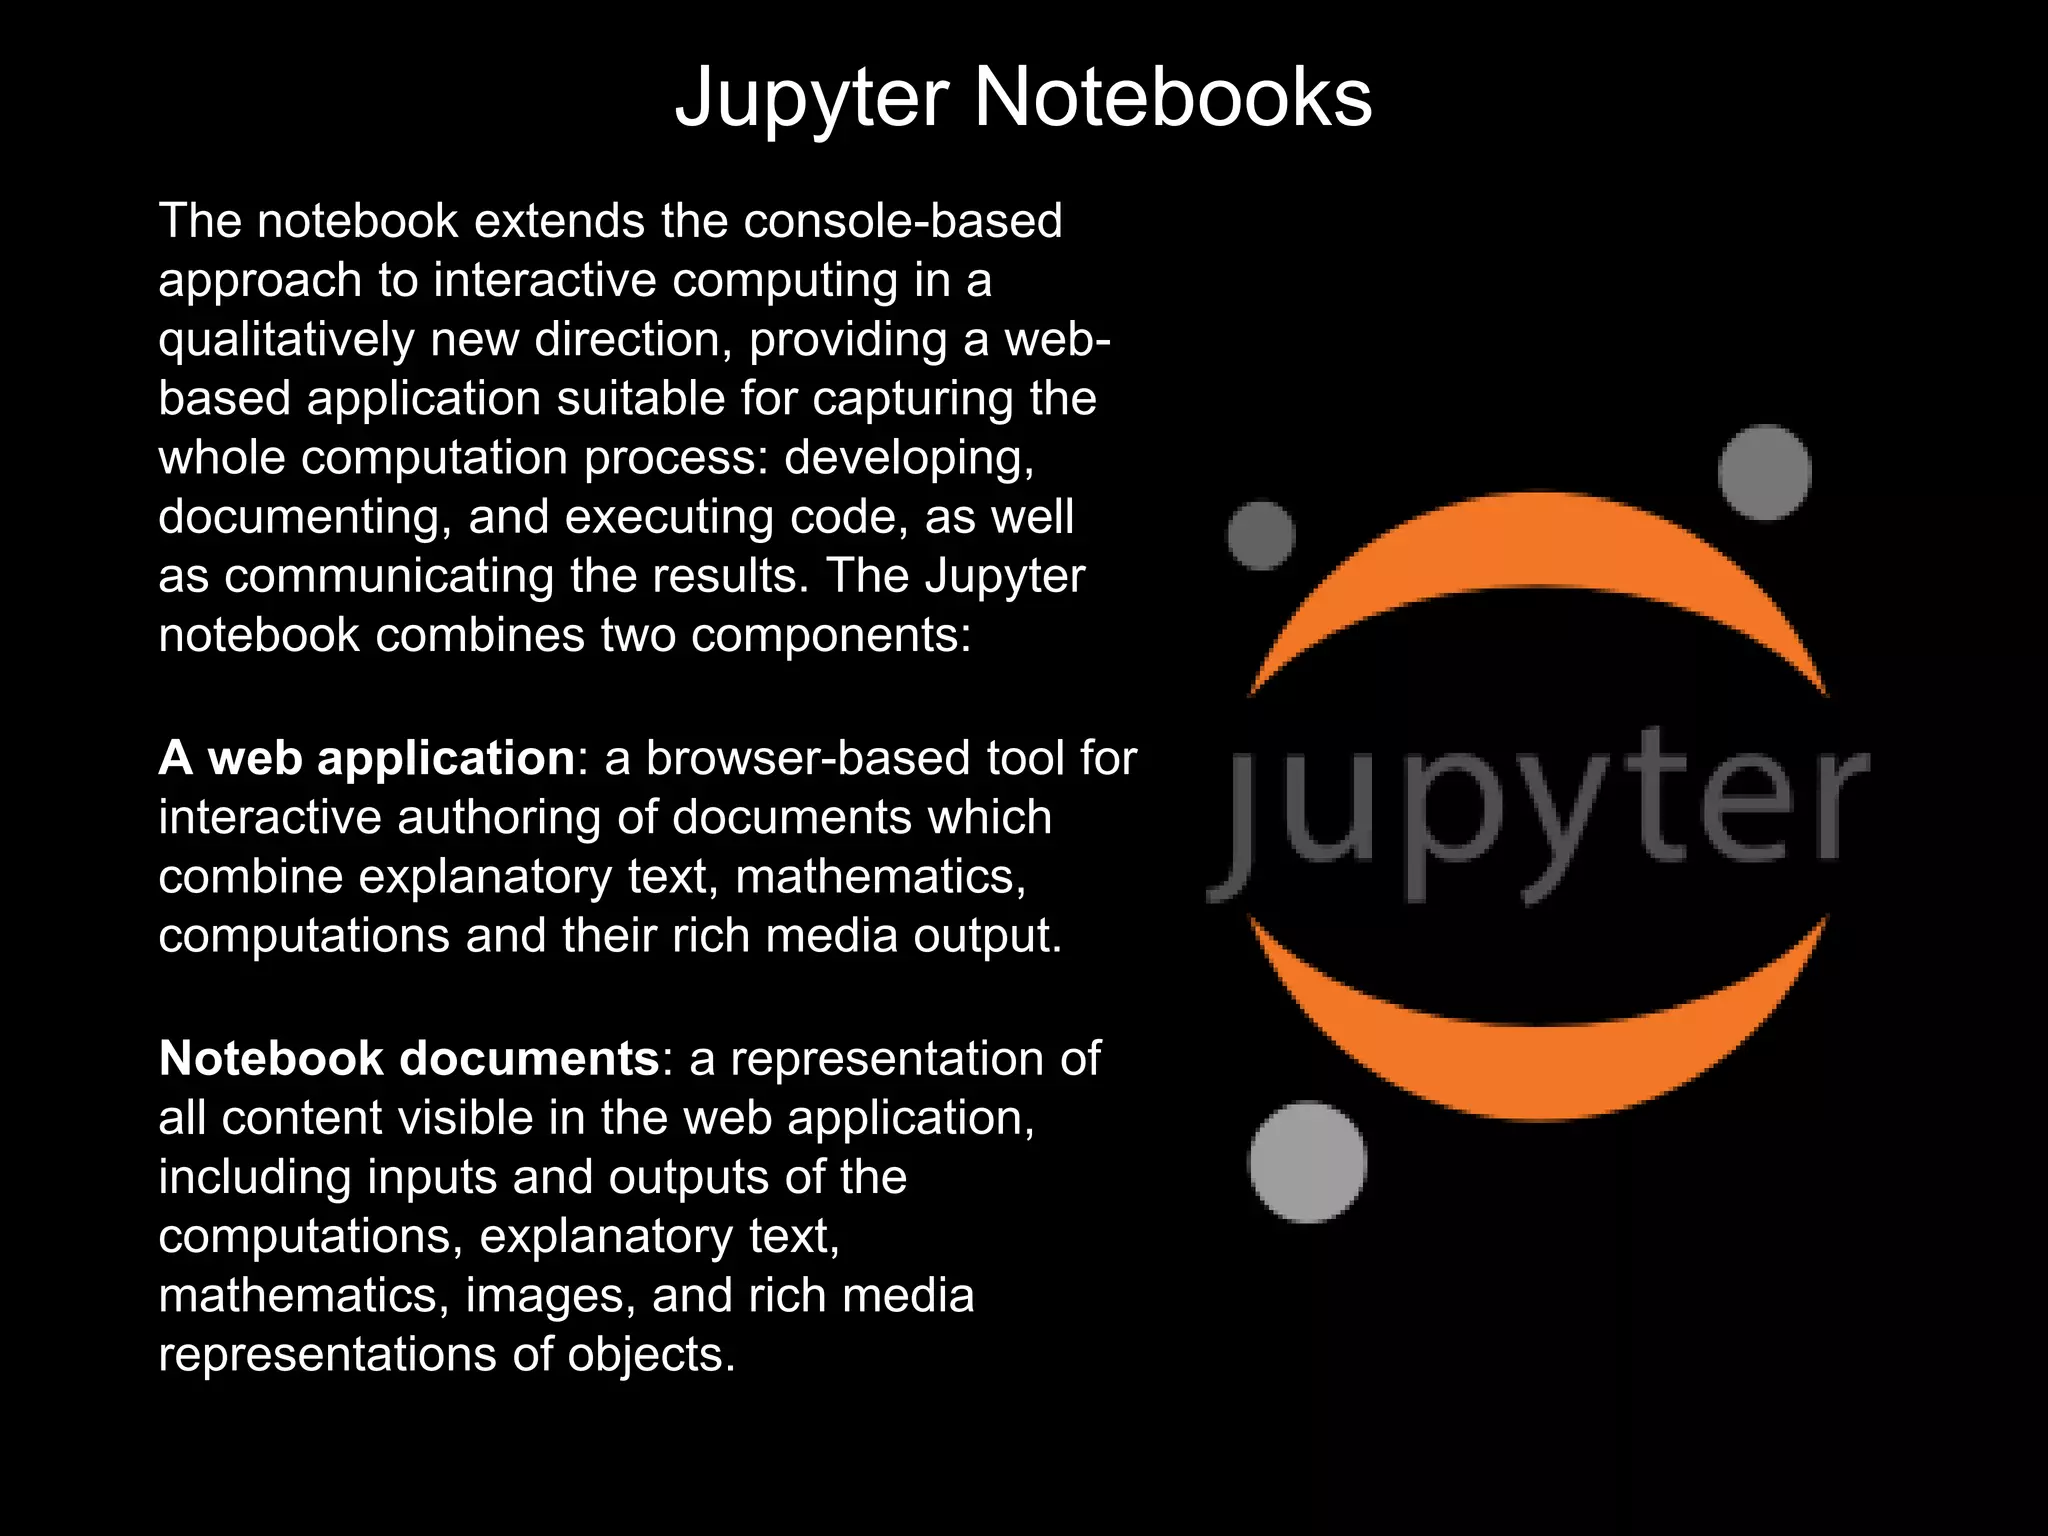


Jupyter Notebook is a web-based application that enhances interactive computing by allowing users to develop, document, and execute code while communicating results. It consists of a browser-based tool for authoring documents that combine explanatory text, mathematics, computations, and media outputs, and represents all content including inputs, outputs, and rich media. The document includes references for further learning and a video tour of the interface.